Influencer Marketing Statistics 2026: 60+ Facts
60+ influencer marketing statistics for 2026 with sources. Market size, ROI, platform data, influencer tiers, and fraud rates. Updated March 2026.
Siddharth Gangal • 2026-03-30 • SEO Tips
In This Article
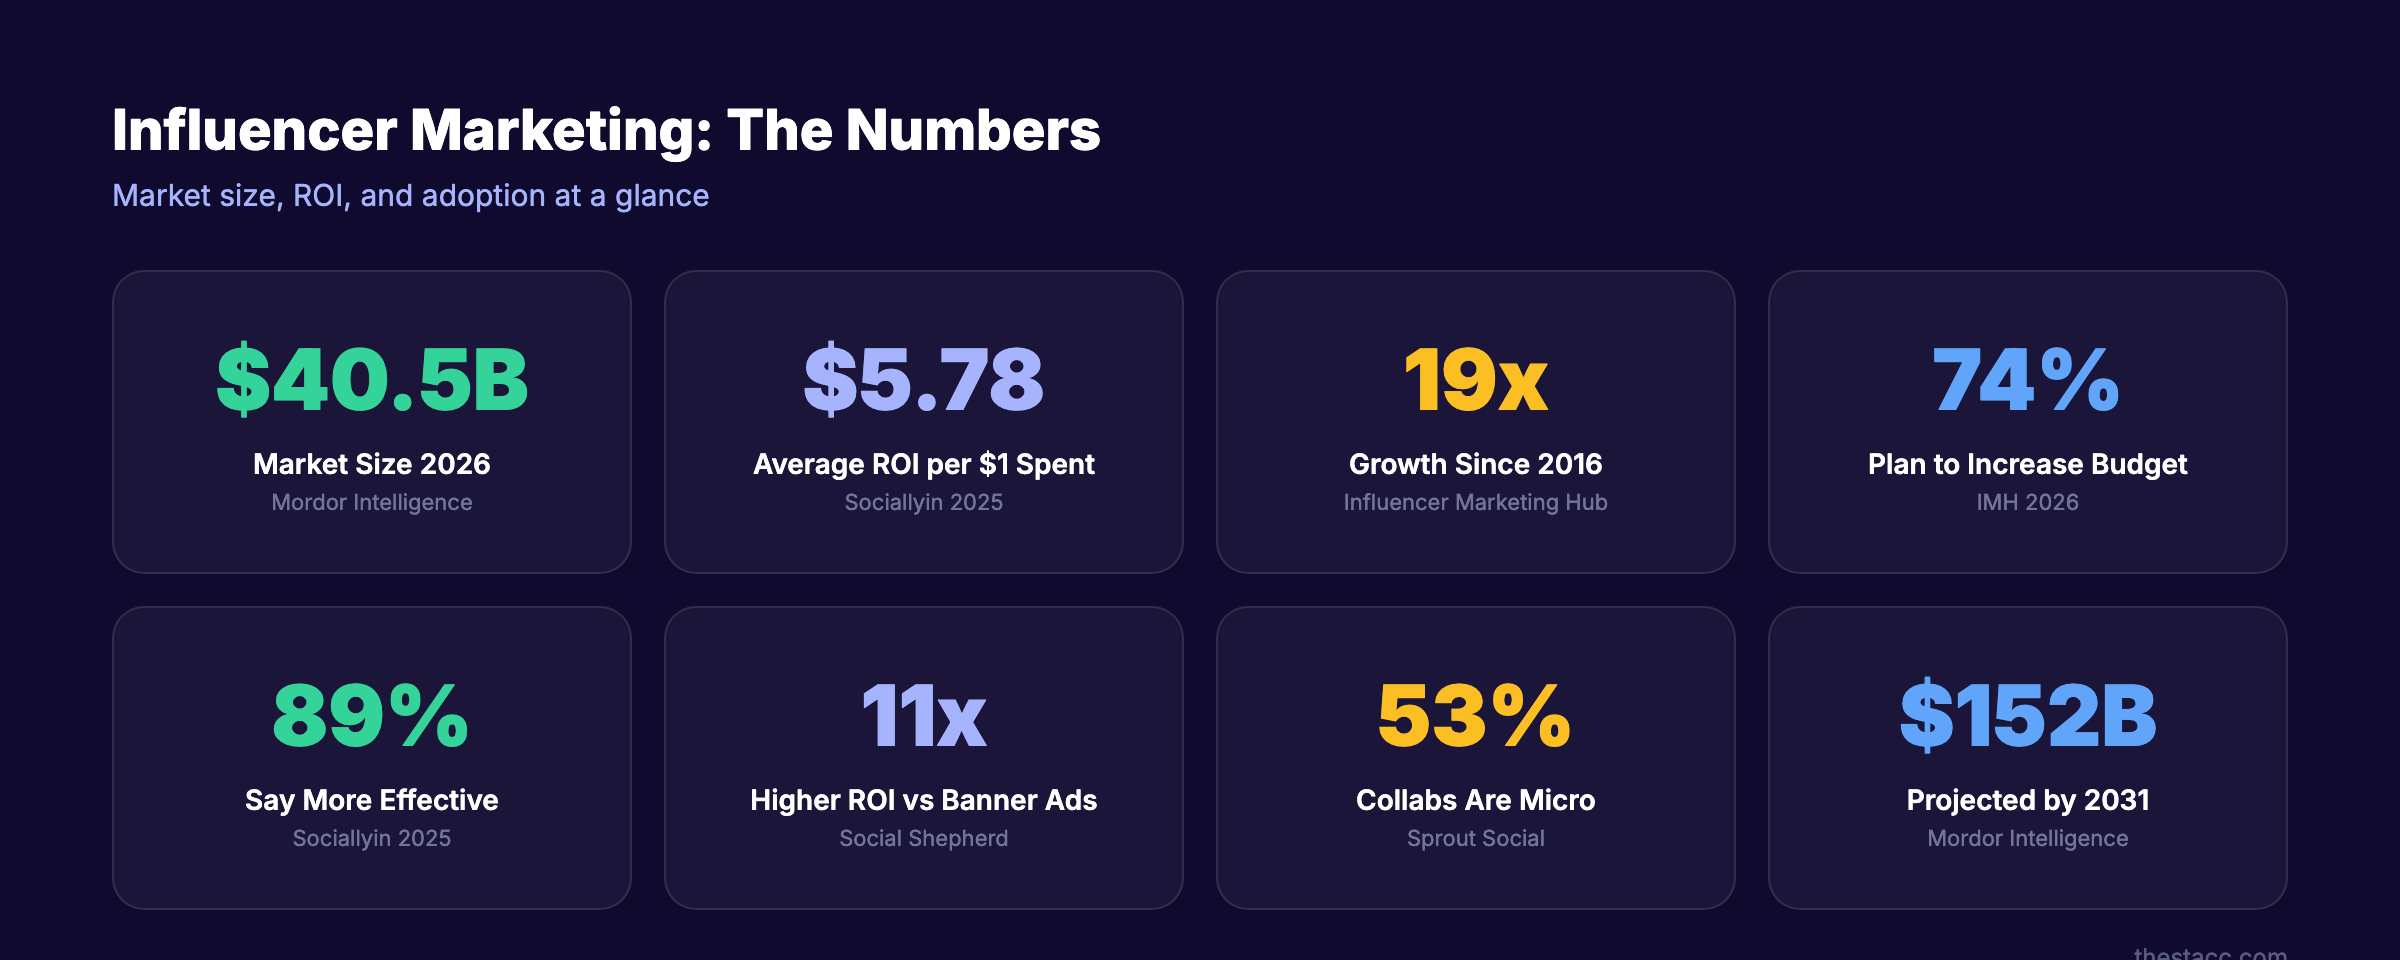
The influencer marketing industry hit $32.55 billion in 2025. It will reach $40.51 billion in 2026. Brands earn $5.78 for every $1 spent. But 37% of influencer followers are fake. These influencer marketing statistics tell the full story.
Influencer marketing affects how brands allocate budgets, which platforms they prioritize, and how they measure ROI. Whether you run social media marketing or content strategy, these numbers shape the decisions.
We compiled 60+ influencer marketing statistics from Influencer Marketing Hub, Sociallyin, Mordor Intelligence, and other primary sources. Every stat includes its source and year.
Last updated: March 2026
Market Size and Growth
1. The global influencer marketing industry is valued at $32.55 billion in 2025. (Source: Influencer Marketing Hub, 2025)
2. The market is estimated at $40.51 billion in 2026. (Source: Mordor Intelligence, 2026)
3. The industry grew 19x from $1.7 billion in 2016 to $32.55 billion in 2025. (Source: Sociallyin, 2025)
4. U.S. influencer marketing expenditure is projected at $12.17 billion in 2026. (Source: Sociallyin, 2026)
5. 82% of worldwide influencer spend goes to U.S.-based creators. (Source: Sociallyin, 2025)
6. The creator economy is worth $250 billion and is expected to reach $470 billion by 2027. (Source: Goldman Sachs via Creative Salon, 2025)
7. The fashion influencer marketing market alone is valued at $6.82 billion, projected to reach $39.72 billion by 2030. (Source: Grand View Research, 2024)
The growth rate is remarkable. No other marketing channel expanded 19x in under a decade. And the data shows no signs of slowing down.
ROI and Effectiveness
8. Businesses earn an average of $5.78 for every $1 spent on influencer marketing. (Source: Sociallyin, 2025)
9. Top-performing influencer programs yield up to $18.00 per $1 invested. (Source: Sociallyin, 2025)
10. The top 13% of businesses achieve an ROI of $20 or more per $1 spent. (Source: The Social Shepherd, 2025)
11. Influencer marketing generates 11x higher ROI than traditional banner ads. (Source: The Social Shepherd, 2025)
12. 89% of marketers rate creator campaigns as more effective than other marketing channels. (Source: Sociallyin, 2025)
13. 82% of marketers report acquiring higher-quality leads from influencer marketing. (Source: Sociallyin, 2025)
14. 18% of businesses fail to generate any revenue from influencer marketing. (Source: The Social Shepherd, 2025)
15. Influencer whitelisting outperforms basic social ads by 20-50%. (Source: Sociallyin, 2025)
Stat 14 is worth noting. Nearly 1 in 5 businesses see zero return. The difference between success and failure often comes down to influencer selection and fraud detection. More on that below.
Your SEO team. $99 per month. 30 optimized articles, published automatically. Blog SEO, Local SEO, and Social on autopilot. Start for $1 →
Platform Breakdown
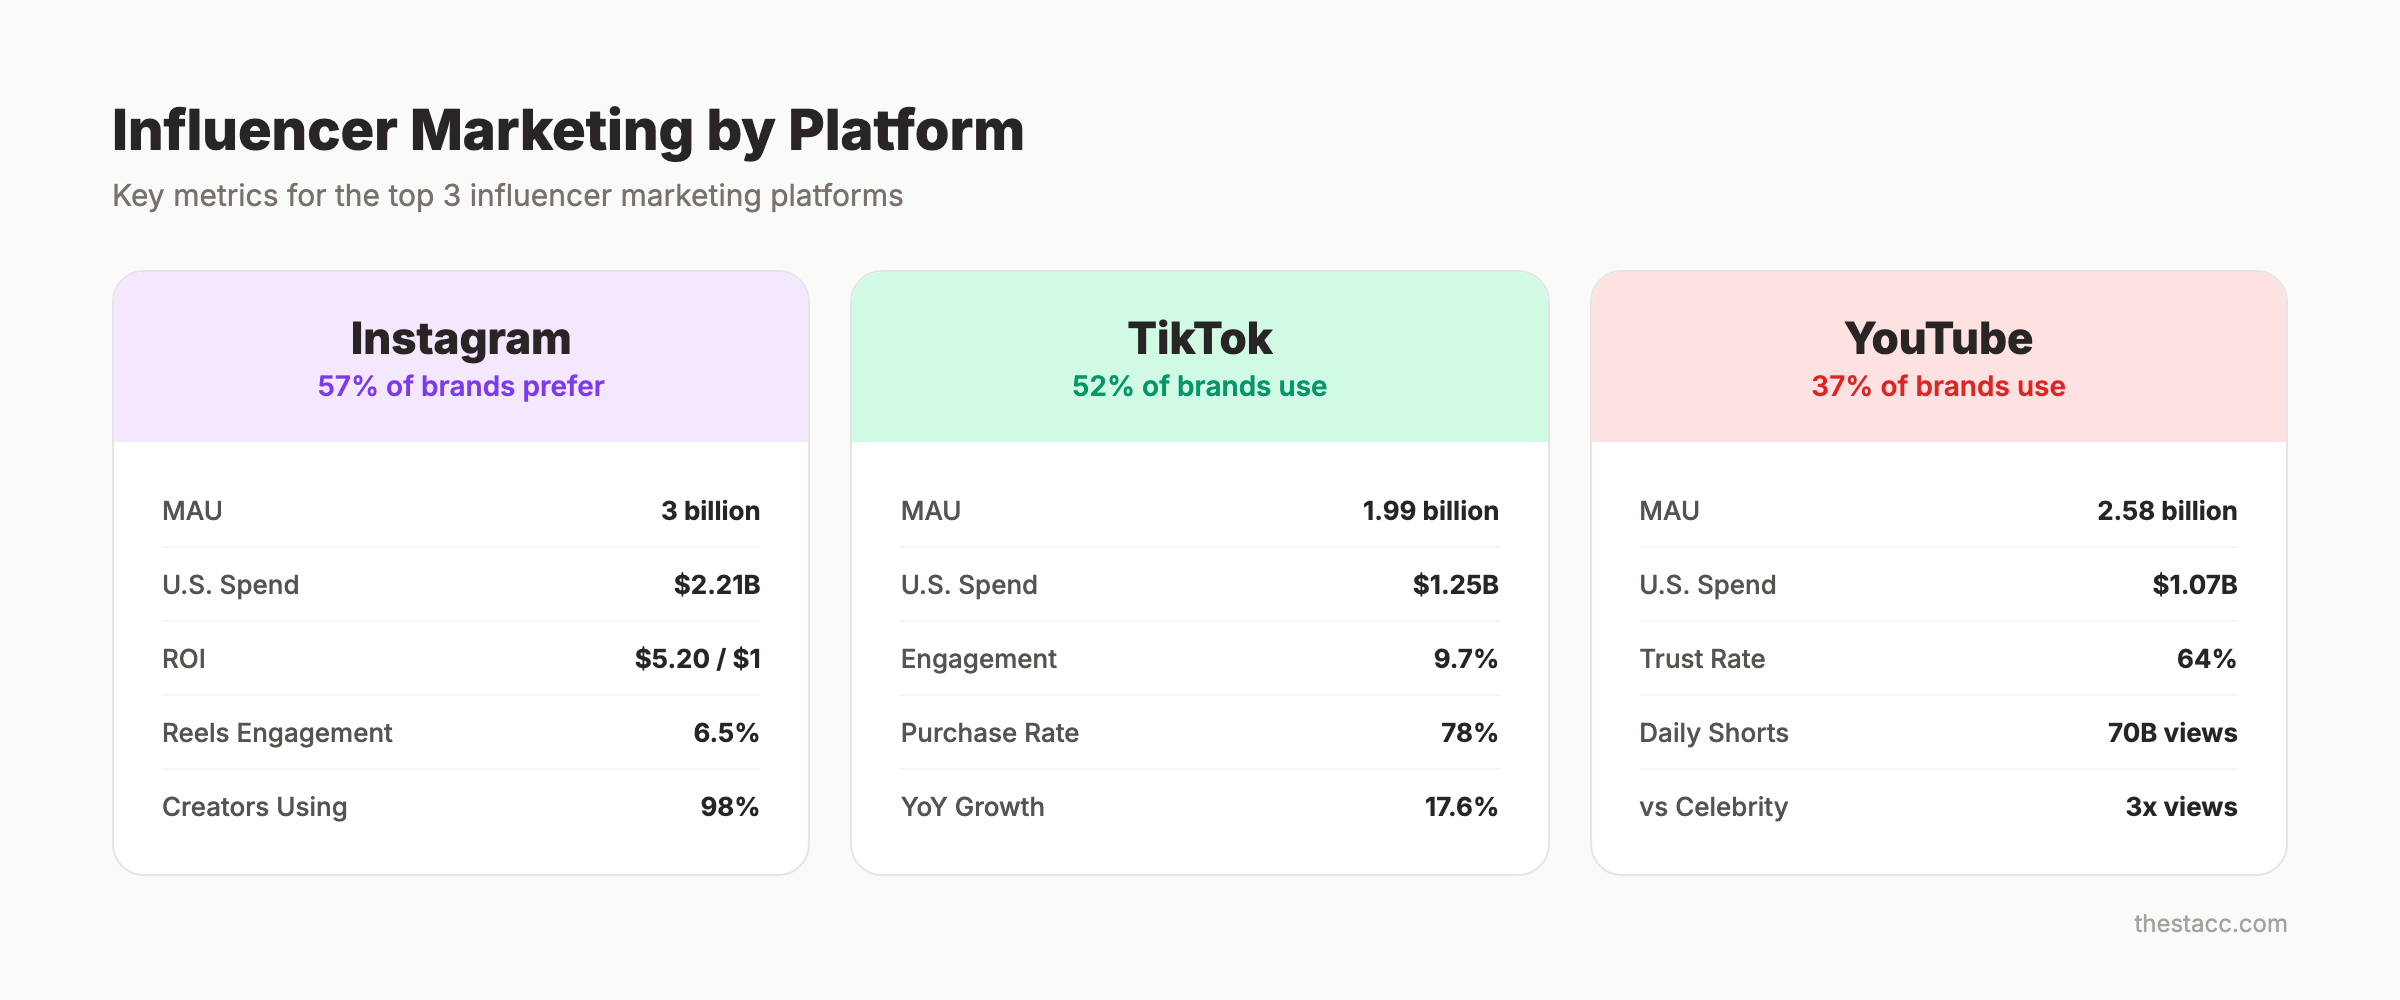
16. 57% of brands prefer Instagram for influencer campaigns. (Source: Influencer Marketing Hub, 2025)
17. Instagram has 3 billion monthly active users. 98% of U.S. influencers publish sponsored content there. (Source: Sociallyin, 2025)
18. Instagram captured $2.21 billion in U.S. influencer spending in 2024. (Source: Sociallyin, 2024)
19. Instagram Reels achieve 6.5% engagement for accounts with 100K-500K followers. (Source: Sociallyin, 2025)
20. Instagram-specific influencer campaigns return $5.20 per dollar spent. (Source: Sociallyin, 2025)
TikTok
21. TikTok has 1.99 billion monthly active users with 17.6% year-over-year growth. (Source: Sociallyin, 2025)
22. TikTok average engagement rate is 9.7% for mid-tier accounts. (Source: Sociallyin, 2025)
23. U.S. creators with fewer than 15K followers see up to 18% engagement on TikTok. (Source: Sociallyin, 2025)
24. TikTok captured $1.25 billion in U.S. influencer spending in 2024. (Source: Sociallyin, 2024)
25. 78% of TikTok users have purchased products via influencer content. (Source: The Social Shepherd, 2025)
26. 31% of respondents included TikTok in their 2026 influencer investment plans. It is the most frequently selected platform for new investment. (Source: Influencer Marketing Hub, 2026)
YouTube
27. YouTube has 2.58 billion monthly active users and 70 billion daily Shorts views. (Source: Sociallyin, 2025)
28. YouTube captured $1.07 billion in U.S. influencer spending in 2024. (Source: Sociallyin, 2024)
29. 64% of consumers trust YouTube creators for product recommendations. (Source: Sociallyin, 2025)
30. YouTube influencer videos generate 3x more views, 2x more actions, and 12x more comments compared to celebrity videos. (Source: The Social Shepherd, 2025)
Influencer Tiers: Nano, Micro, Macro, Mega
31. Nano-influencers (1K-10K followers) represent 75.9% of Instagram’s influencer base and 87.68% of TikTok’s. (Source: Aspire, 2025)
32. 73% of brands prefer to work with micro and mid-tier creators over celebrities. (Source: Sprout Social, 2025)
33. Micro-influencers on Instagram achieve 3.86% engagement rate. Mega-influencers generate only 1.21%. (Source: DemandSage, 2025)
34. Instagram nano-influencers achieve 6.23% engagement rate vs. 2.39% platform average. (Source: Sociallyin, 2025)
35. A single Instagram feed post from a micro-influencer costs an average of $185. Macro-influencers average $1,200 per post. (Source: Zebracat, 2025)
36. Micro-influencers make up 53% of all paid influencer collaborations in 2025. (Source: Sprout Social, 2025)
37. 40% of dedicated influencer marketing funds go specifically to micro-influencers. (Source: Sociallyin, 2025)
38. More than half of marketers primarily work with nano-influencers (27%) and micro-influencers (27%). (Source: Influencer Marketing Hub, 2025)
The pattern is clear across every data point. Smaller influencers drive higher engagement at lower cost. The economics favor micro over macro for most brands.
Brand Spending and Budgets
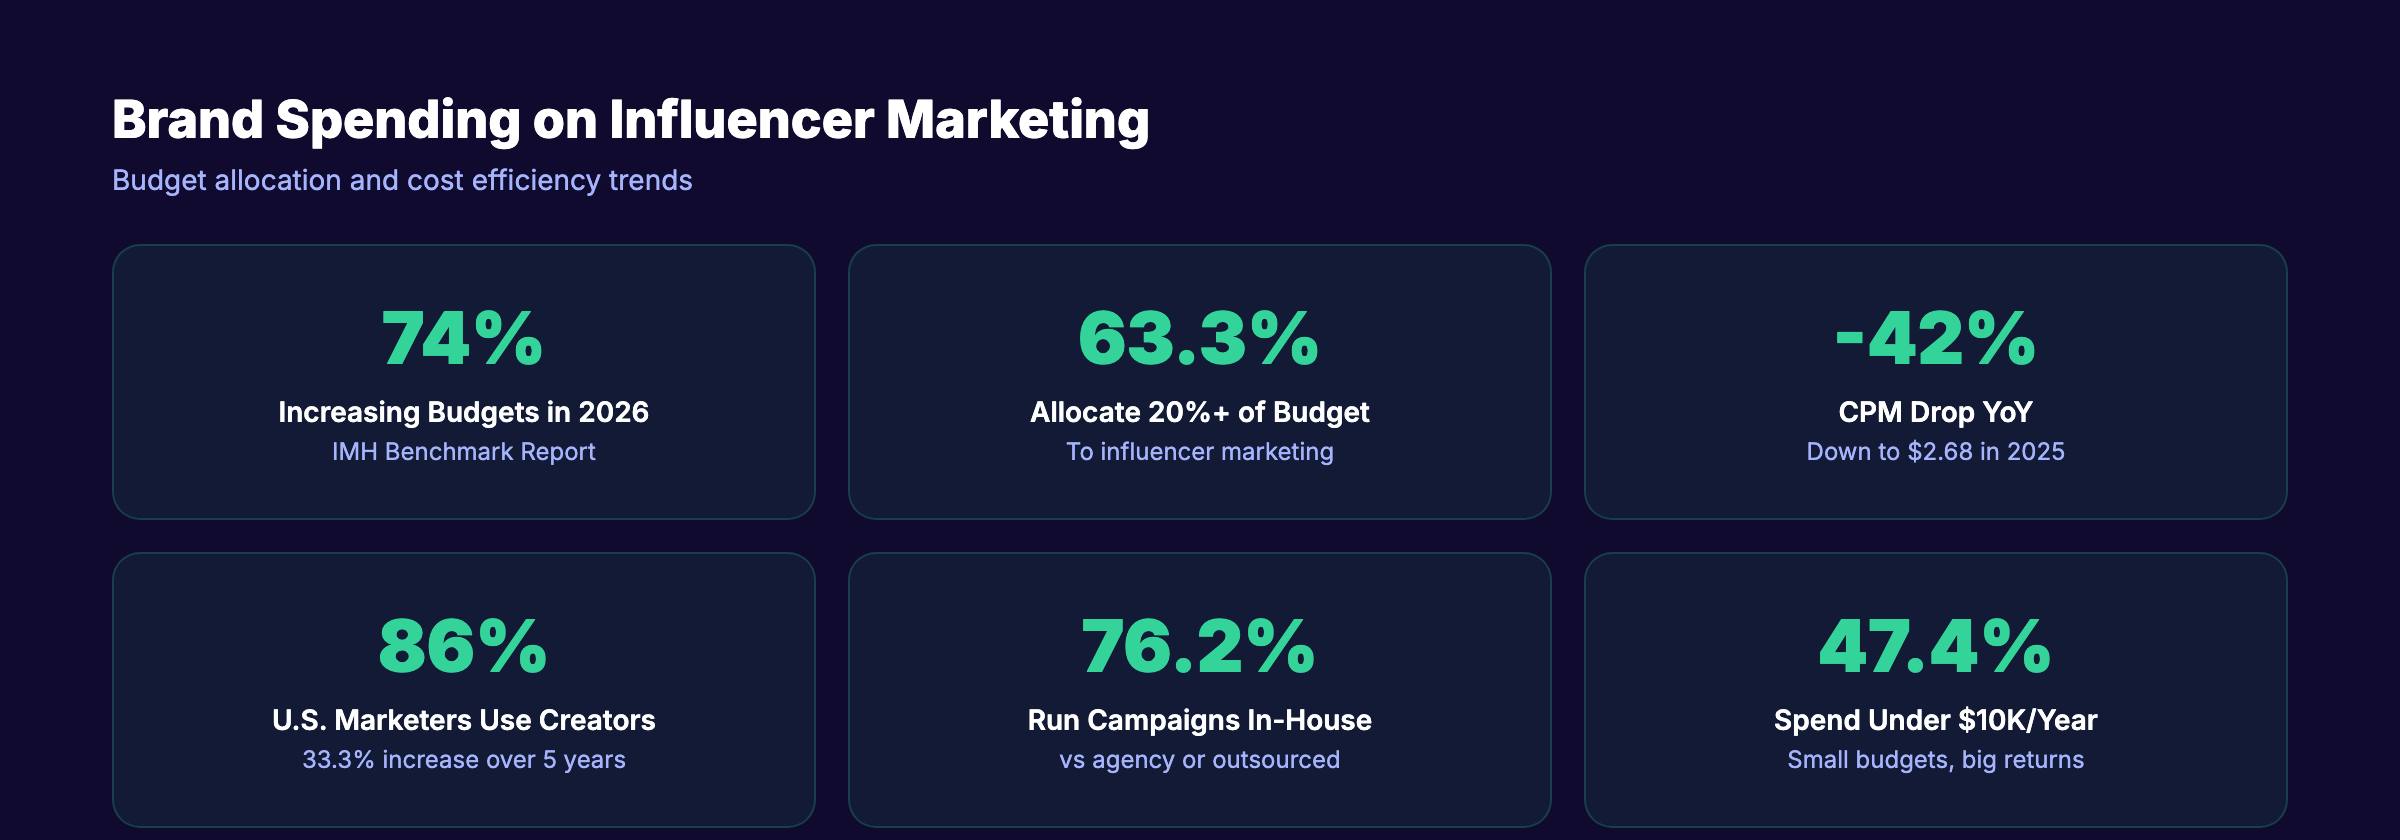
39. 74% of marketers plan to increase their influencer marketing budgets in 2026. (Source: Influencer Marketing Hub, 2026)
40. 80% of brands either maintained or increased their influencer budgets in 2025. 47% raised budgets by 11% or more. (Source: PR Newswire, 2025)
41. 63.3% of marketers allocate 20% or more of their total marketing budget to influencer marketing. (Source: Sociallyin, 2025)
42. Nearly half (47.4%) of businesses spend less than $10,000 on influencer marketing annually. (Source: Oberlo, 2025)
43. 86% of U.S. marketers used creator partnerships in 2025. That is a 33.3% increase in adoption over 5 years. (Source: Sociallyin, 2025)
44. CPM decreased 42% year-over-year to $2.68 in 2025. (Source: Sociallyin, 2025)
45. 76.2% of influencer campaigns are now run in-house. 57.5% use a third-party platform. (Source: Influencer Marketing Hub, 2025)
The CPM drop (stat 44) is significant. Influencer content is getting cheaper per impression at the same time that budgets are growing. The cost efficiency of the channel keeps improving.
Stop writing. Start ranking. Stacc publishes 30 SEO articles per month for $99. Blog and social media content on autopilot. Start for $1 →
Consumer Trust and Purchase Behavior
46. 69% of consumers trust influencer product recommendations. (Source: The Social Shepherd, 2025)
47. 92% of consumers trust Instagram influencers vs. 38% who trust branded advertisements. (Source: Sociallyin, 2025)
48. 76% of social media users intend to purchase from social media posts. (Source: Sociallyin, 2025)
49. 40% of consumers buy immediately after creator engagement. (Source: Sociallyin, 2025)
50. 33% of Gen Z and 29% of millennials bought from influencer-founded brands in the past year. (Source: Sociallyin, 2025)
51. 64% of consumers do not trust influencers who fail to disclose brand relationships. (Source: BBB Programs, 2025)
52. 42% of global internet users use ad-blocking software. (Source: Sociallyin, 2025) Ad-blocking drives brands toward influencer content because sponsored posts bypass ad blockers entirely. This alone explains a large portion of the budget shift.
Content Performance
53. 69% of marketers report influencer-generated content outperforms brand-created content. (Source: Sociallyin, 2025)
54. 77% of marketers repurpose creator content in paid campaigns. (Source: Sociallyin, 2025)
55. Reallocating budgets toward creators boosts engagement by 16.6%. (Source: Sociallyin, 2025)
56. 56% of brands reuse the same influencers across multiple campaigns. (Source: Sociallyin, 2025)
57. 59% of marketers use AI to scale creator discovery, workflows, and analytics. (Source: Influencer Marketing Hub, 2025)
Influencer Fraud and Challenges
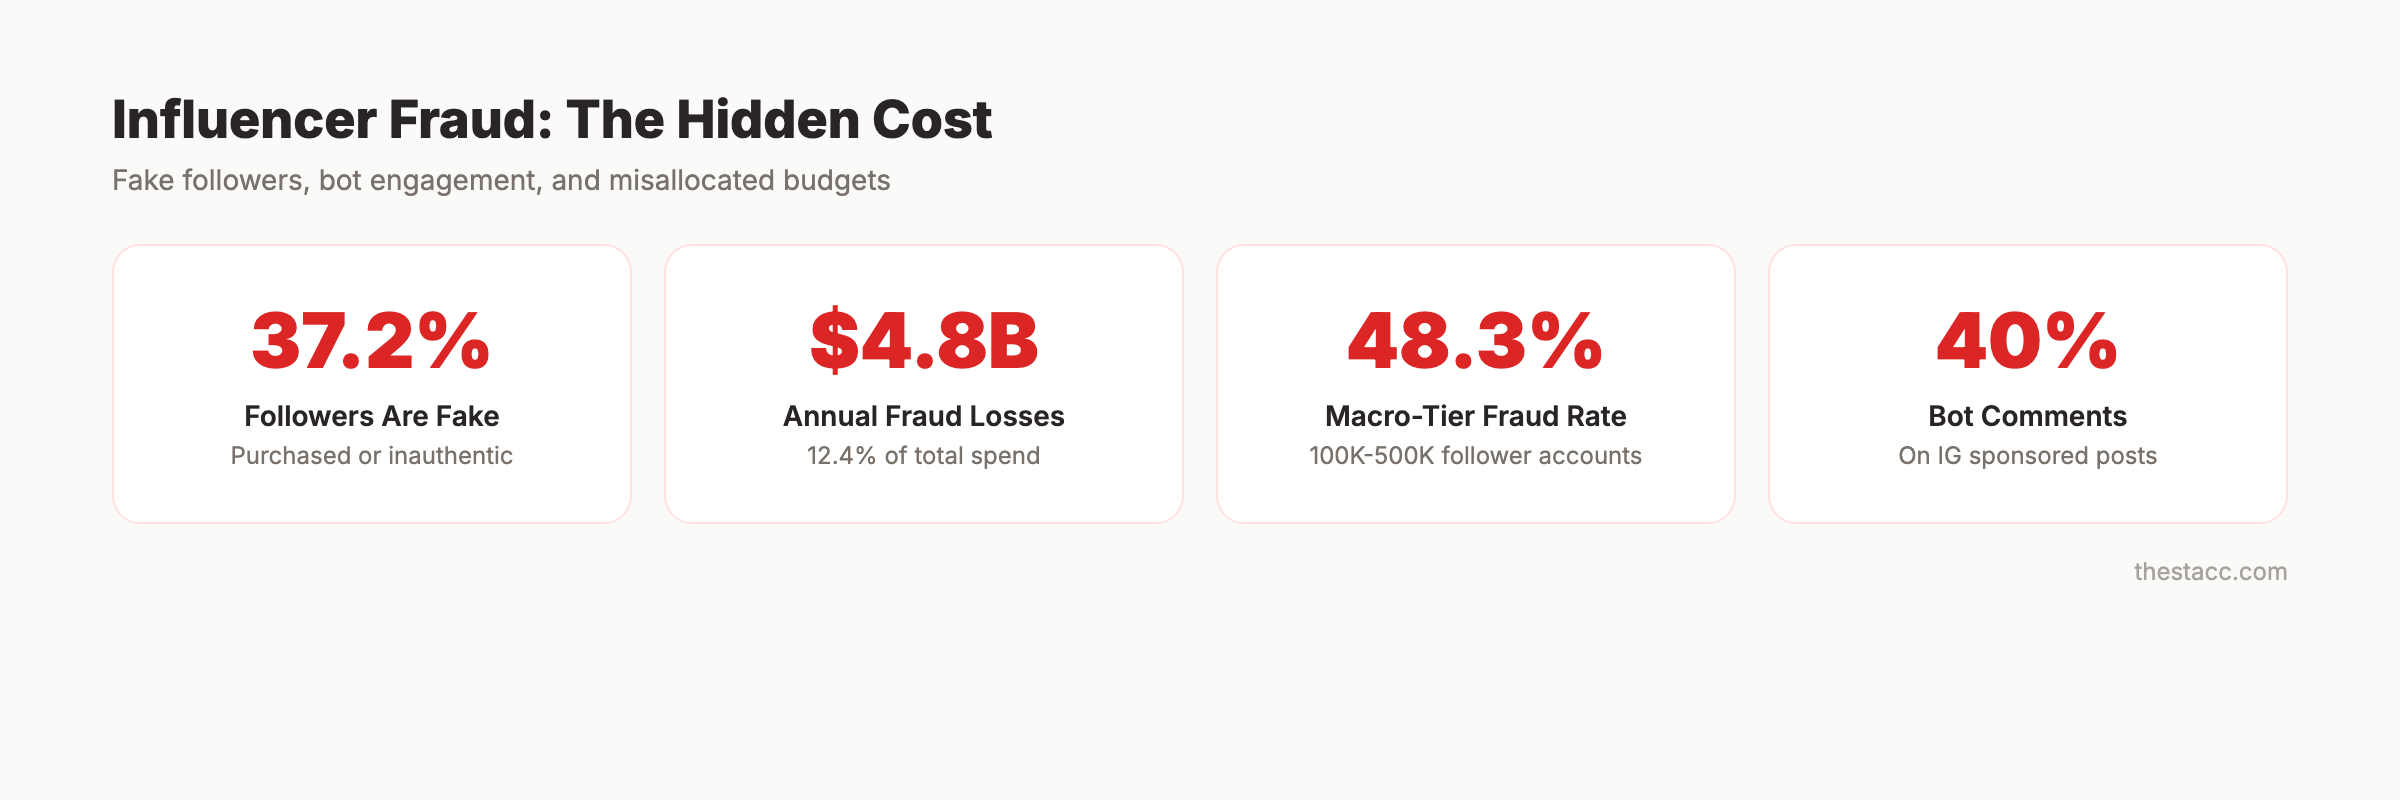
58. 37.2% of influencer followers show signs of being fake, purchased, or inauthentic. (Source: SociaVault, 2025)
59. Fraud-related losses consume 12.4% of total influencer marketing spend. That equals $4.8 billion in annual misallocated budget. (Source: Amra & Elma, 2025)
60. Macro-tier accounts (100K-500K followers) have the highest fraud rate at 48.3%. (Source: Amra & Elma, 2025)
61. Approximately 40% of Instagram comments on sponsored posts come from bots. (Source: Amra & Elma, 2025)
62. 53% of marketers struggle to determine exact influencer marketing ROI. (Source: Sociallyin, 2025)
63. 48% of consumers do not trust or act on influencer content. (Source: Sociallyin, 2025)
The fraud numbers demand attention. Nearly half of macro-influencer followers are fake. This is why micro-influencer campaigns often outperform. Smaller accounts have more authentic audiences and less incentive to inflate numbers.
B2B Influencer Marketing
64. B2B influencer marketing programs deliver an average ROI of 520% ($5.20 per $1 invested). (Source: GTM 80/20, 2025)
65. 75% of B2B companies now use influencer marketing. (Source: GTM 80/20, 2025)
66. 87% of B2B buyers place greater trust in industry experts than brand messaging. (Source: GTM 80/20, 2025)
67. LinkedIn audiences exposed to brand messages are 6x more likely to convert than on other channels. (Source: GTM 80/20, 2025)
B2B influencer marketing is the most overlooked segment. The ROI rivals B2C, and the competition for attention is significantly lower. For B2B brands investing in content marketing, pairing blog SEO with LinkedIn influencer partnerships compounds both channels.
3,500+ blogs published. 92% average SEO score. See what Stacc can do for your site. Content SEO on autopilot. Start for $1 →
Predictions and Forecasts
68. The influencer marketing market is projected to reach $152.56 billion by 2031 (CAGR 30.36%). (Source: Mordor Intelligence, 2026)
69. The influencer marketing platform market is expected to reach $97.55 billion by 2030 (CAGR 23.3%). (Source: Grand View Research, 2025)
70. The virtual influencer market is projected to hit $45.88 billion by 2030 (40.8% CAGR). (Source: HireInfluence, 2025)
71. Nano-influencer cohorts will post the highest growth through 2030 at 36% CAGR. (Source: HireInfluence, 2025)
72. Asia-Pacific is set to record the highest regional CAGR at 33.90% during 2026-2031. (Source: Mordor Intelligence, 2026)
Key Takeaways
- $5.78 average ROI per $1 spent. Influencer marketing outperforms banner ads by 11x.
- Micro-influencers dominate. 53% of all paid collaborations. 3.86% engagement vs. 1.21% for mega-influencers.
- 37.2% of followers are fake. Macro-tier fraud reaches 48.3%. Vet influencers before spending.
- TikTok is the growth platform. 78% of users purchase via influencer content. Highest new investment intent.
- 74% of marketers plan to increase budgets in 2026. The channel is growing, not stabilizing.
- B2B is underexplored. 520% ROI with 75% adoption. Most B2B brands are still early.
- $152.56 billion projected by 2031. Nearly 5x current market size in 6 years.
Methodology
Sources: Influencer Marketing Hub, Sociallyin, The Social Shepherd, Mordor Intelligence, Grand View Research, Sprout Social, DemandSage, Aspire, GTM 80/20, Amra & Elma, SociaVault, BBB Programs, Oberlo, Zebracat, HireInfluence, Goldman Sachs, PR Newswire.
Last updated: March 2026
We update this page quarterly. If a stat changes after publication, we note the updated date.
FAQ
What is the average ROI of influencer marketing?
Businesses earn an average of $5.78 for every $1 spent on influencer marketing. Top-performing programs yield up to $18 per $1. The top 13% of businesses see $20+ returns per dollar invested.
How big is the influencer marketing industry in 2026?
The global influencer marketing industry is estimated at $40.51 billion in 2026, up from $32.55 billion in 2025. The market is projected to reach $152.56 billion by 2031.
Which platform is best for influencer marketing?
Instagram remains the top choice with 57% of brands preferring it. TikTok is growing fastest with 78% of users purchasing through influencer content. YouTube offers the highest trust, with 64% of consumers trusting creator recommendations.
Are micro-influencers more effective than celebrities?
The data strongly suggests yes. Micro-influencers achieve 3.86% engagement on Instagram vs. 1.21% for mega-influencers. They cost $185 per post vs. $1,200+ for macro-influencers. And 73% of brands prefer working with micro and mid-tier creators over celebrities.
How much do brands spend on influencer marketing?
Nearly half (47.4%) of businesses spend less than $10,000 annually. But 63.3% of marketers allocate 20% or more of their total marketing budget to influencer campaigns. U.S. total influencer spending is projected at $12.17 billion in 2026.
What percentage of influencer followers are fake?
37.2% of influencer followers show signs of being fake or purchased. The problem is worst among macro-tier accounts (100K-500K followers) where the fraud rate reaches 48.3%. Brands lose an estimated $4.8 billion annually to influencer fraud.
Influencer marketing is no longer experimental. It is a $40 billion channel with measurable ROI and growing budgets. The brands winning are those that prioritize micro-influencers, verify audience authenticity, and treat influencer content as a complement to their organic search strategy. The data makes the case. The execution is what separates the 82% who see results from the 18% who do not.
Written and published by Stacc. We publish 3,500+ articles per month across 70+ industries. All data verified against public sources as of March 2026.
