SEO Budget: The Complete Planning Guide (2026)
Plan your SEO budget with real allocation benchmarks by business size. Covers spending tiers, category breakdowns, and quarterly phasing. Updated for 2026.
Most businesses either overspend on SEO with nothing to show for it or underspend and wonder why organic traffic stays flat. A 2025 survey of 439 SEO professionals found that 63% of companies spend between $500 and $5,000 per month on SEO. But spending within that range does not mean the money is well allocated.
The problem is not the amount. It is the plan behind it.
We have published 3,500+ articles across 70+ industries and tracked how businesses at every budget level allocate their SEO spend. The ones that get results share one thing in common: they treat their SEO budget as a strategic allocation, not a monthly expense.
This guide gives you the framework to do the same.
Here is what you will learn:
- How to determine the right SEO budget for your business size and goals
- The 5-category breakdown that shows where every dollar should go
- A 7-step process for setting your budget from scratch
- Quarter-by-quarter phasing so your spend matches your SEO maturity
- The 8 most common budget mistakes (and how to avoid each one)
- How to measure ROI and know when to increase or cut spending
What Is an SEO Budget and Why It Matters
An SEO budget is the total amount your business allocates to organic search activities over a defined period. It covers content creation, technical optimization, link building, tools, and the people who execute the work.
Most businesses skip this step. They pick a number that “feels right” or accept whatever an agency quotes them. That approach fails for one reason: SEO is not a single service. It is a collection of activities that require different levels of investment at different stages.
Without a structured budget, three things happen:
- Overspending on content, underspending on links. You publish 30 articles per month but none rank because there is no link authority behind them.
- Tool bloat. Companies spend 19% of their marketing budget on technology, but only 56% of purchased tools get used, according to the 2024 CMO Survey.
- No measurement framework. Without allocated amounts per category, you cannot measure what is working and what is wasting money.
A well-planned SEO budget solves all three. It turns a vague “we spend $3,000 per month on SEO” into a clear allocation with measurable outcomes per dollar.
The SEO cost guide covers what SEO services typically cost. This guide covers how to plan the spend.
How Much Should You Spend on SEO in 2026
The short answer: 5-10% of gross revenue on total marketing, with 25-50% of that marketing budget going to SEO.
The longer answer depends on 4 factors.
Factor 1: Your Revenue and Growth Stage
| Annual Revenue | Recommended SEO Budget | Monthly Range |
|---|---|---|
| Under $500K | 8-10% of revenue to marketing, 30-40% to SEO | $100-$400 |
| $500K-$2M | 7-9% of revenue to marketing, 25-35% to SEO | $400-$1,500 |
| $2M-$10M | 6-8% of revenue to marketing, 25-40% to SEO | $1,500-$5,000 |
| $10M-$50M | 5-7% of revenue to marketing, 20-35% to SEO | $5,000-$15,000 |
| $50M+ | 4-6% of revenue to marketing, 15-30% to SEO | $15,000-$50,000+ |
These ranges come from a combination of Gartner CMO Spend Survey benchmarks and data from Ahrefs’ SEO pricing study.
Companies in growth mode should lean toward the higher end. Established companies with strong existing rankings can spend less to maintain and slowly expand.
Factor 2: Your Industry Competition
A local plumber in a small city needs a different budget than a SaaS company targeting “project management software.” The more competitive your target keywords, the higher your required investment in content depth and link building.
Use this as a rough guide:
| Competition Level | Example | Monthly Budget Multiplier |
|---|---|---|
| Low | Local service in small market | 1x (baseline) |
| Medium | Regional business, niche B2B | 1.5-2x |
| High | National brand, competitive SaaS | 3-5x |
| Very High | Finance, insurance, legal (national) | 5-10x |
If your baseline budget is $1,000 per month and you are targeting high-competition keywords, plan for $3,000-$5,000 per month to see meaningful results within the typical 6-12 month timeline.
Factor 3: Your Current SEO Maturity
A brand-new website needs a larger upfront investment in technical SEO and foundational content. A site with 200 existing pages and a Domain Authority of 40+ needs less foundational work and can allocate more toward link building and content scaling.
Run a full SEO audit before setting your budget. The audit reveals where the gaps are and helps you allocate spending to the areas with the highest impact.
Factor 4: Your Goals and Timeline
“Rank for 50 keywords in 6 months” requires a very different budget than “maintain current rankings and slowly expand into 3 new topic clusters.”
Map your goals to budget tiers:
- Maintenance: Keep current rankings, fix technical issues, publish 4-8 posts per month. Budget: $500-$2,000 per month.
- Growth: Expand into new keyword clusters, build links, increase publishing to 15-30 posts per month. Budget: $2,000-$7,500 per month.
- Aggressive growth: Dominate a category, outproduce competitors, active link building and digital PR. Budget: $7,500-$20,000+ per month.
Your SEO team. $99 per month. Stacc publishes 30 optimized articles per month on autopilot. No agency, no freelancers, no content calendar to manage. Start for $1 →
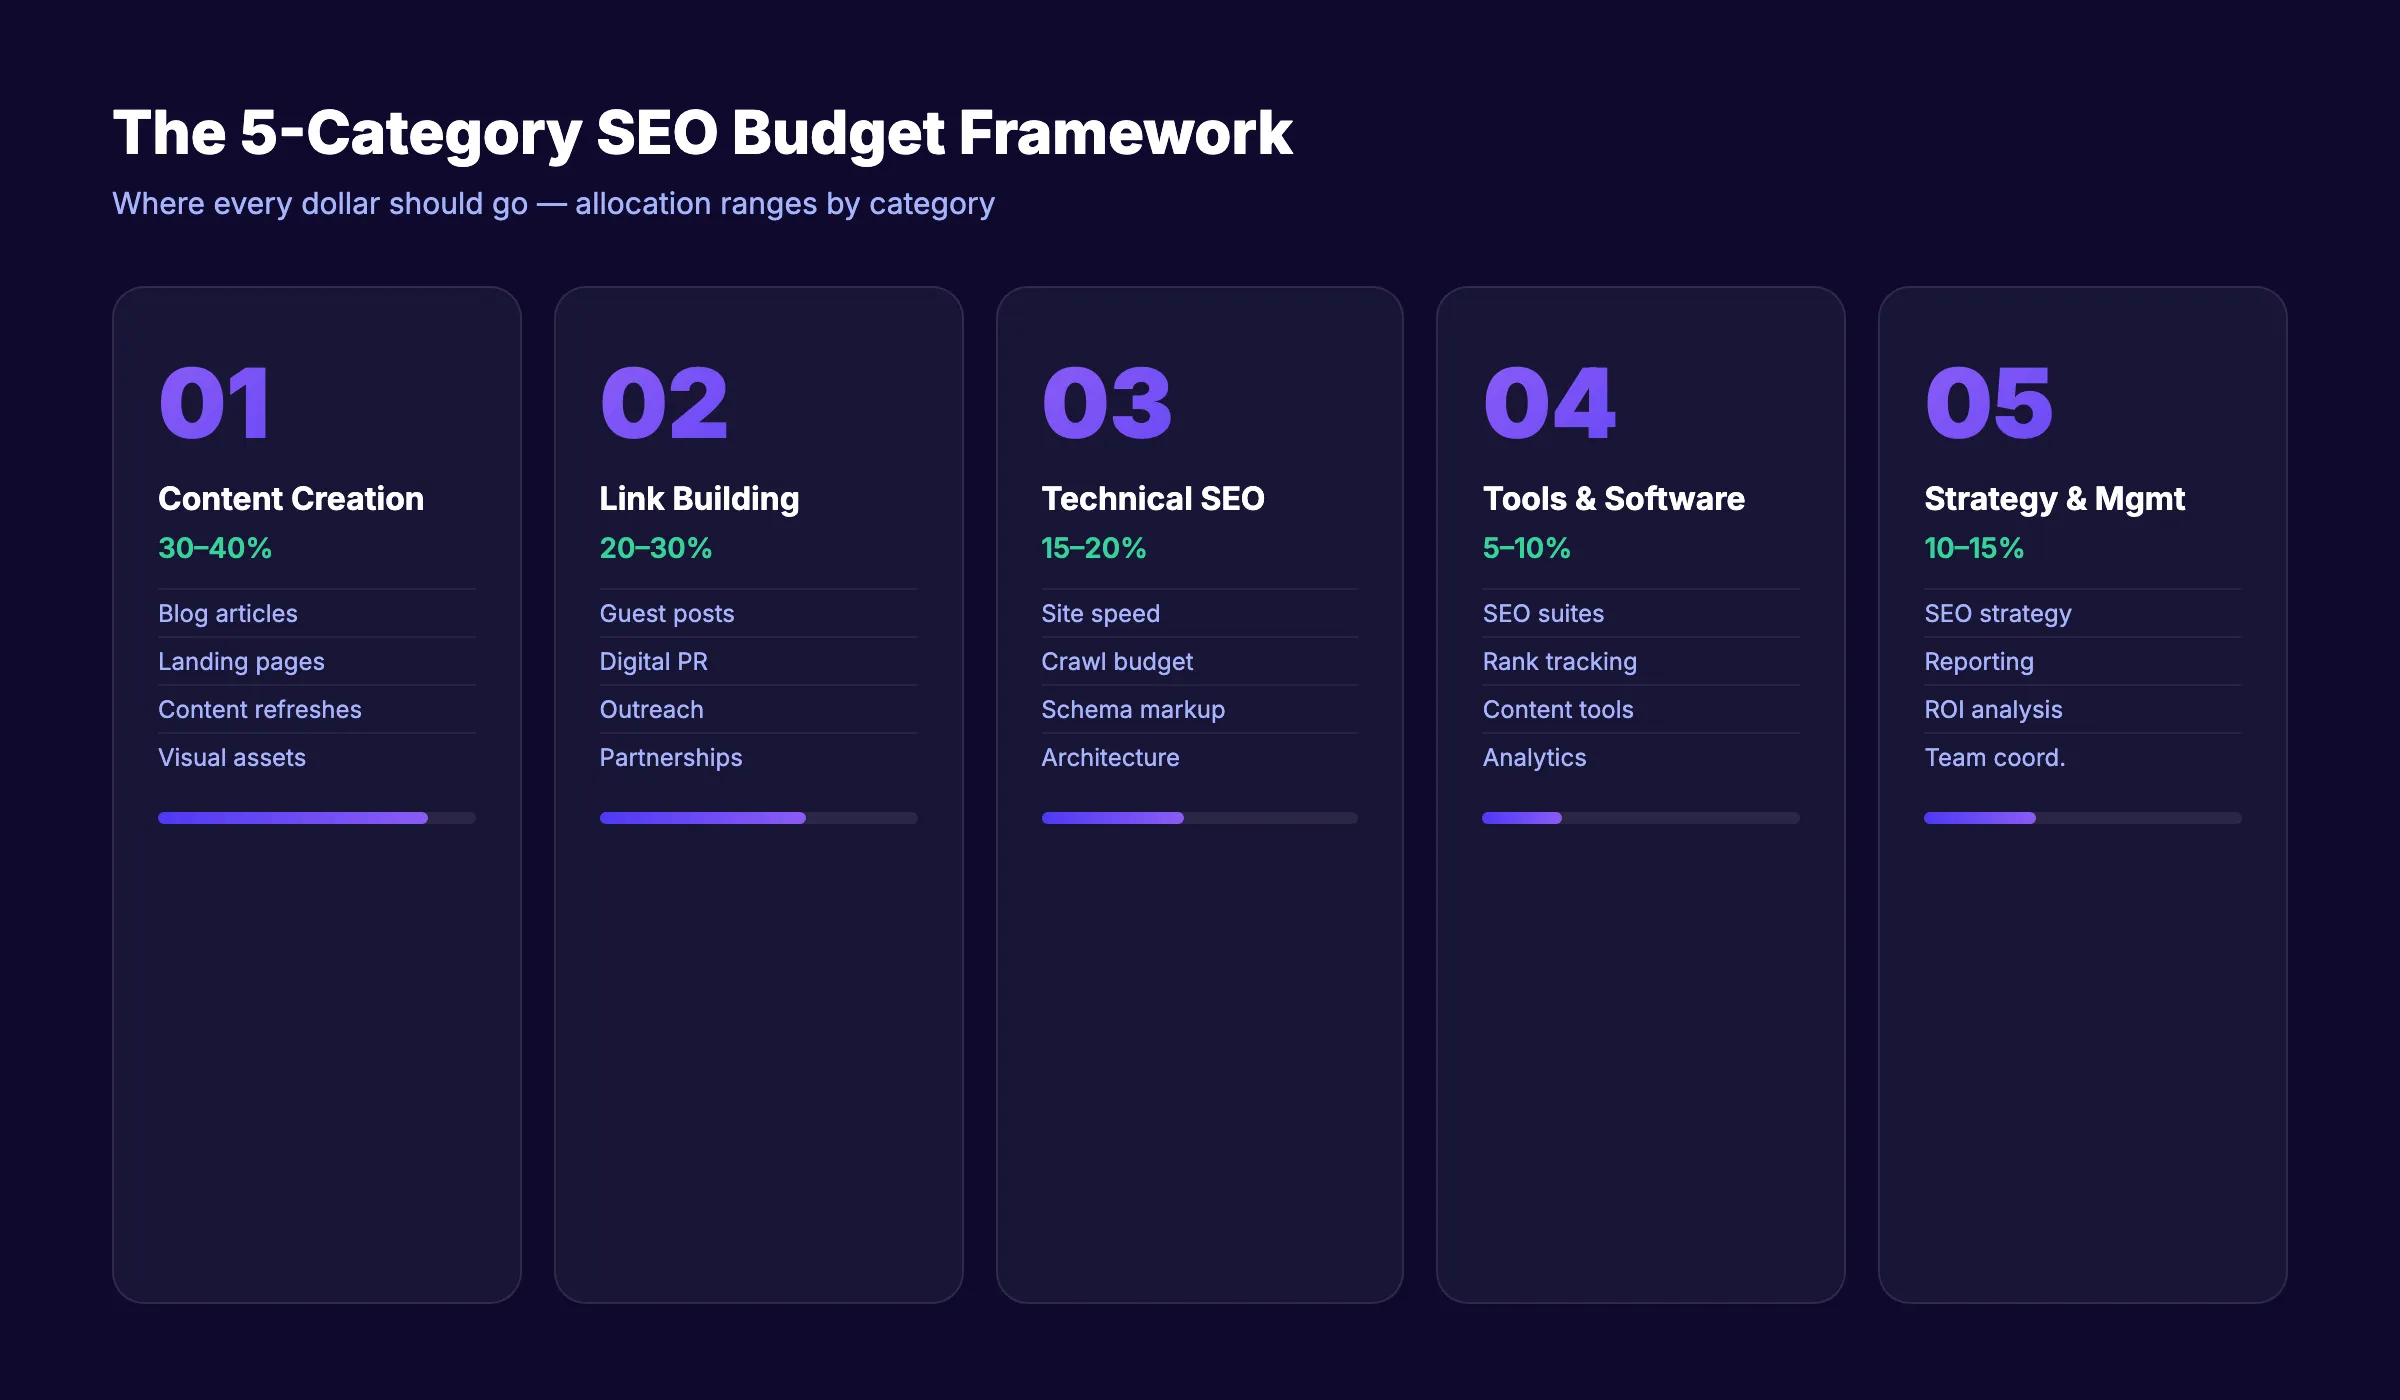
The 5-Category SEO Budget Breakdown
Every SEO dollar falls into one of 5 categories. The percentages shift based on your maturity and goals, but the categories stay the same.
Category 1: Content Creation (30-40%)
Content is the largest budget line for most SEO programs. This includes blog posts, landing pages, product pages, and any written asset designed to rank.
What this covers:
- Blog articles (the core of most SEO strategies)
- Landing page copy
- Content briefs and outlines
- Content updates and refreshes
- Visual assets (images, infographics, charts)
Cost benchmarks:
- Freelance writer: $80-$250 per article
- Content agency: $200-$500 per article
- In-house writer salary: $45,000-$75,000 per year
- AI-assisted services like Stacc: $99 per month for 30 articles
The math favors volume. Businesses that publish 16+ posts per month get 3.5x more traffic than those publishing 0-4 posts. But the cost of producing 16+ quality articles per month through traditional methods ranges from $1,280 to $8,000 per month using freelancers alone.
This is where content automation changes the budget equation. Instead of spending 40% of your budget on writers, you can reallocate that spend to link building and technical improvements.
Category 2: Link Building and Digital PR (20-30%)
Links remain one of the strongest ranking factors. This category covers everything related to earning and building backlinks.
What this covers:
- Guest posting outreach and placement
- Digital PR campaigns
- Resource page link building
- Broken link building
- HARO and journalist outreach
- Sponsorships and partnerships
Cost benchmarks:
- Per-link cost (agency): $200-$1,500 per link
- Digital PR campaign: $2,000-$10,000 per campaign
- Link building tools: $100-$400 per month
- In-house outreach specialist salary: $40,000-$65,000 per year
New sites should allocate closer to 30%. Building backlinks early establishes the domain authority that makes all future content rank faster.
Category 3: Technical SEO (15-20%)
Technical SEO ensures search engines can crawl, index, and render your site properly. This category often gets underfunded because the work is invisible to non-technical stakeholders.
What this covers:
- Site speed and Core Web Vitals optimization
- Crawl budget management
- Schema markup implementation
- Mobile optimization
- Site architecture and internal linking
- Security (HTTPS, headers)
- XML sitemap management
Cost benchmarks:
- Technical SEO audit: $1,000-$5,000 (one-time)
- Ongoing technical maintenance: $500-$2,000 per month
- Developer time for fixes: $75-$200 per hour
- Site migration: $5,000-$25,000 (one-time project)
Front-load this spending. Technical issues block everything else. A site with slow page speed and crawl errors will not rank regardless of how much content you produce.
Category 4: SEO Tools and Software (5-10%)
Tools power research, tracking, and reporting. This is the category most prone to bloat.
What this covers:
- Keyword research and rank tracking (Ahrefs, Semrush, Moz)
- Content optimization (Surfer, Clearscope, Frase)
- Technical crawling (Screaming Frog, Sitebulb)
- Analytics (Google Search Console, GA4)
- Reporting dashboards
Cost benchmarks per tool:
| Tool Category | Monthly Cost | Example Tools |
|---|---|---|
| All-in-one SEO suite | $99-$449 | Ahrefs, Semrush |
| Content optimization | $49-$199 | Surfer SEO, Clearscope |
| Technical crawling | $0-$209 | Screaming Frog, Sitebulb |
| Rank tracking | $49-$149 | AccuRanker, SE Ranking |
| Analytics | Free | GSC, GA4 |
Most businesses need 2-3 tools total. Check the best budget SEO tools and best free SEO tools before committing to expensive subscriptions. Many paid features overlap.
Category 5: Strategy, Reporting, and Management (10-15%)
Someone needs to plan the work, measure results, and adjust the strategy. This is the management layer.
What this covers:
- SEO strategy development
- Monthly and quarterly reporting
- Competitor monitoring
- ROI measurement
- Team coordination
- Training and education
Cost benchmarks:
- SEO consultant (hourly): $100-$300 per hour
- SEO manager salary: $55,000-$90,000 per year
- Agency management fee: typically bundled in retainer
This category shrinks as your SEO program matures and processes become repeatable.
3,500+ blogs published. 92% average SEO score. See what Stacc can do for your site. Content, optimization, and publishing handled automatically. Start for $1 →
How to Set Your SEO Budget in 7 Steps
Follow this process to build a budget from scratch. Each step builds on the previous one.
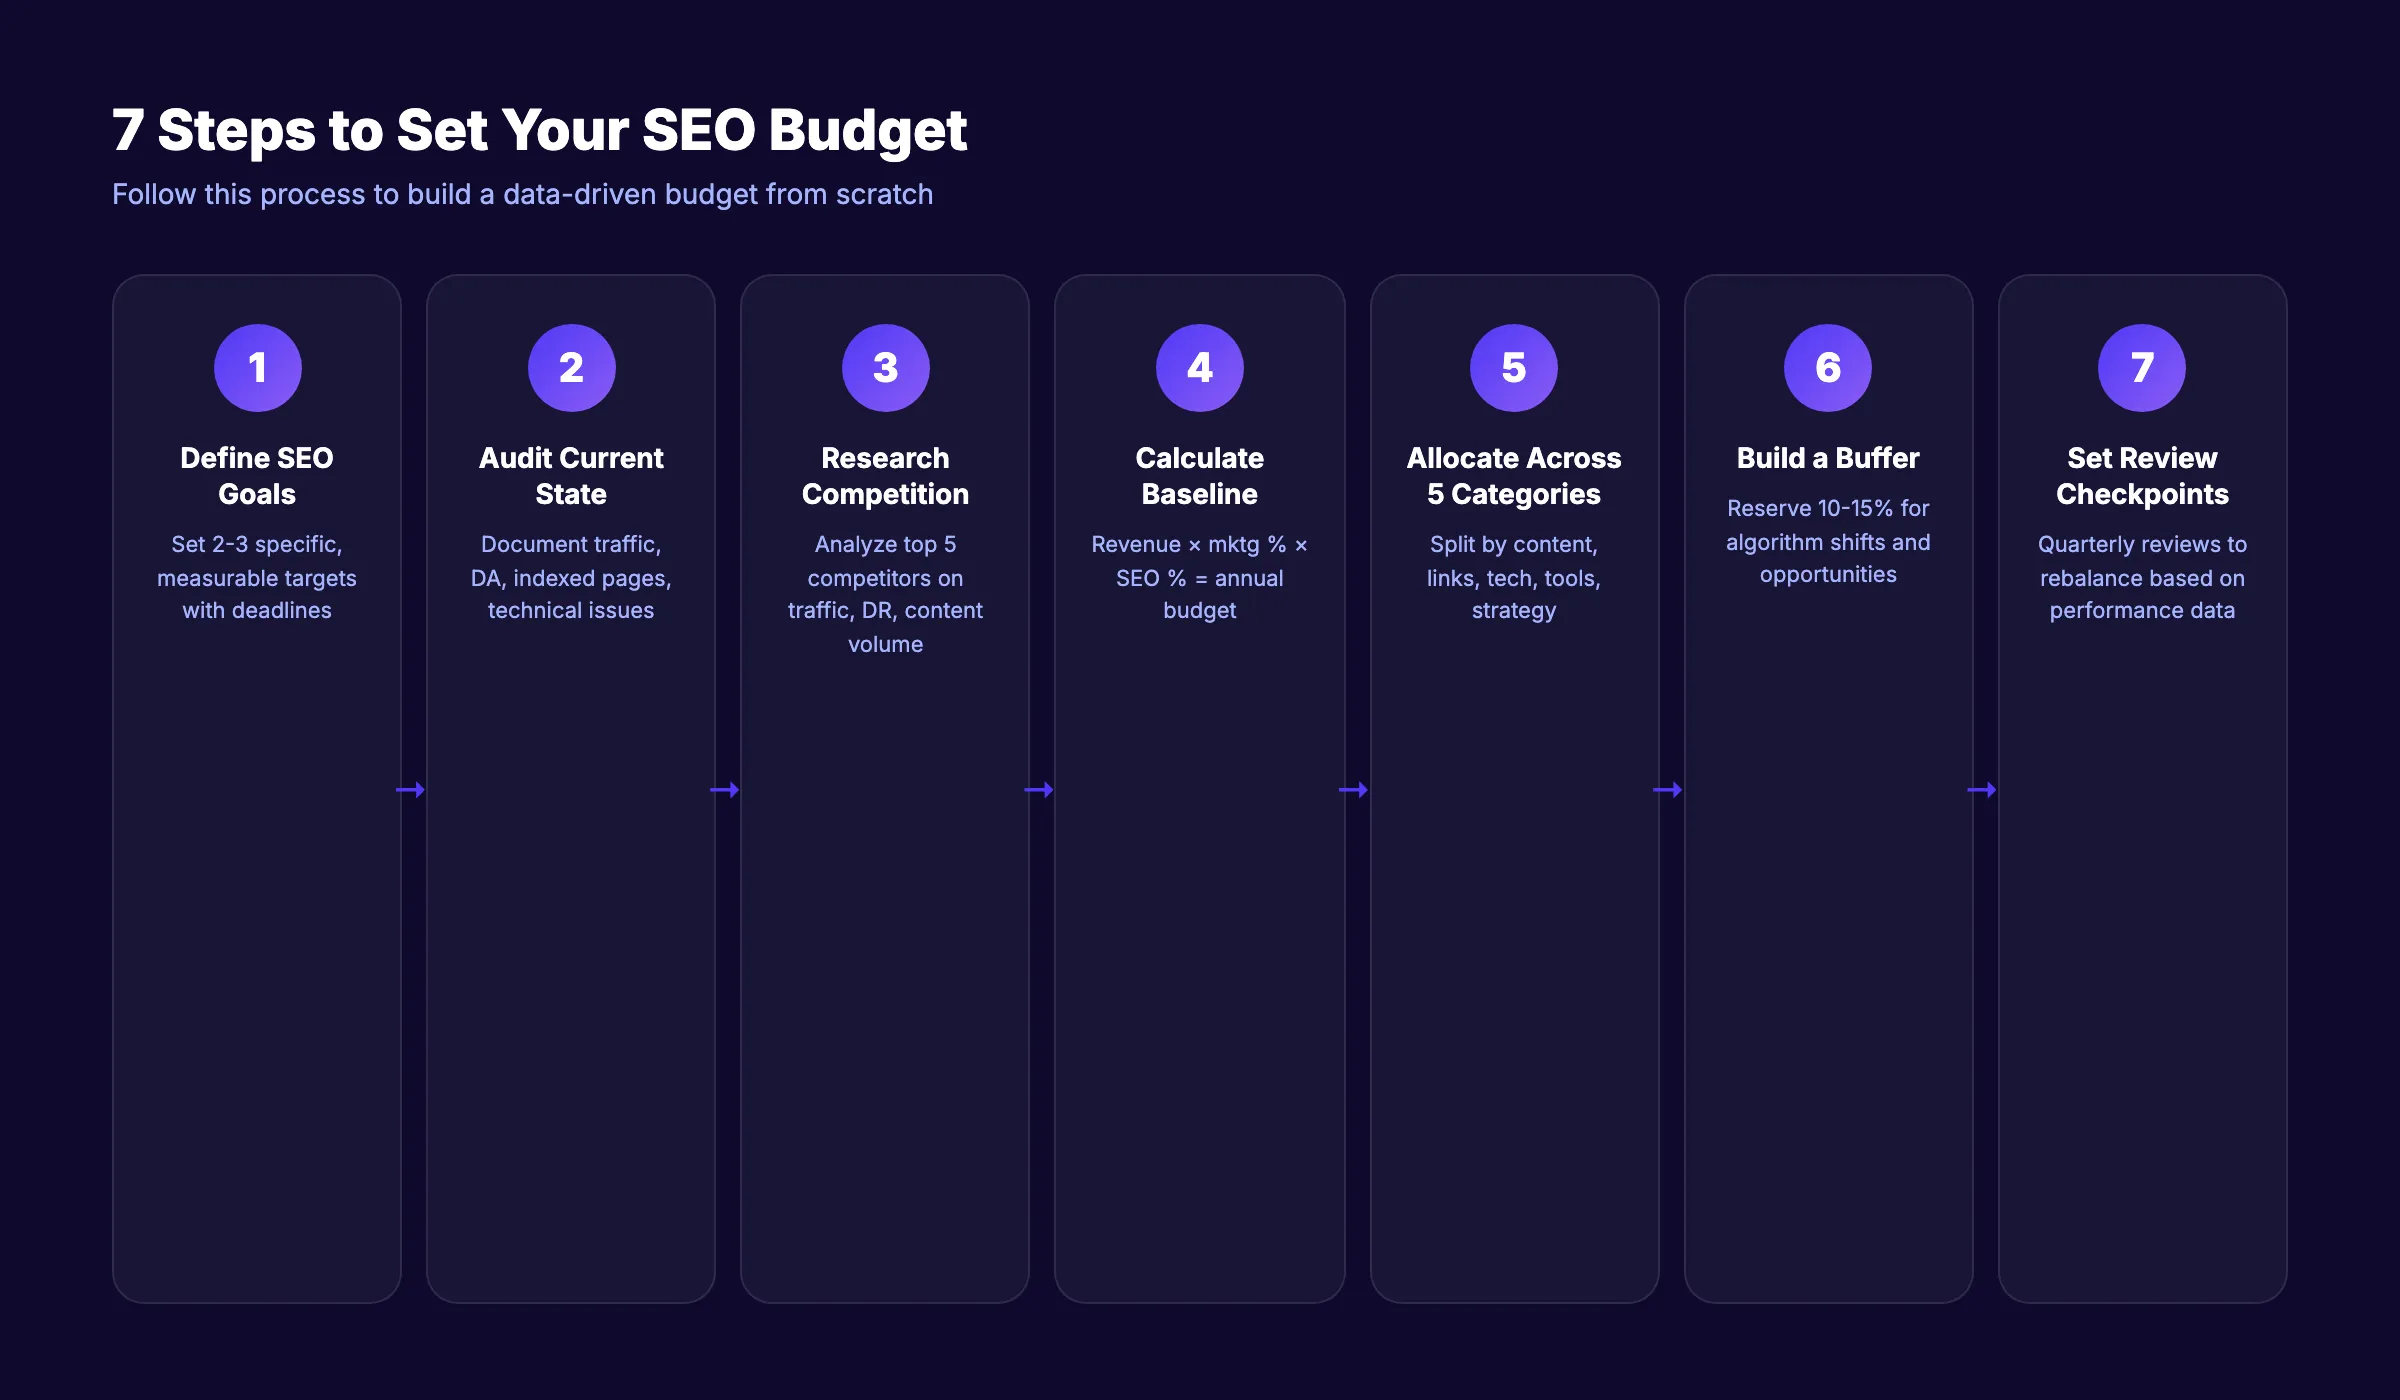
Step 1: Define Your SEO Goals
Start with what you want to achieve, not what you want to spend. Write down 2-3 specific goals with numbers and deadlines.
Strong goals:
- Increase organic traffic from 5,000 to 15,000 monthly sessions within 12 months
- Rank in the top 3 for 20 target keywords within 9 months
- Generate 100 organic leads per month within 6 months
Weak goals:
- “Improve our SEO”
- “Rank higher on Google”
- “Get more traffic”
Specific goals let you reverse-engineer the budget. Vague goals lead to vague spending.
Step 2: Audit Your Current State
You cannot plan a route without knowing your starting point. Run a technical SEO audit and document:
- Current organic traffic and trend (up, flat, or down)
- Domain Authority or Domain Rating
- Number of indexed pages
- Technical issues (crawl errors, speed, mobile usability)
- Current keyword rankings and positions
- Existing backlink profile strength
- Content inventory (how many pages, quality level)
This audit reveals whether you need heavy technical work upfront or can jump straight to content and links.
Step 3: Research Your Competition
Use a tool like Ahrefs or Semrush to analyze your top 5 organic competitors. Document:
- Their estimated monthly organic traffic
- Their Domain Rating
- Their content publishing frequency
- Their backlink growth rate
- Their top-performing pages and keyword targets
The gap between your metrics and theirs tells you how aggressive your budget needs to be. A small gap means a smaller budget can close it. A large gap requires either a larger budget or a longer timeline.
Step 4: Calculate Your Baseline Budget
Use the revenue-based formula from the section above:
Gross annual revenue x marketing percentage x SEO allocation = annual SEO budget.
Example: $2M revenue x 7% marketing x 30% SEO allocation = $42,000 per year ($3,500 per month).
Compare this number to your competitive research. If competitors are clearly outspending you by 3-5x, you either need to increase the budget, narrow your keyword targets, or extend your timeline.
Step 5: Allocate Across the 5 Categories
Take your monthly budget number and split it across the 5 categories. Adjust the percentages based on your audit findings.
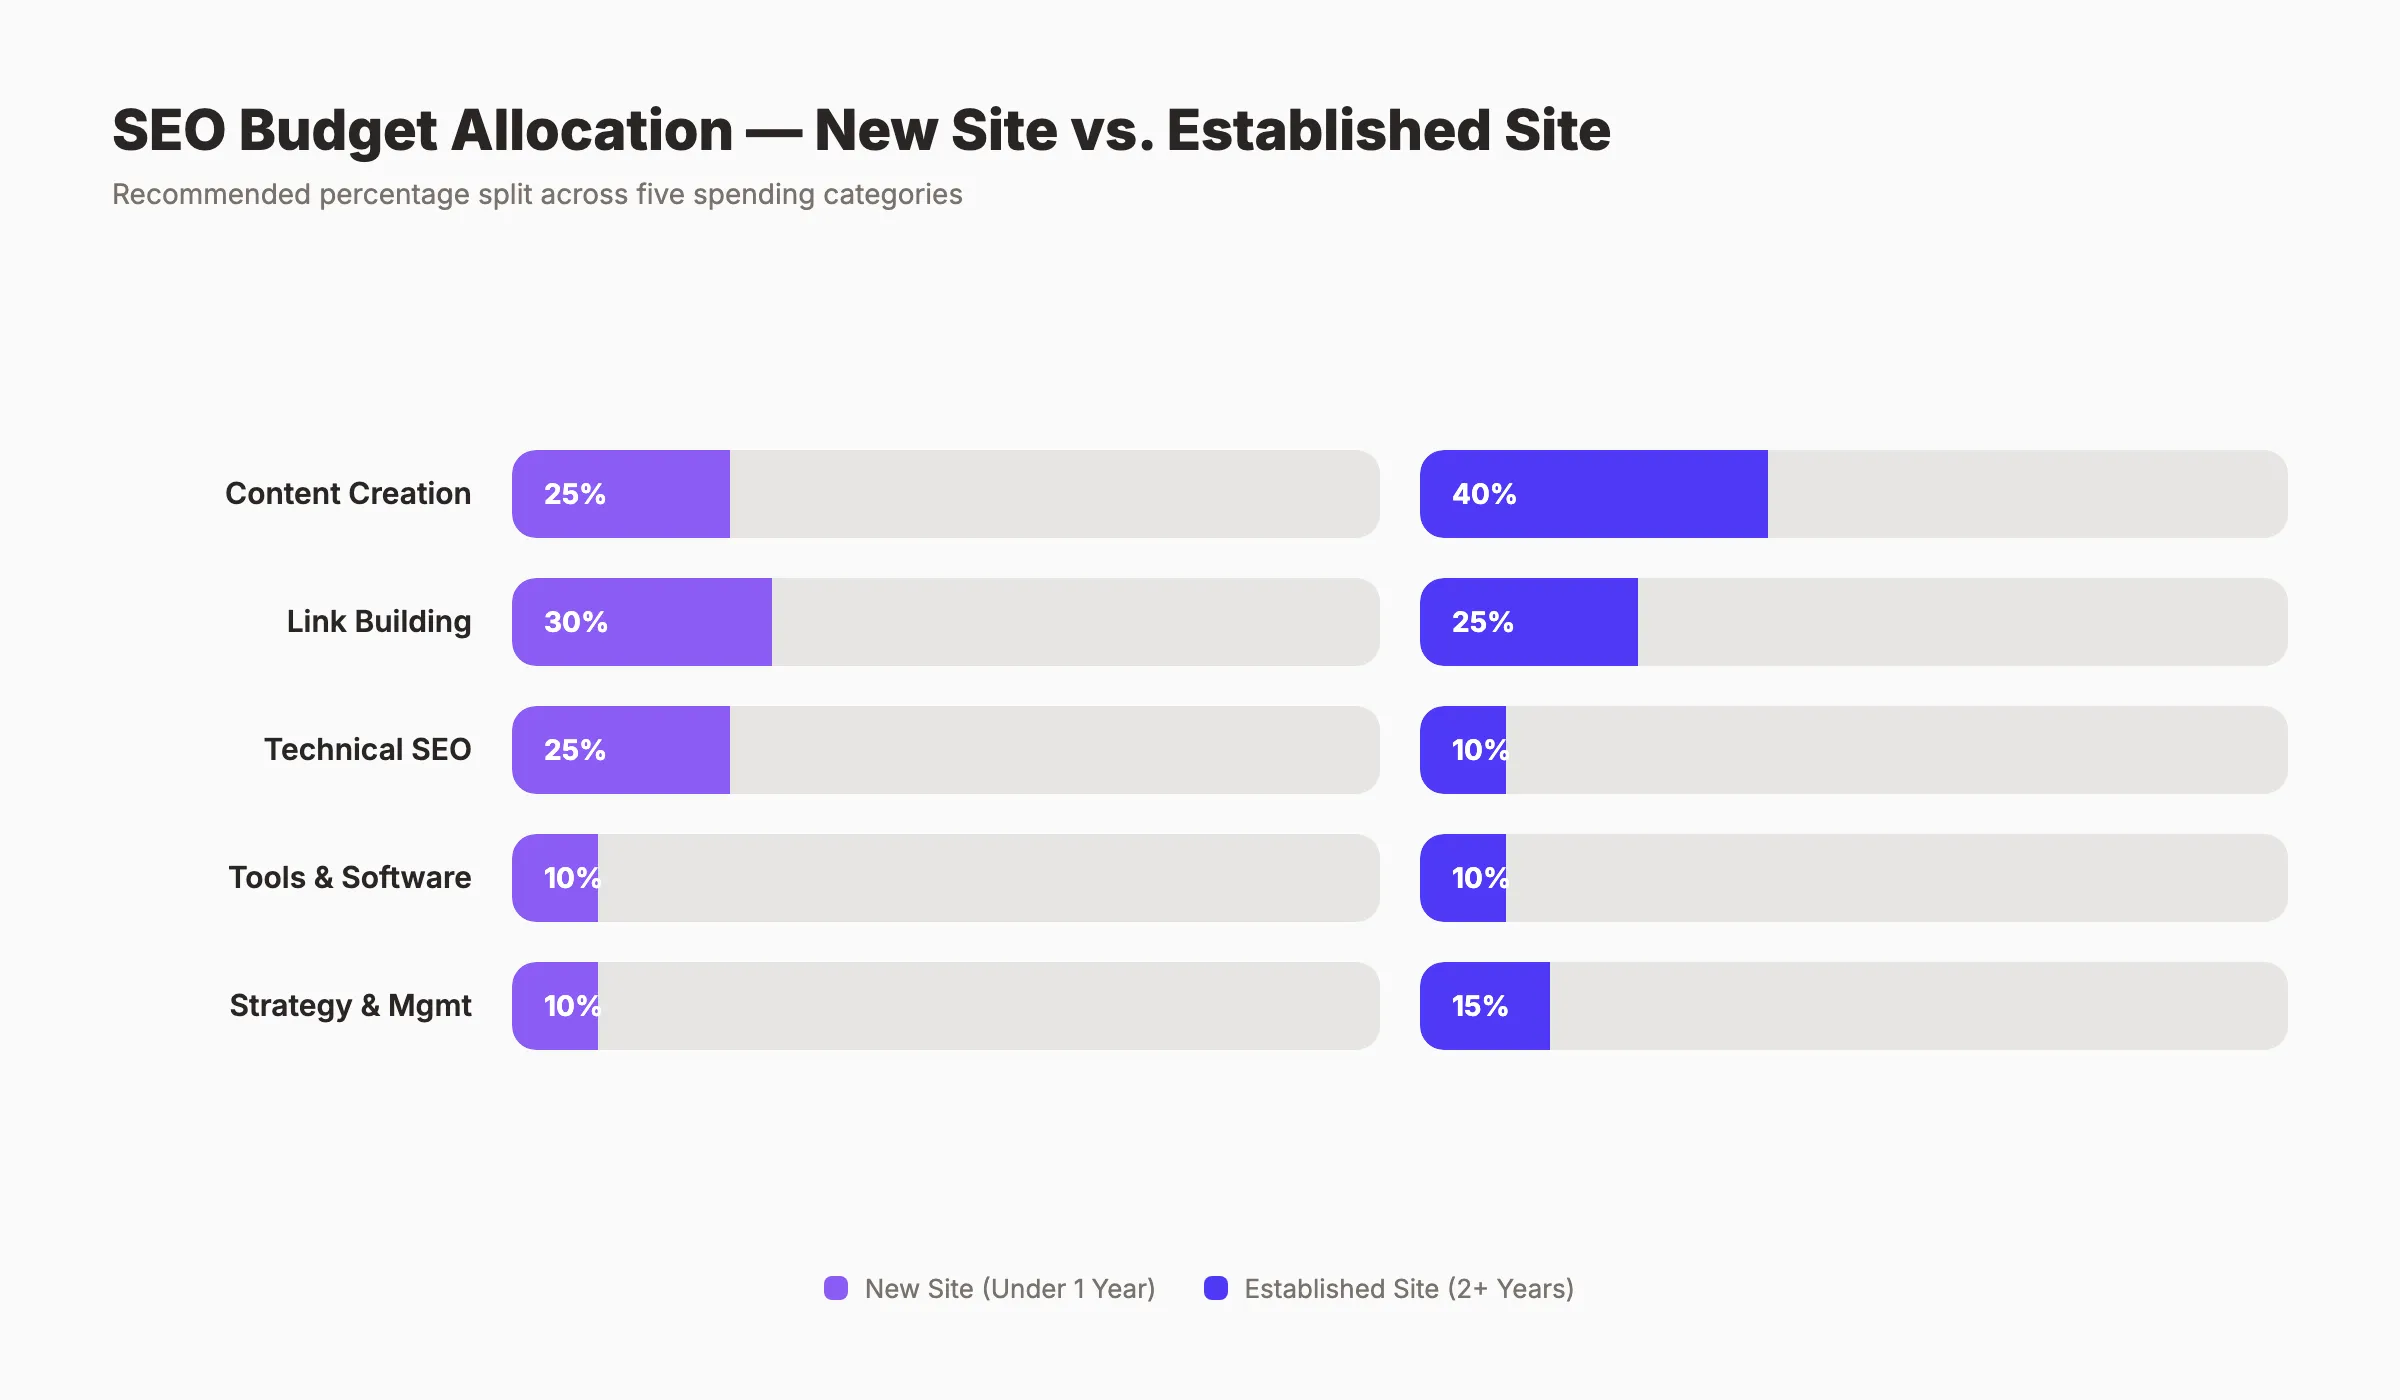
New site (under 1 year, low authority):
| Category | Allocation | Example ($3,000/mo) |
|---|---|---|
| Content Creation | 25% | $750 |
| Link Building | 30% | $900 |
| Technical SEO | 25% | $750 |
| Tools | 10% | $300 |
| Strategy/Management | 10% | $300 |
Established site (2+ years, moderate authority):
| Category | Allocation | Example ($3,000/mo) |
|---|---|---|
| Content Creation | 40% | $1,200 |
| Link Building | 25% | $750 |
| Technical SEO | 10% | $300 |
| Tools | 10% | $300 |
| Strategy/Management | 15% | $450 |
Notice how the new site front-loads technical SEO and link building, while the established site shifts toward content scaling and strategy.
Step 6: Build in a Buffer
Set aside 10-15% of your total budget for unexpected needs. Algorithm updates, competitor moves, technical emergencies, and new opportunities all require budget flexibility.
The 80/20 rule works well here: spend 80% on proven strategies and reserve 20% for testing and responding to changes.
Step 7: Set Review Checkpoints
SEO budgets are not set-and-forget. Schedule quarterly reviews to evaluate:
- Traffic growth vs. goal
- Keyword ranking progress
- Cost per organic lead
- Content performance by category
- Link acquisition rate vs. target
Adjust allocations based on what the data shows. If content is driving results but links are not, shift 5-10% from link building to content. If technical issues are holding back rankings, temporarily increase technical spend.
SEO Budget by Business Size
Different business sizes face different SEO challenges. Here is how budget allocation shifts.
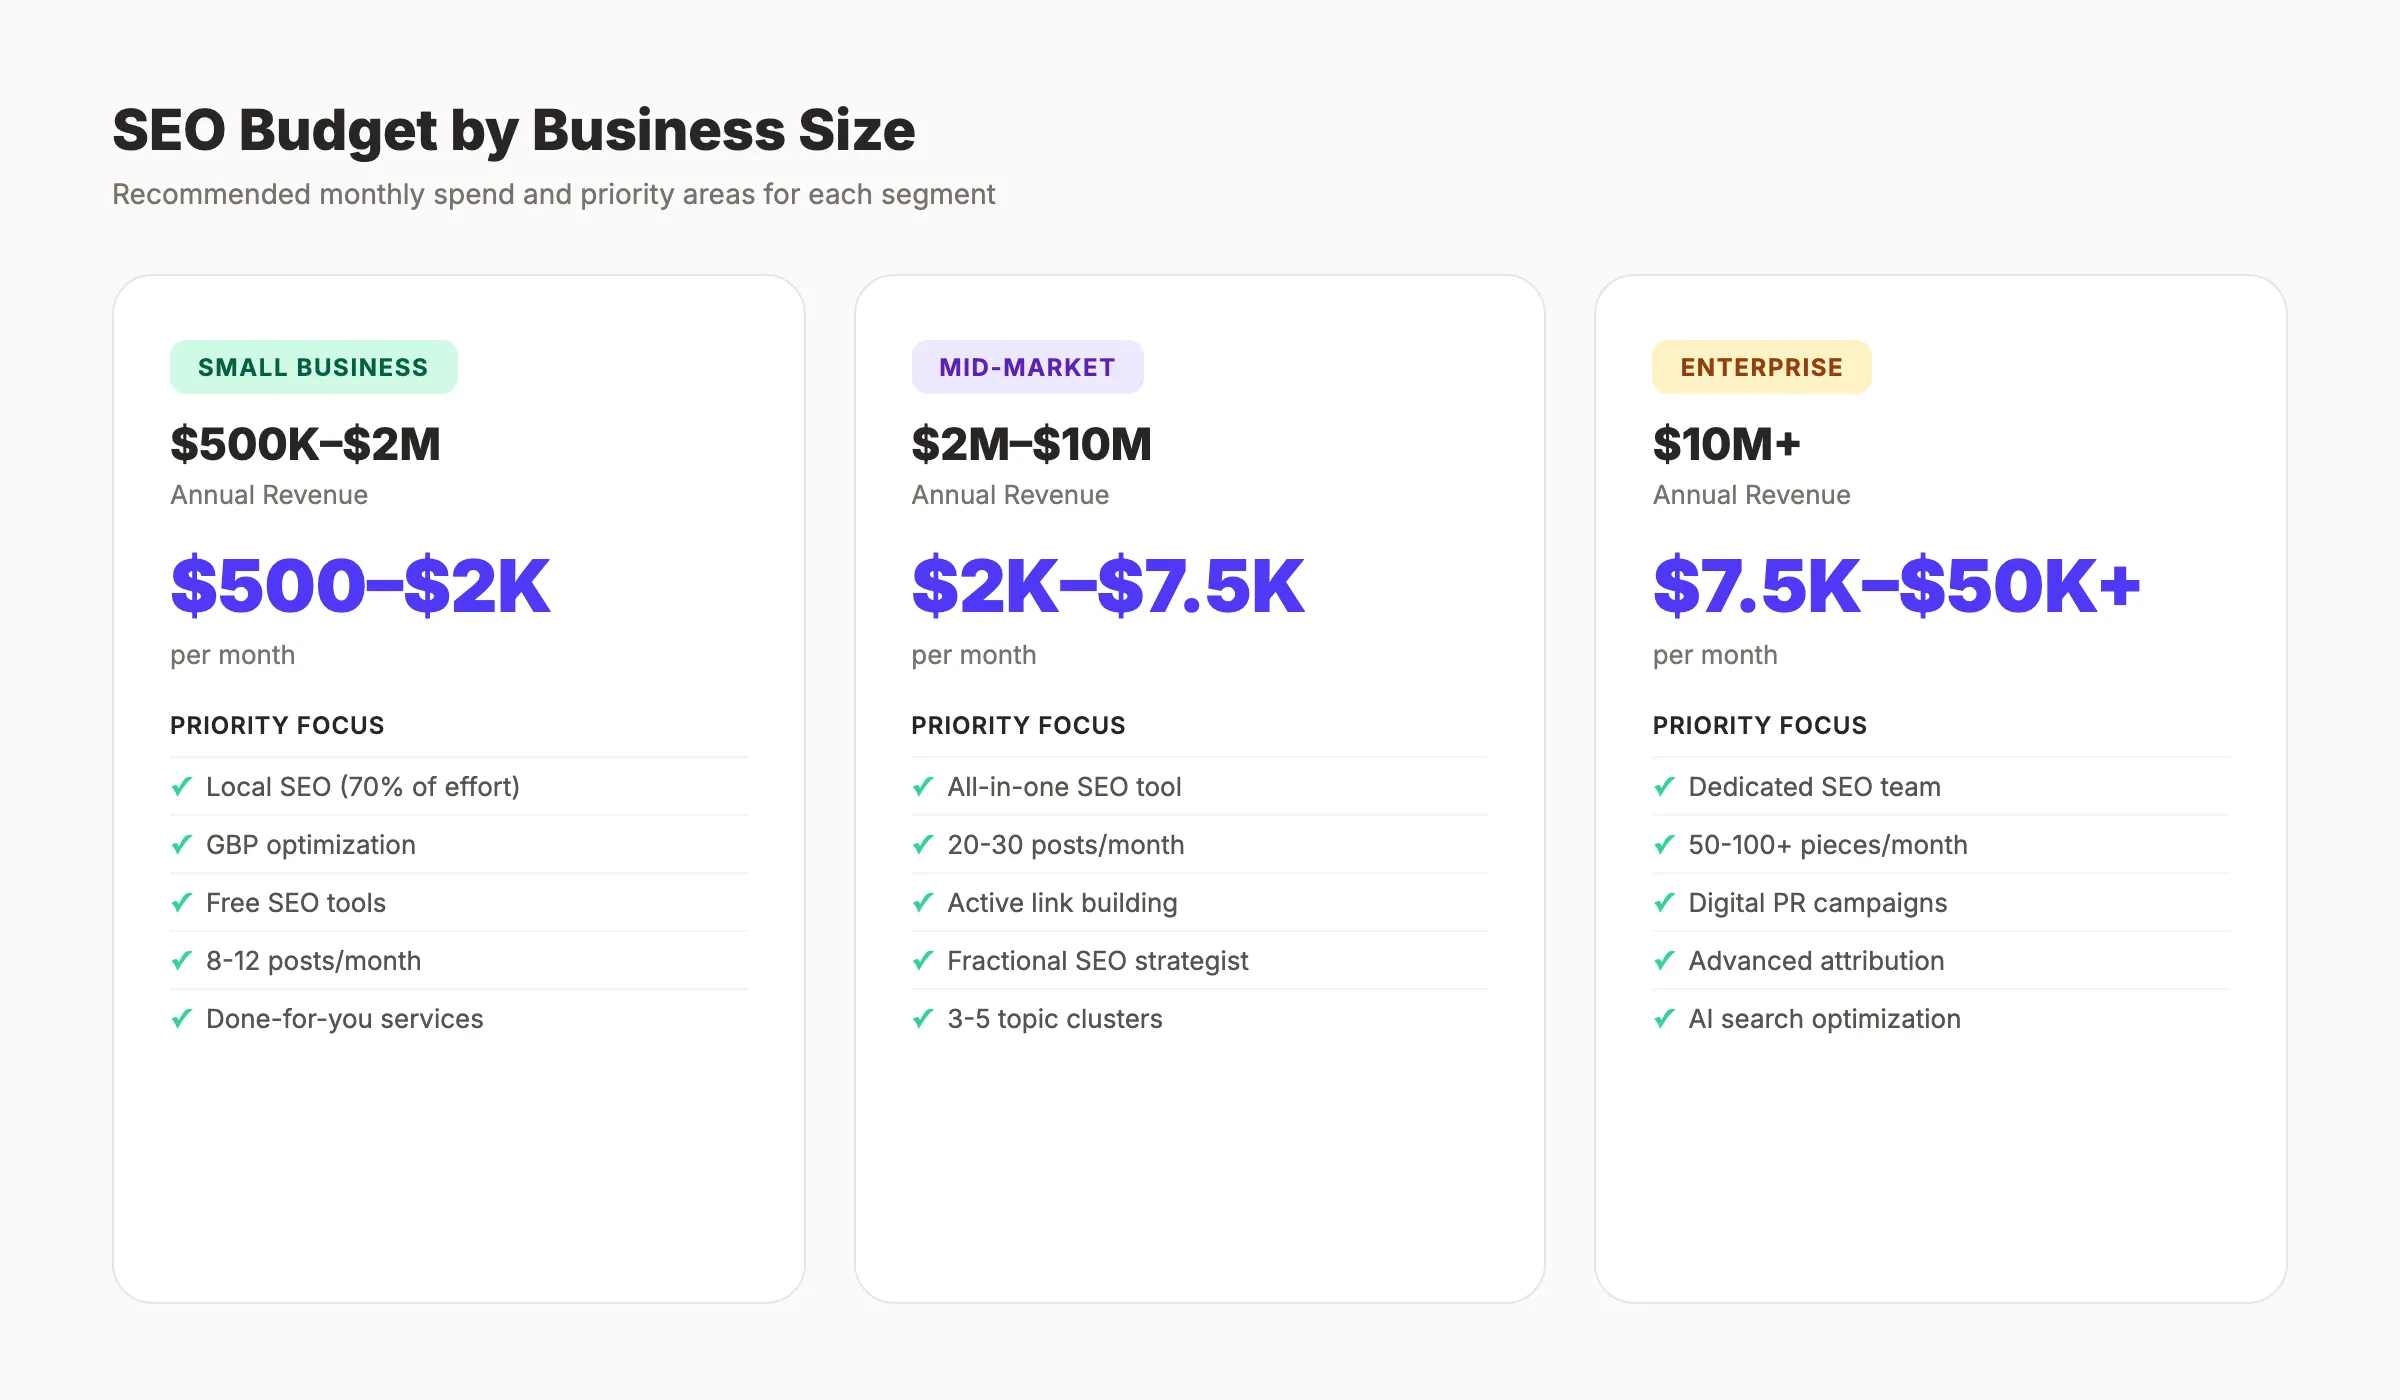
Small Business ($500K-$2M Revenue)
Typical monthly budget: $500-$2,000 Biggest challenge: Limited resources, need to prioritize ruthlessly.
Recommended allocation:
- Focus 70% of effort on local SEO if you serve a geographic area
- Use free SEO tools to minimize tool spend
- Prioritize Google Business Profile optimization (free and high-impact)
- Publish consistently even if volume is low (8-12 posts per month is enough to start)
At this level, done-for-you SEO services that handle content and optimization for a flat monthly fee deliver the best value. Hiring an agency at $3,000+ per month does not make sense when that represents 2-3% of revenue.
Mid-Market ($2M-$10M Revenue)
Typical monthly budget: $2,000-$7,500 Biggest challenge: Scaling content without sacrificing quality.
Recommended allocation:
- Invest in an all-in-one SEO tool ($150-$300 per month)
- Increase content volume to 20-30 posts per month
- Start an active link building program
- Hire or contract a dedicated SEO strategist (part-time or fractional)
- Build topical authority in 3-5 core keyword clusters
This is the stage where comparing agencies to AI tools becomes critical. A $5,000 per month agency budget that produces 8 articles can be replaced with a $99 per month service that produces 30.
Enterprise ($10M+ Revenue)
Typical monthly budget: $7,500-$50,000+ Biggest challenge: Coordination across teams, technical debt, international expansion.
Recommended allocation:
- Dedicated in-house SEO team or senior agency partnership
- Full technical SEO program with developer support
- Content production at scale (50-100+ pieces per month)
- Active digital PR and link building campaigns
- Advanced analytics and attribution modeling
- Generative engine optimization and AI search visibility
Enterprise budgets should also account for 15-25% allocated to emerging channels like AI Overviews optimization and AI search visibility.
Stop writing. Start ranking. Stacc publishes 30 SEO articles per month for $99. No writers. No briefs. No editorial calendar. Start for $1 →
Quarter-by-Quarter Budget Phasing
SEO budgets should not stay static. Phase your spending to match where you are in the SEO growth cycle.
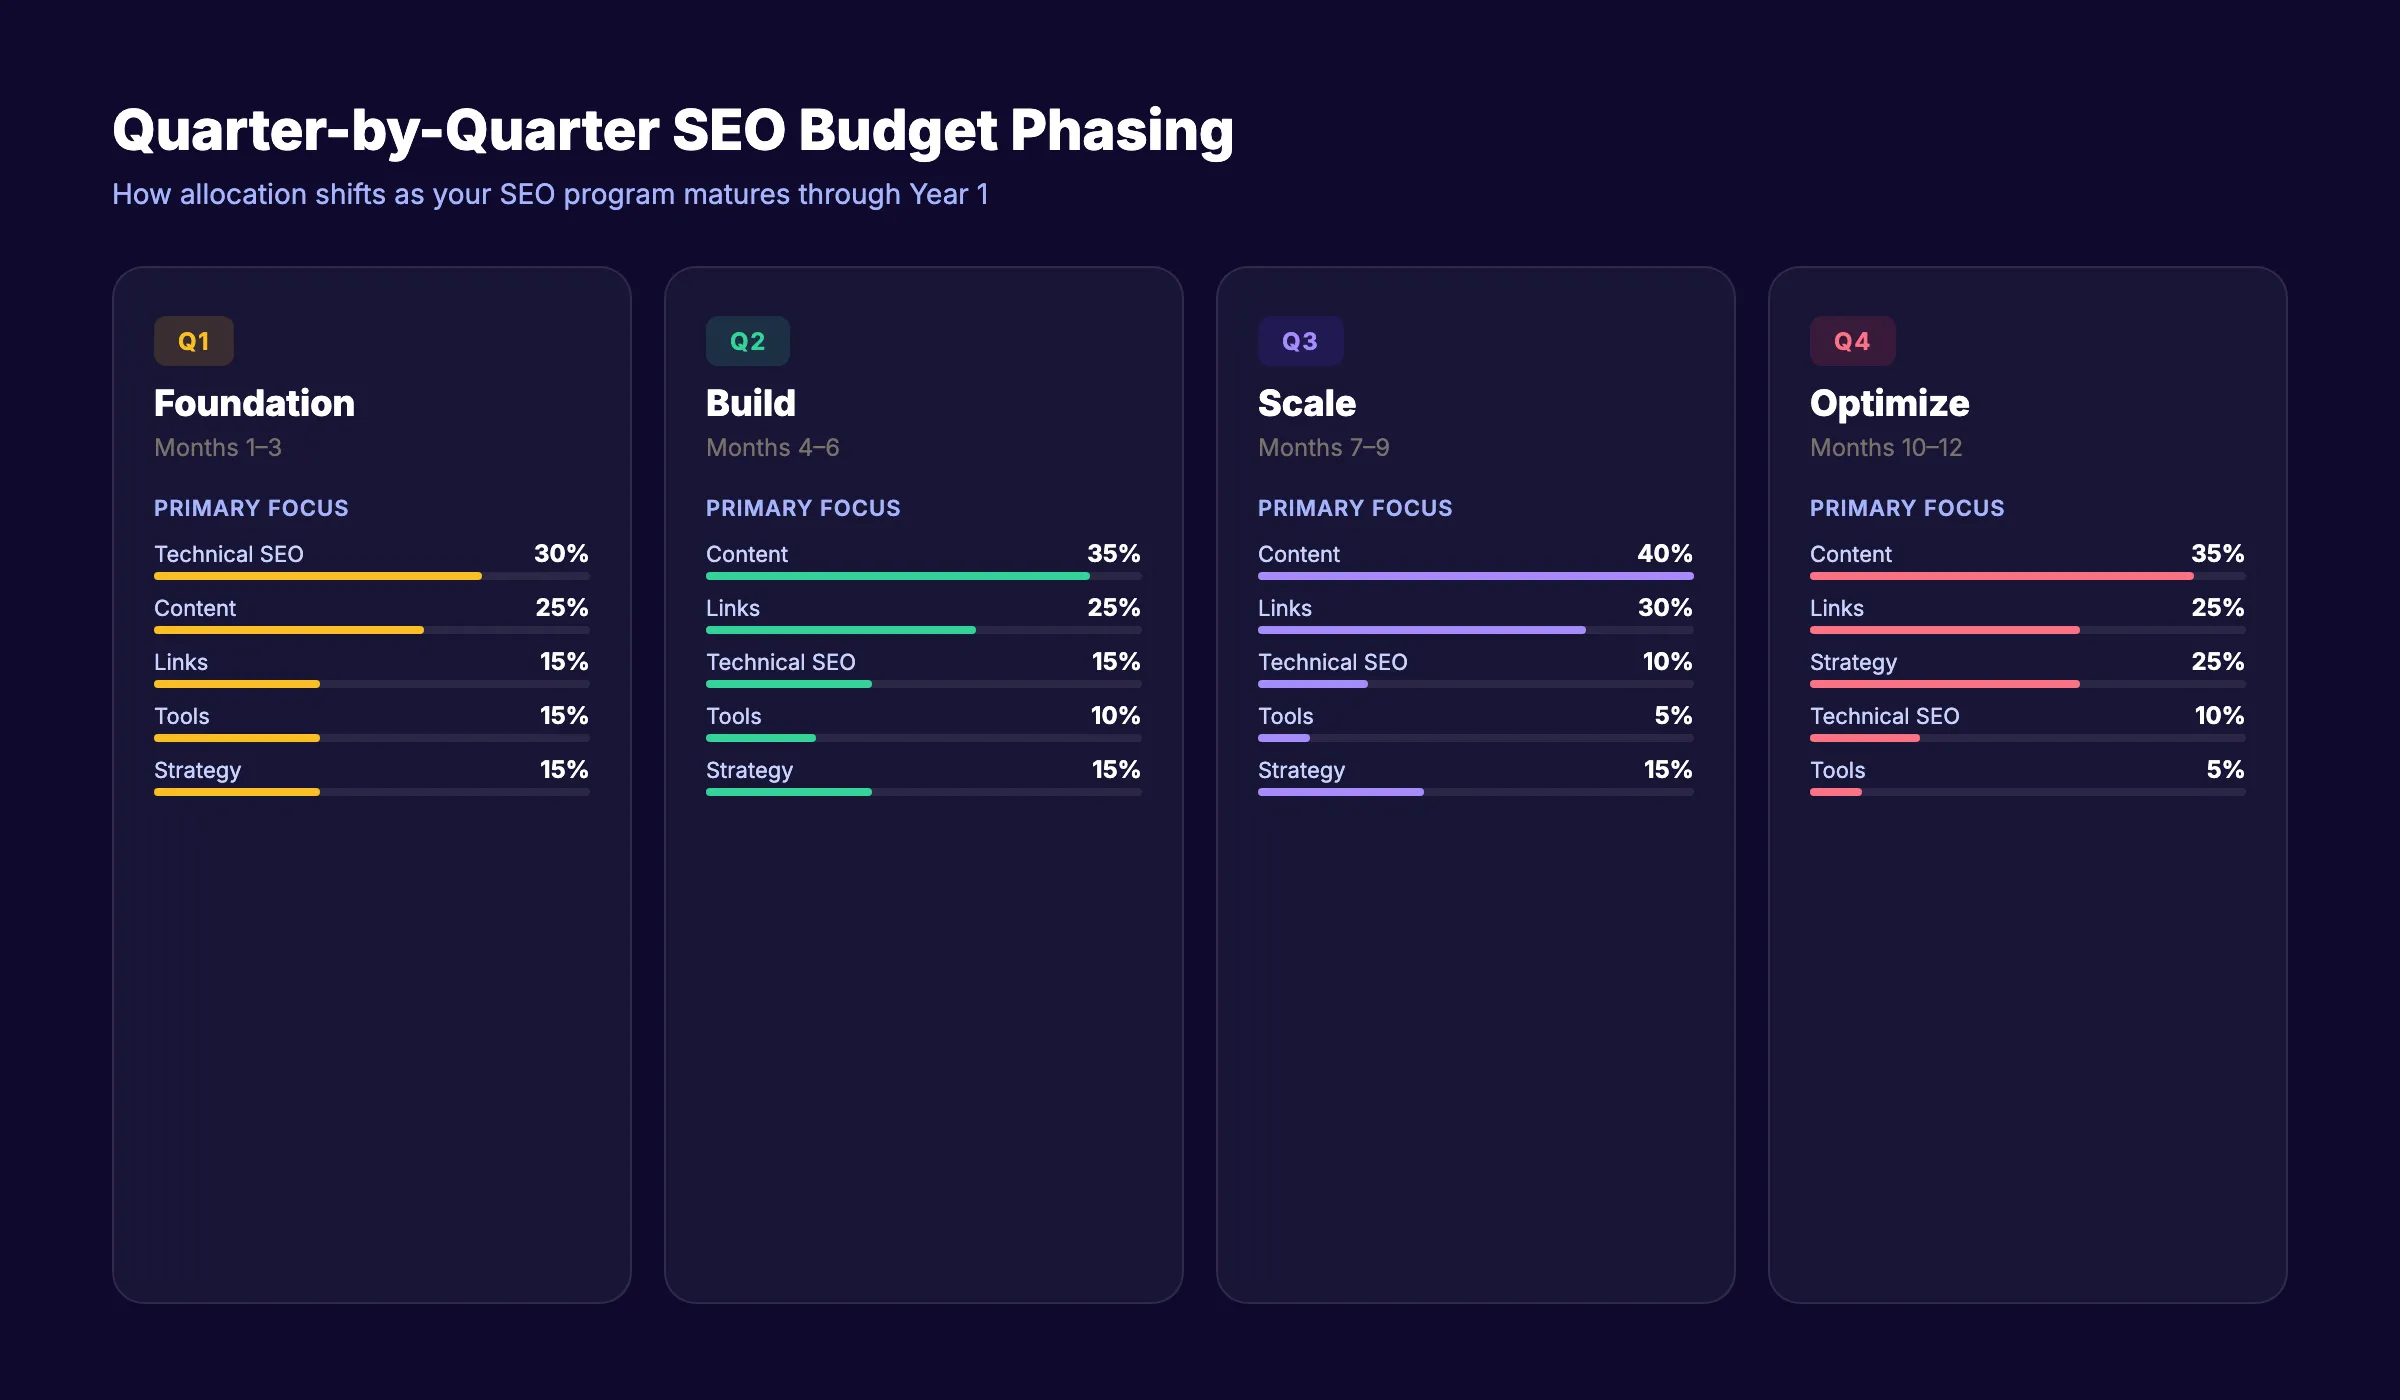
Q1: Foundation (Months 1-3)
Focus: Technical fixes + content foundation + strategy.
| Category | Q1 Allocation |
|---|---|
| Technical SEO | 30% |
| Content Creation | 25% |
| Link Building | 15% |
| Tools | 15% |
| Strategy | 15% |
This is where you fix crawl errors, optimize site speed, set up tracking, and publish your first batch of foundational content. Tool spending is higher because you are setting up your stack.
Q2: Build (Months 4-6)
Focus: Content scaling + initial link building.
| Category | Q2 Allocation |
|---|---|
| Content Creation | 35% |
| Link Building | 25% |
| Technical SEO | 15% |
| Tools | 10% |
| Strategy | 15% |
Technical issues should be resolved. Shift spending to content production and begin active link outreach. This is typically when you start seeing early ranking signals.
Q3: Scale (Months 7-9)
Focus: Content volume + aggressive link building.
| Category | Q3 Allocation |
|---|---|
| Content Creation | 40% |
| Link Building | 30% |
| Technical SEO | 10% |
| Tools | 5% |
| Strategy | 15% |
By Q3, your content machine should be running. Push link building harder to accelerate the authority signals that lift all pages. Cut tool spending to only what you actively use.
Q4: Optimize (Months 10-12)
Focus: Measure, refine, double down on winners.
| Category | Q4 Allocation |
|---|---|
| Content Creation | 35% |
| Link Building | 25% |
| Technical SEO | 10% |
| Tools | 5% |
| Strategy/Reporting | 25% |
Strategy and reporting increase in Q4 because you need to assess what worked, calculate ROI, and plan next year’s budget. Update old content that underperformed. Double content investment on topics that drove the most leads.
8 SEO Budget Mistakes That Waste Money
These mistakes show up at every budget level. Each one silently drains ROI.
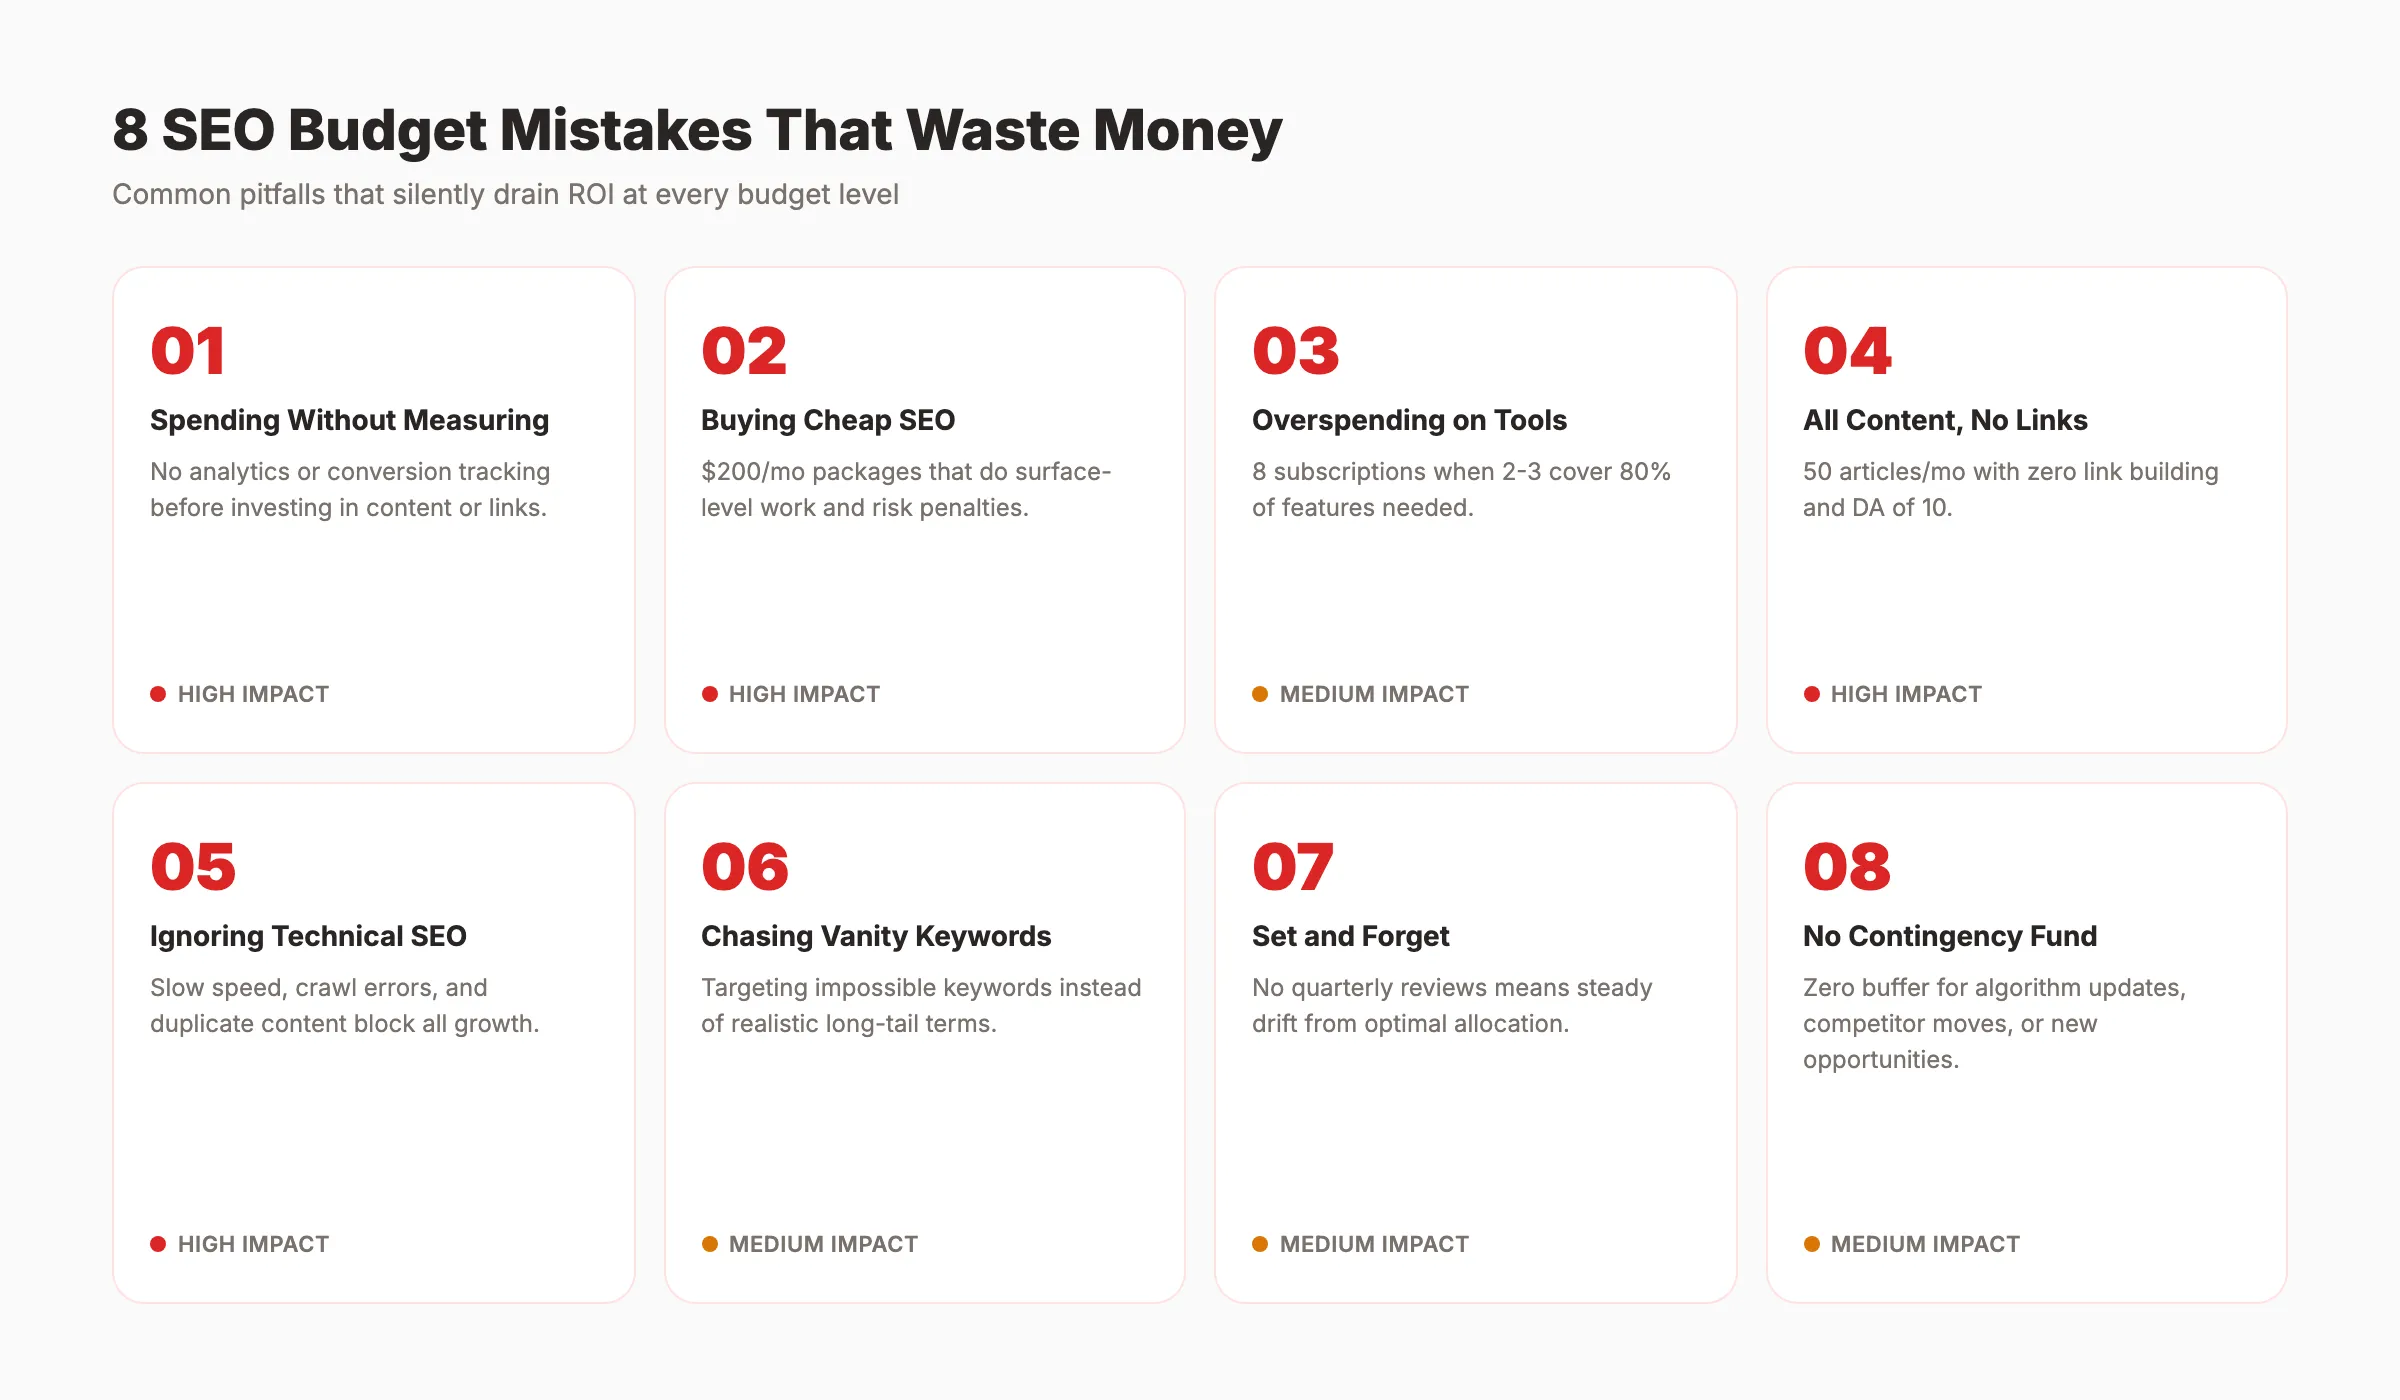
Mistake 1: Spending Without Measuring
If you cannot tie your SEO spend to organic traffic growth, lead generation, or revenue impact, you are flying blind. Set up Google Search Console and GA4 tracking before spending a single dollar on content or links.
Mistake 2: Buying Cheap SEO Services
A $200 per month SEO “package” does not deliver SEO. It delivers a checklist of surface-level tasks that look productive but change nothing. Businesses that buy cheap SEO often spend more cleaning up the damage afterward. Low-quality link building can trigger manual penalties that take months to recover from.
Mistake 3: Overspending on Tools
The average SEO team needs 2-3 tools. Not 8. Before adding another subscription, check whether your existing tools already cover that feature. Budget SEO tools cover 80% of what enterprise tools offer at 20% of the price.
Mistake 4: All Content, No Links
Publishing 50 articles per month means nothing if your domain authority is 10 and no one links to your site. Content and links work together. Allocating zero budget to link building is the fastest way to produce content that never ranks.
Mistake 5: Ignoring Technical Foundations
A site with a 4-second load time, broken internal links, and duplicate content will not rank. Period. No amount of content or links fixes a broken technical foundation. Run a technical SEO checklist before investing in growth.
Mistake 6: Chasing Vanity Keywords
Targeting “marketing” when you are a 10-person agency wastes budget on keywords you will never rank for. Focus on long-tail keywords with realistic difficulty scores and clear commercial intent. The keyword research guide covers how to choose targets that match your authority level.
Mistake 7: Setting and Forgetting
SEO budgets need quarterly review. What worked 6 months ago may not work today. Algorithm updates shift priorities. Competitors adjust their strategies. A static budget guarantees drift from optimal allocation.
Mistake 8: No Contingency Fund
Google rolls out core updates multiple times per year. Without a 10-15% buffer, you cannot respond to ranking drops, capitalize on competitor mistakes, or test new opportunities when they emerge.
Rank everywhere. Do nothing. Blog SEO, Local SEO, and Social Media on autopilot. Starting at $99 per month. Start for $1 →
How to Measure SEO ROI and Adjust Your Budget
The median SEO ROI in 2026 reaches 748%, with organizations seeing $22 in returns for every $1 invested, according to First Page Sage’s ROI report. But that number means nothing if you are not tracking your own ROI.
The ROI Formula
SEO ROI = (Revenue from organic traffic - SEO investment) / SEO investment x 100
To calculate this, you need:
- Total organic traffic (from GA4)
- Conversion rate for organic visitors
- Average customer value
- Total SEO spend (all 5 categories combined)
Use the SEO ROI calculator to run this quickly.
Key Metrics to Track Monthly
| Metric | What It Tells You | Tool |
|---|---|---|
| Organic sessions | Overall traffic growth | GA4 |
| Keyword rankings | Visibility progress | Ahrefs, Semrush |
| Organic conversions | Lead generation from SEO | GA4 Goals |
| Cost per organic lead | Efficiency of spend | Manual calculation |
| Backlinks acquired | Authority growth | Ahrefs, GSC |
| Indexed pages | Content footprint | GSC |
| Core Web Vitals | Technical health | PageSpeed Insights |
When to Increase Your Budget
Increase your SEO budget when:
- Organic traffic is growing 10%+ month-over-month consistently
- Cost per organic lead is lower than paid channels
- You have identified new keyword clusters with high commercial value
- Competitors are increasing their SEO investment
- You have maxed out the ROI on your current allocation
When to Cut or Reallocate
Pull back spending when:
- A specific category is not producing results after 6+ months
- Tool subscriptions sit unused for 60+ days
- Content is ranking but not converting (shift budget to CRO instead)
- Your market has shifted and keywords need re-evaluation
The SEO statistics page has benchmarks you can compare your performance against.
FAQ
How much should a small business spend on SEO per month?
Most small businesses see results with $500-$2,000 per month. The exact amount depends on your competition level and goals. Businesses in low-competition local markets can start at $500. Those targeting competitive national keywords should budget $2,000 or more. Services like Stacc start at $99 per month for 30 published articles.
What percentage of revenue should go to SEO?
The standard benchmark is 5-10% of gross revenue allocated to total marketing, with 25-40% of that marketing budget dedicated to SEO. For a $1M revenue business spending 8% on marketing ($80,000 per year), that means $20,000-$32,000 per year on SEO ($1,667-$2,667 per month).
Is $500 per month enough for SEO?
Yes, for local businesses in low-competition markets. At $500 per month, focus entirely on local SEO, Google Business Profile optimization, and consistent blog publishing. Skip expensive tools and use free alternatives. Prioritize activities with the highest ROI per dollar spent.
How do I know if my SEO budget is working?
Track 3 metrics: organic traffic growth (month-over-month), keyword ranking improvements, and cost per organic lead. If all 3 are trending positive after 6 months, your budget is working. If traffic grows but leads do not, the problem is conversion rate, not SEO spend.
Should I hire an agency or handle SEO in-house?
It depends on your budget and internal capabilities. Agencies cost $1,500-$10,000 per month but require no hiring or training. In-house teams cost more upfront (salaries, tools, training) but give you full control. For businesses under $5M revenue, a hybrid approach works best: use automated SEO services for content production and keep strategy in-house.
How long until I see ROI from my SEO budget?
Most businesses see initial ranking improvements within 3-6 months and meaningful ROI within 6-12 months. The SEO timeline guide breaks this down in detail. The compounding nature of SEO means ROI accelerates over time. Year 2 typically delivers 2-3x the returns of Year 1 at the same budget level.
Your SEO budget is not a cost. It is a growth investment that compounds every month. The businesses that win at SEO are not the ones that spend the most. They are the ones that allocate the smartest, measure the tightest, and adjust the fastest.
Start with the framework in this guide. Set your numbers. Review quarterly. Let the data guide every reallocation.
Related Tools & Resources
Free SEO Tools:
Best Lists:

Written by
Siddharth GangalSiddharth is the founder of theStacc and Arka360, and a graduate of IIT Mandi. He spent years watching great businesses lose organic traffic to competitors who simply published more. So he built a system to fix that. He writes about SEO, content at scale, and the tactics that actually move rankings.
30 SEO blog articles published every month
Keyword-optimized, scheduled, and live on your site. Automatically.
30-day trial · Cancel anytime
theStacc
Stop writing SEO content manually
30 blog articles, 30 GBP posts, and social media content. Published every month. Automatically.
Start Your $1 Trial$1 for 3 days · Cancel anytime