How to Measure Content Marketing ROI (8 Steps)
Learn how to measure content marketing ROI with this 8-step guide. Includes the ROI formula, GA4 attribution setup, KPI benchmarks, and dashboard tips.
You are publishing 30 blog posts per month. Traffic is climbing. But your CEO asks one question: “What is the ROI?”
And you do not have a clear answer.
Only 36% of marketers can accurately measure content marketing ROI, according to a 2026 Content Marketing Institute report. The other 64% rely on gut feeling, vanity metrics, or avoid the question entirely. That gap costs teams their budget, their headcount, and eventually their program.
This guide fixes that. We publish 3,500+ blog posts across 70+ industries, and every one of them ties back to measurable outcomes. Here is the same 8-step process we use to measure content marketing ROI and prove content drives revenue.
Here is what you will learn:
- The exact formula to calculate content marketing ROI
- Which metrics matter at each funnel stage
- How to set up attribution in GA4
- How to build a reporting dashboard that executives trust
- Industry benchmarks so you know if your numbers are good
What Is Content Marketing ROI?
Content marketing ROI measures the revenue your content generates compared to what it costs to produce and distribute. The formula is simple. The execution is not.
A positive ROI means every dollar spent on content returns more than a dollar in revenue. A negative ROI means you are burning budget. Most teams fall somewhere in between because they do not track the right numbers.
The average return on content marketing is $7.65 for every $1 spent. But that number means nothing if you cannot prove it for your own program.
ROI is not a single metric. It is a system. You need to track costs, attribute revenue, and connect the dots across a buyer journey that spans weeks or months. The 8 steps below show you exactly how.
The Content Marketing ROI Formula
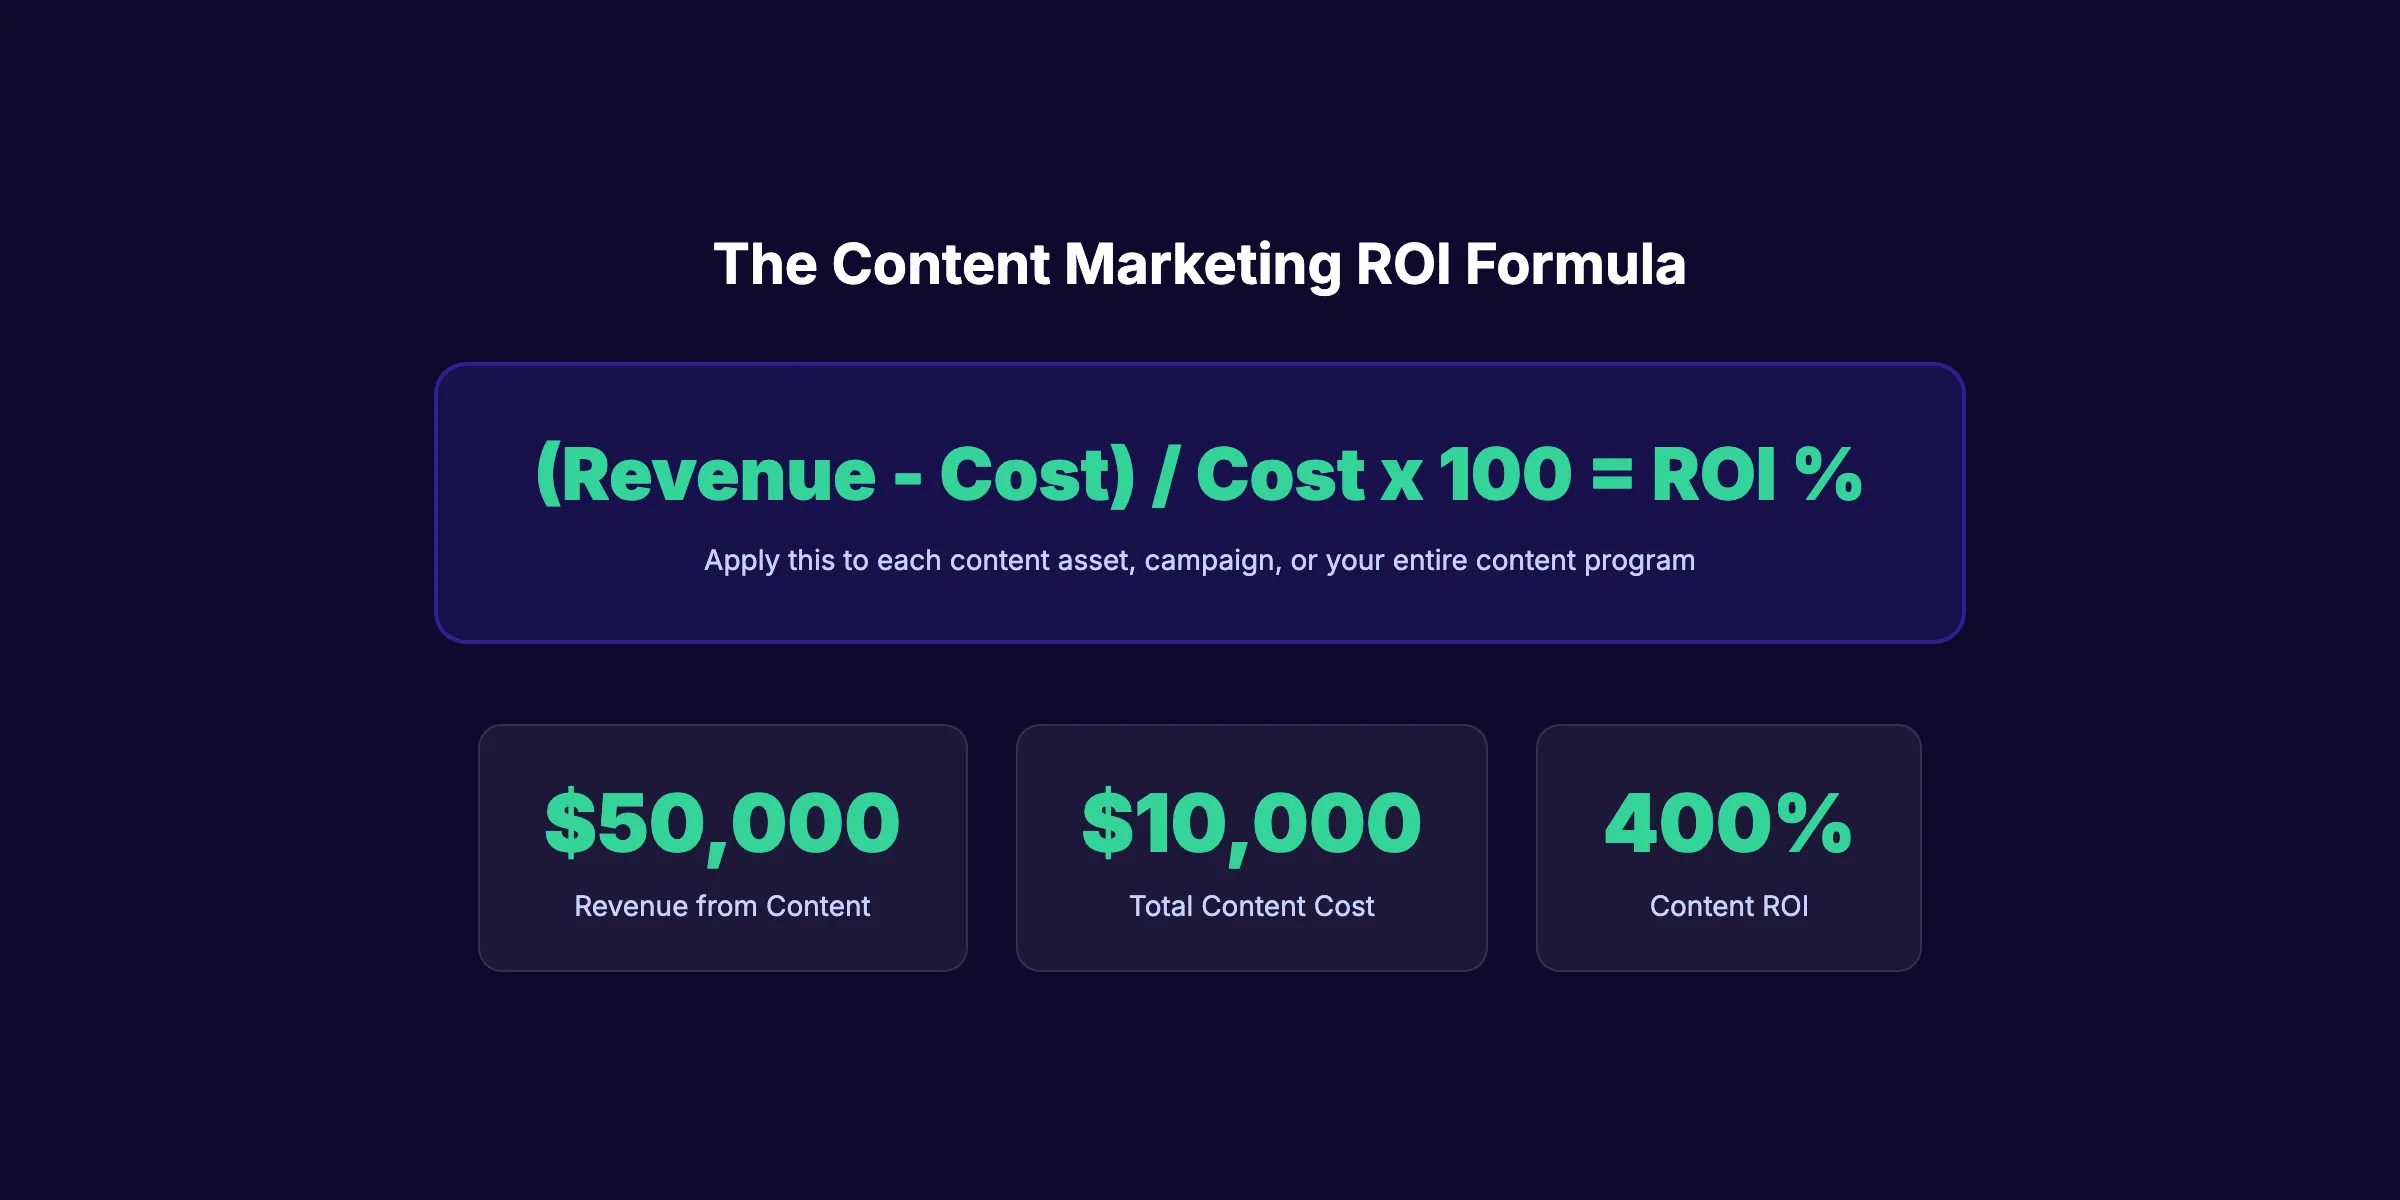
The core formula is straightforward:
(Revenue from Content - Total Content Cost) / Total Content Cost x 100 = ROI %
If your content program generates $50,000 in revenue and costs $10,000 to run, your ROI is 400%.
| Component | What to Include | Example |
|---|---|---|
| Revenue | Sales attributed to content, pipeline influenced, organic traffic value | $50,000 |
| Cost | Production, tools, distribution, labor, promotion | $10,000 |
| ROI | The percentage return | 400% |
The hard part is not the math. The hard part is getting accurate numbers for revenue and cost. The next 8 steps break down exactly how to do that.
One important note: content marketing ROI compounds over time. A blog post published today may generate leads for 2 to 3 years. Most paid ads stop working the moment you stop paying. That compounding effect is why content marketing costs 62% less than traditional marketing while generating 3x more leads.
Stop guessing whether your content works. Stacc publishes SEO-optimized blog posts that drive measurable organic traffic every month. Start for $1 →
Step 1: Define Your Content Goals and KPIs
You cannot measure ROI without defining what “return” means for your business. Start here before touching any analytics tool.
Map each content goal to a specific, measurable KPI:
| Business Goal | Content KPI | How to Measure |
|---|---|---|
| Brand awareness | Organic impressions and traffic | Google Search Console |
| Lead generation | Email signups and form fills | GA4 conversion events |
| Sales pipeline | Marketing-qualified leads (MQLs) | CRM (HubSpot, Salesforce) |
| Revenue | Closed deals attributed to content | CRM + attribution model |
| Customer retention | Repeat visits and engagement | GA4 engaged sessions |
Specifically:
- Pick 1 primary goal per content campaign (not 5)
- Assign a dollar value to each conversion type
- Set a measurement window (90 days minimum for SEO content)
A common mistake is chasing every metric at once. Pick the 1 goal that maps to revenue most directly. For most B2B companies, that is lead generation. For ecommerce, that is direct sales.
Why this step matters: Without defined goals, you will drown in data that tells you nothing. Every number needs a “so what” attached to it.
Your content marketing strategy should already define these goals. If it does not, pause and fix that first.
Step 2: Track All Content Costs
Most teams undercount costs by 40% or more. They track the freelancer invoice but forget the 3 hours their marketing manager spent editing, the SEO tool subscription, and the paid social boost.
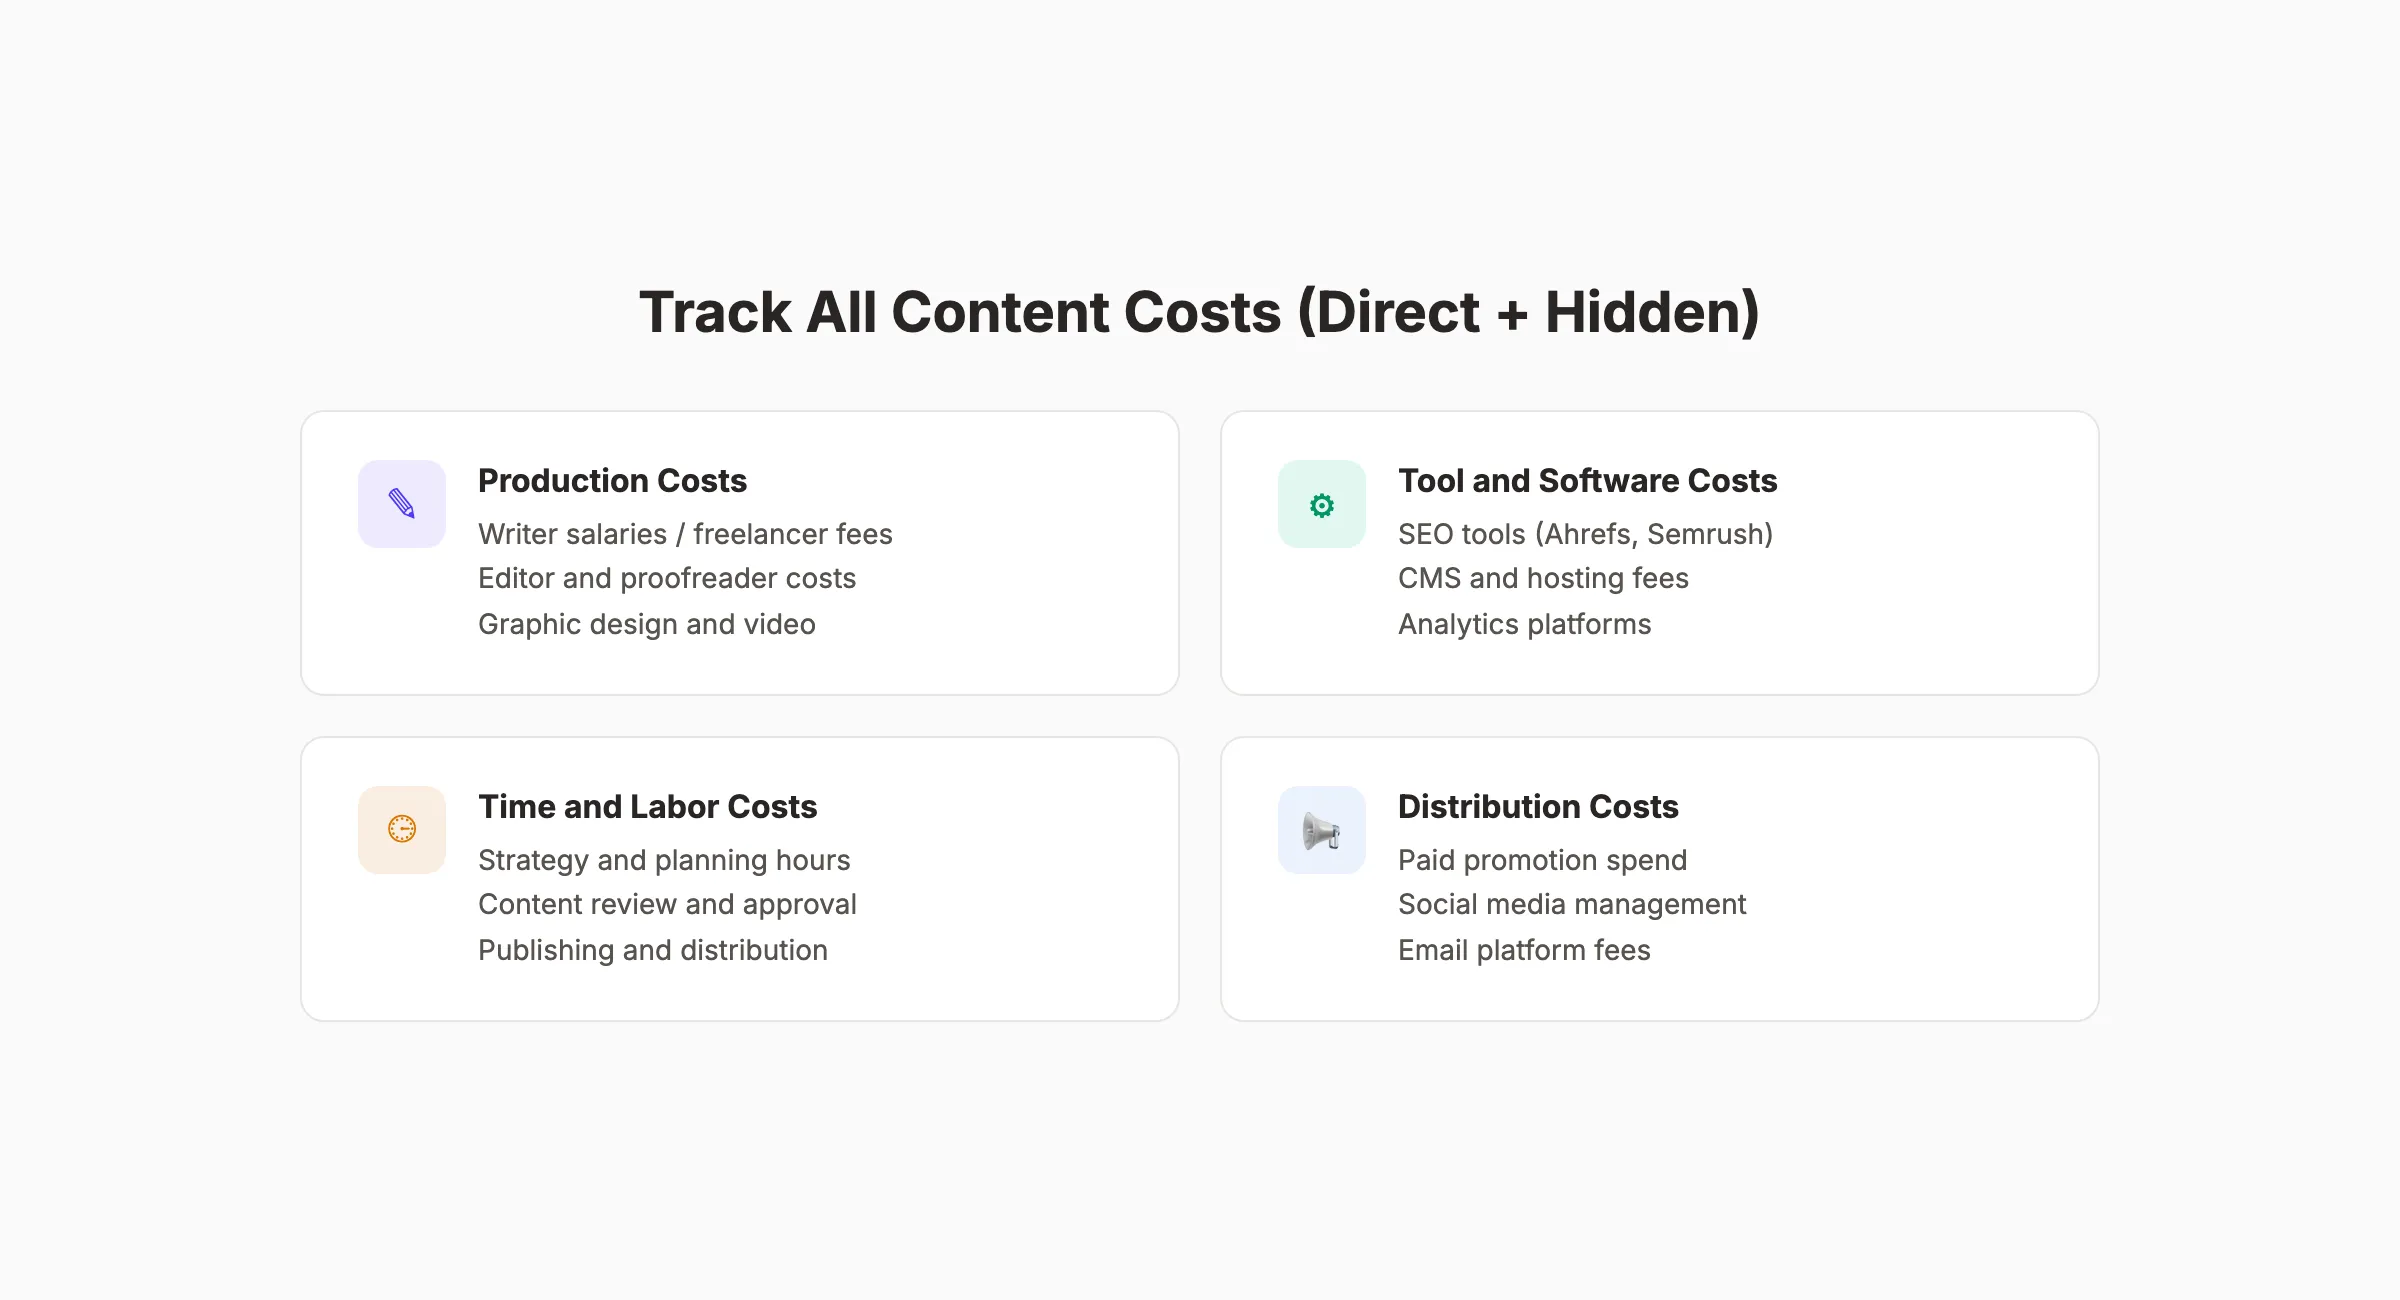
Track every dollar in these 4 categories:
Production costs:
- Writer fees (freelance or salary allocation)
- Editor and proofreader costs
- Graphic design and video production
- Photography and stock images
Tool and software costs:
- SEO tools (Ahrefs, Semrush, or your SEO ROI calculator)
- CMS and hosting fees
- Analytics platforms
- Email marketing software
Time and labor costs:
- Strategy and planning hours
- Content review and approval cycles
- Publishing and QA time
- Project management overhead
Distribution costs:
- Paid social promotion
- Email platform fees
- Content syndication
- Influencer or partnership costs
Pro tip: Calculate a blended hourly rate for your team. If a marketing manager earns $80,000 per year and spends 25% of their time on content, that is $20,000 in annual content cost most teams never count.
Why this step matters: If you undercount costs, your ROI looks artificially high. When leadership discovers the real numbers, trust erodes. Accuracy builds credibility.
For teams debating whether to build internally or hire out, this cost exercise often reveals the true price gap. See our breakdown of in-house vs outsource content teams for benchmarks.
Step 3: Set Up Attribution in GA4
Attribution answers the question: “Which content actually drove this conversion?” Without it, you are guessing.
Google Analytics 4 uses data-driven attribution by default. That means it distributes credit across multiple touchpoints instead of giving 100% to the last click.
Here is how to configure it:
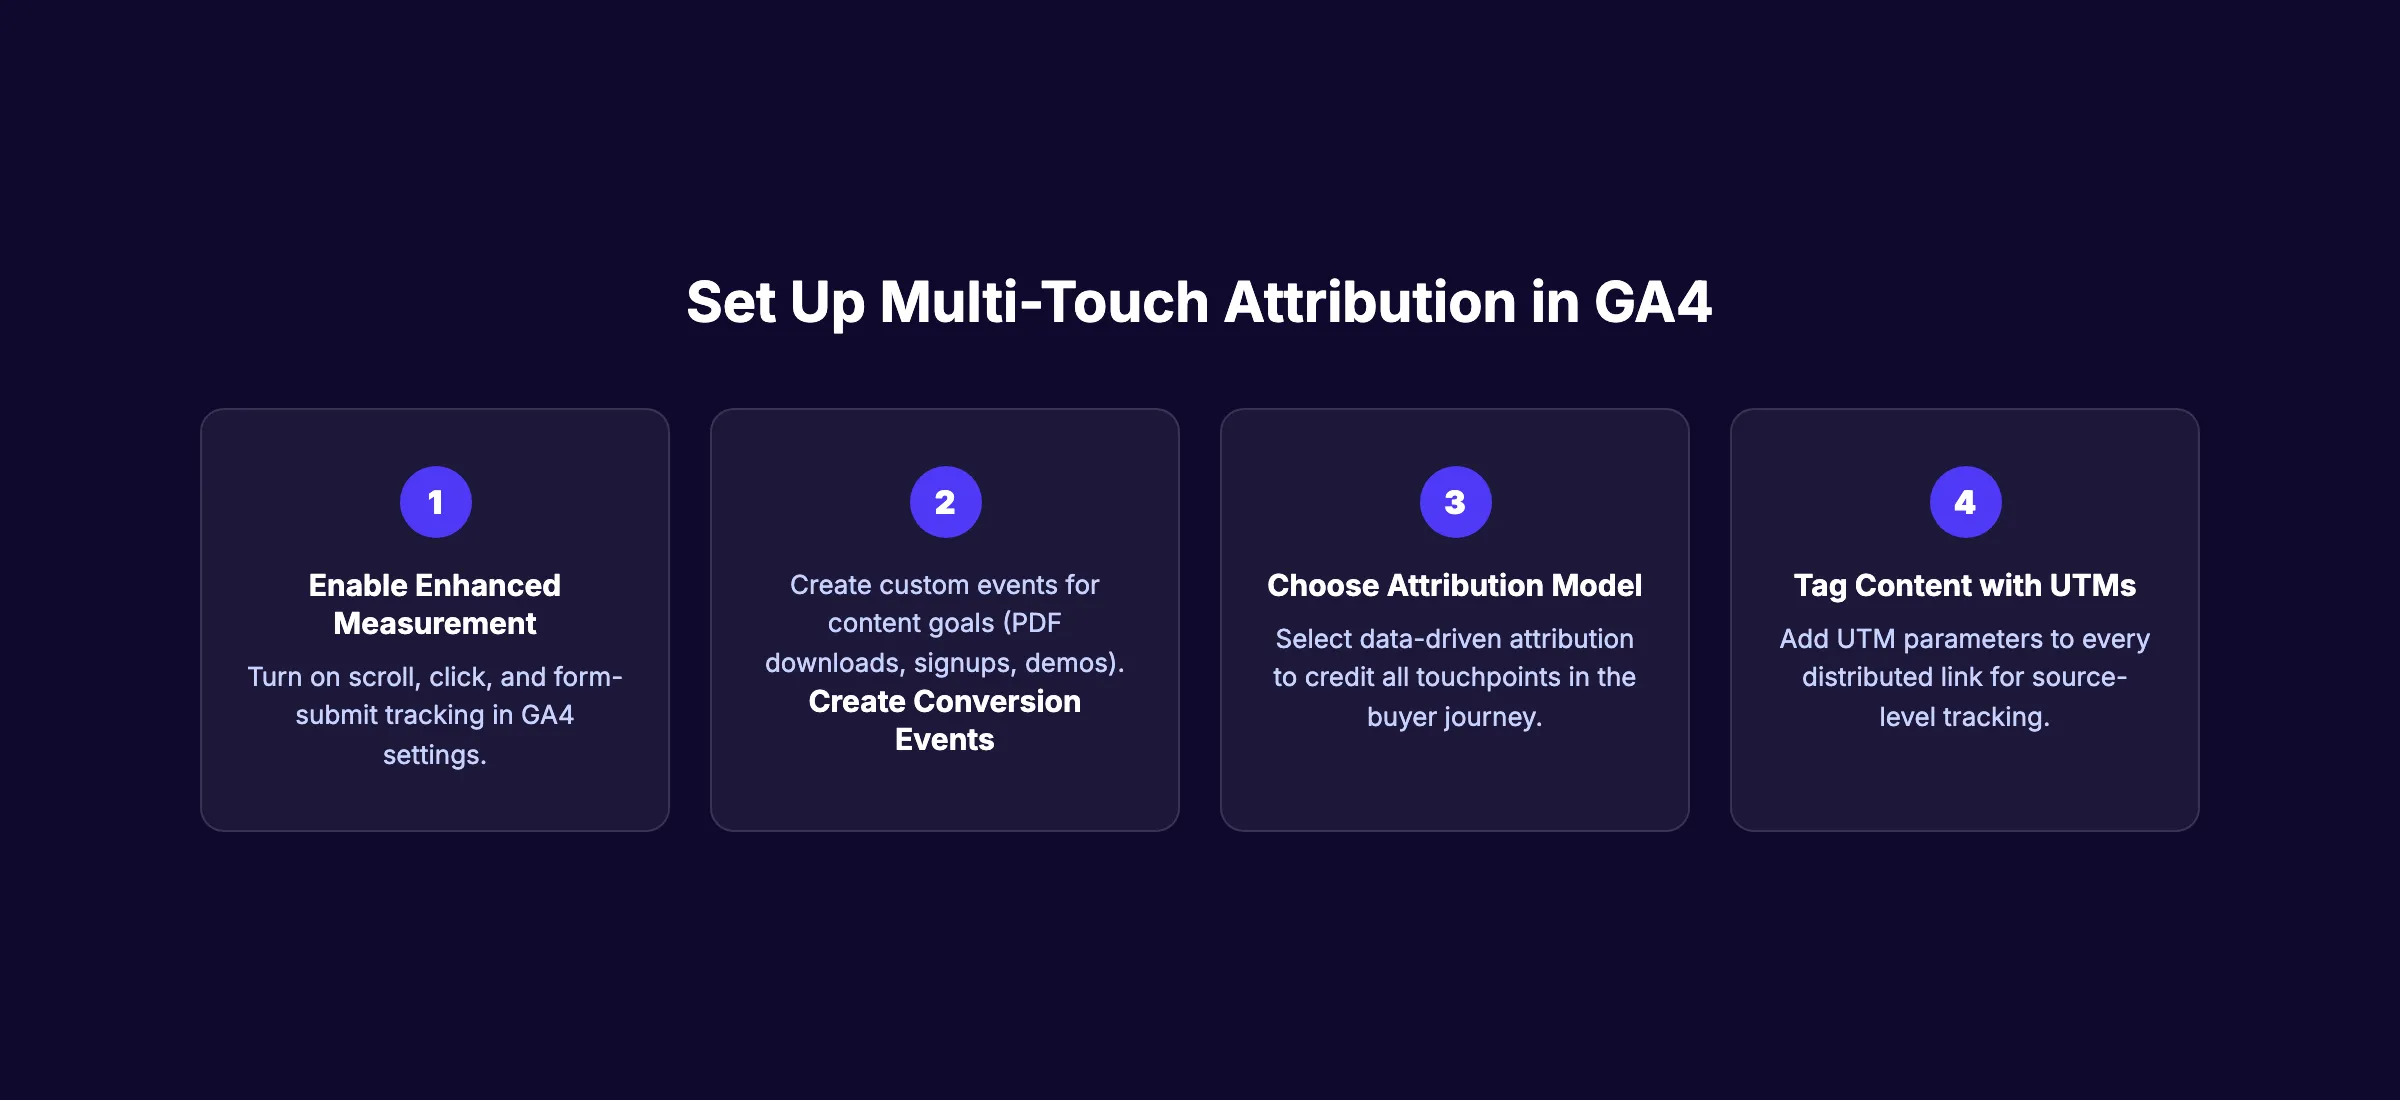
3A. Enable Enhanced Measurement
Go to Admin > Data Streams > Enhanced Measurement. Turn on scroll tracking, outbound clicks, site search, and form interactions. These events feed your attribution model.
If you have not set up GA4 yet, follow our complete Google Analytics 4 setup guide.
3B. Create Conversion Events
Mark key events as conversions in GA4:
- Form submissions (contact, demo request)
- Email signups (newsletter, lead magnet)
- Purchase completions
- Free trial starts
3C. Choose Your Attribution Model
GA4 offers data-driven attribution as the default. Keep it. It uses machine learning to assign credit based on actual user behavior patterns.
The exception is if you have very low conversion volume (under 300 per month). In that case, last-click attribution gives more stable results.
3D. Tag All Content with UTM Parameters
Every link you distribute needs UTM tags:
?utm_source=linkedin&utm_medium=social&utm_campaign=blog-march-2026Without UTMs, you lose visibility into which distribution channels drive results. Tag email links, social posts, and partner referrals.
Why this step matters: Attribution is the bridge between “people read our content” and “our content generated $50,000.” Skip this step and you can never prove ROI.
Step 4: Measure Traffic and Engagement Metrics
Traffic and engagement are leading indicators. They do not equal ROI on their own, but they predict it.
Track these metrics weekly in GA4 and Google Search Console:
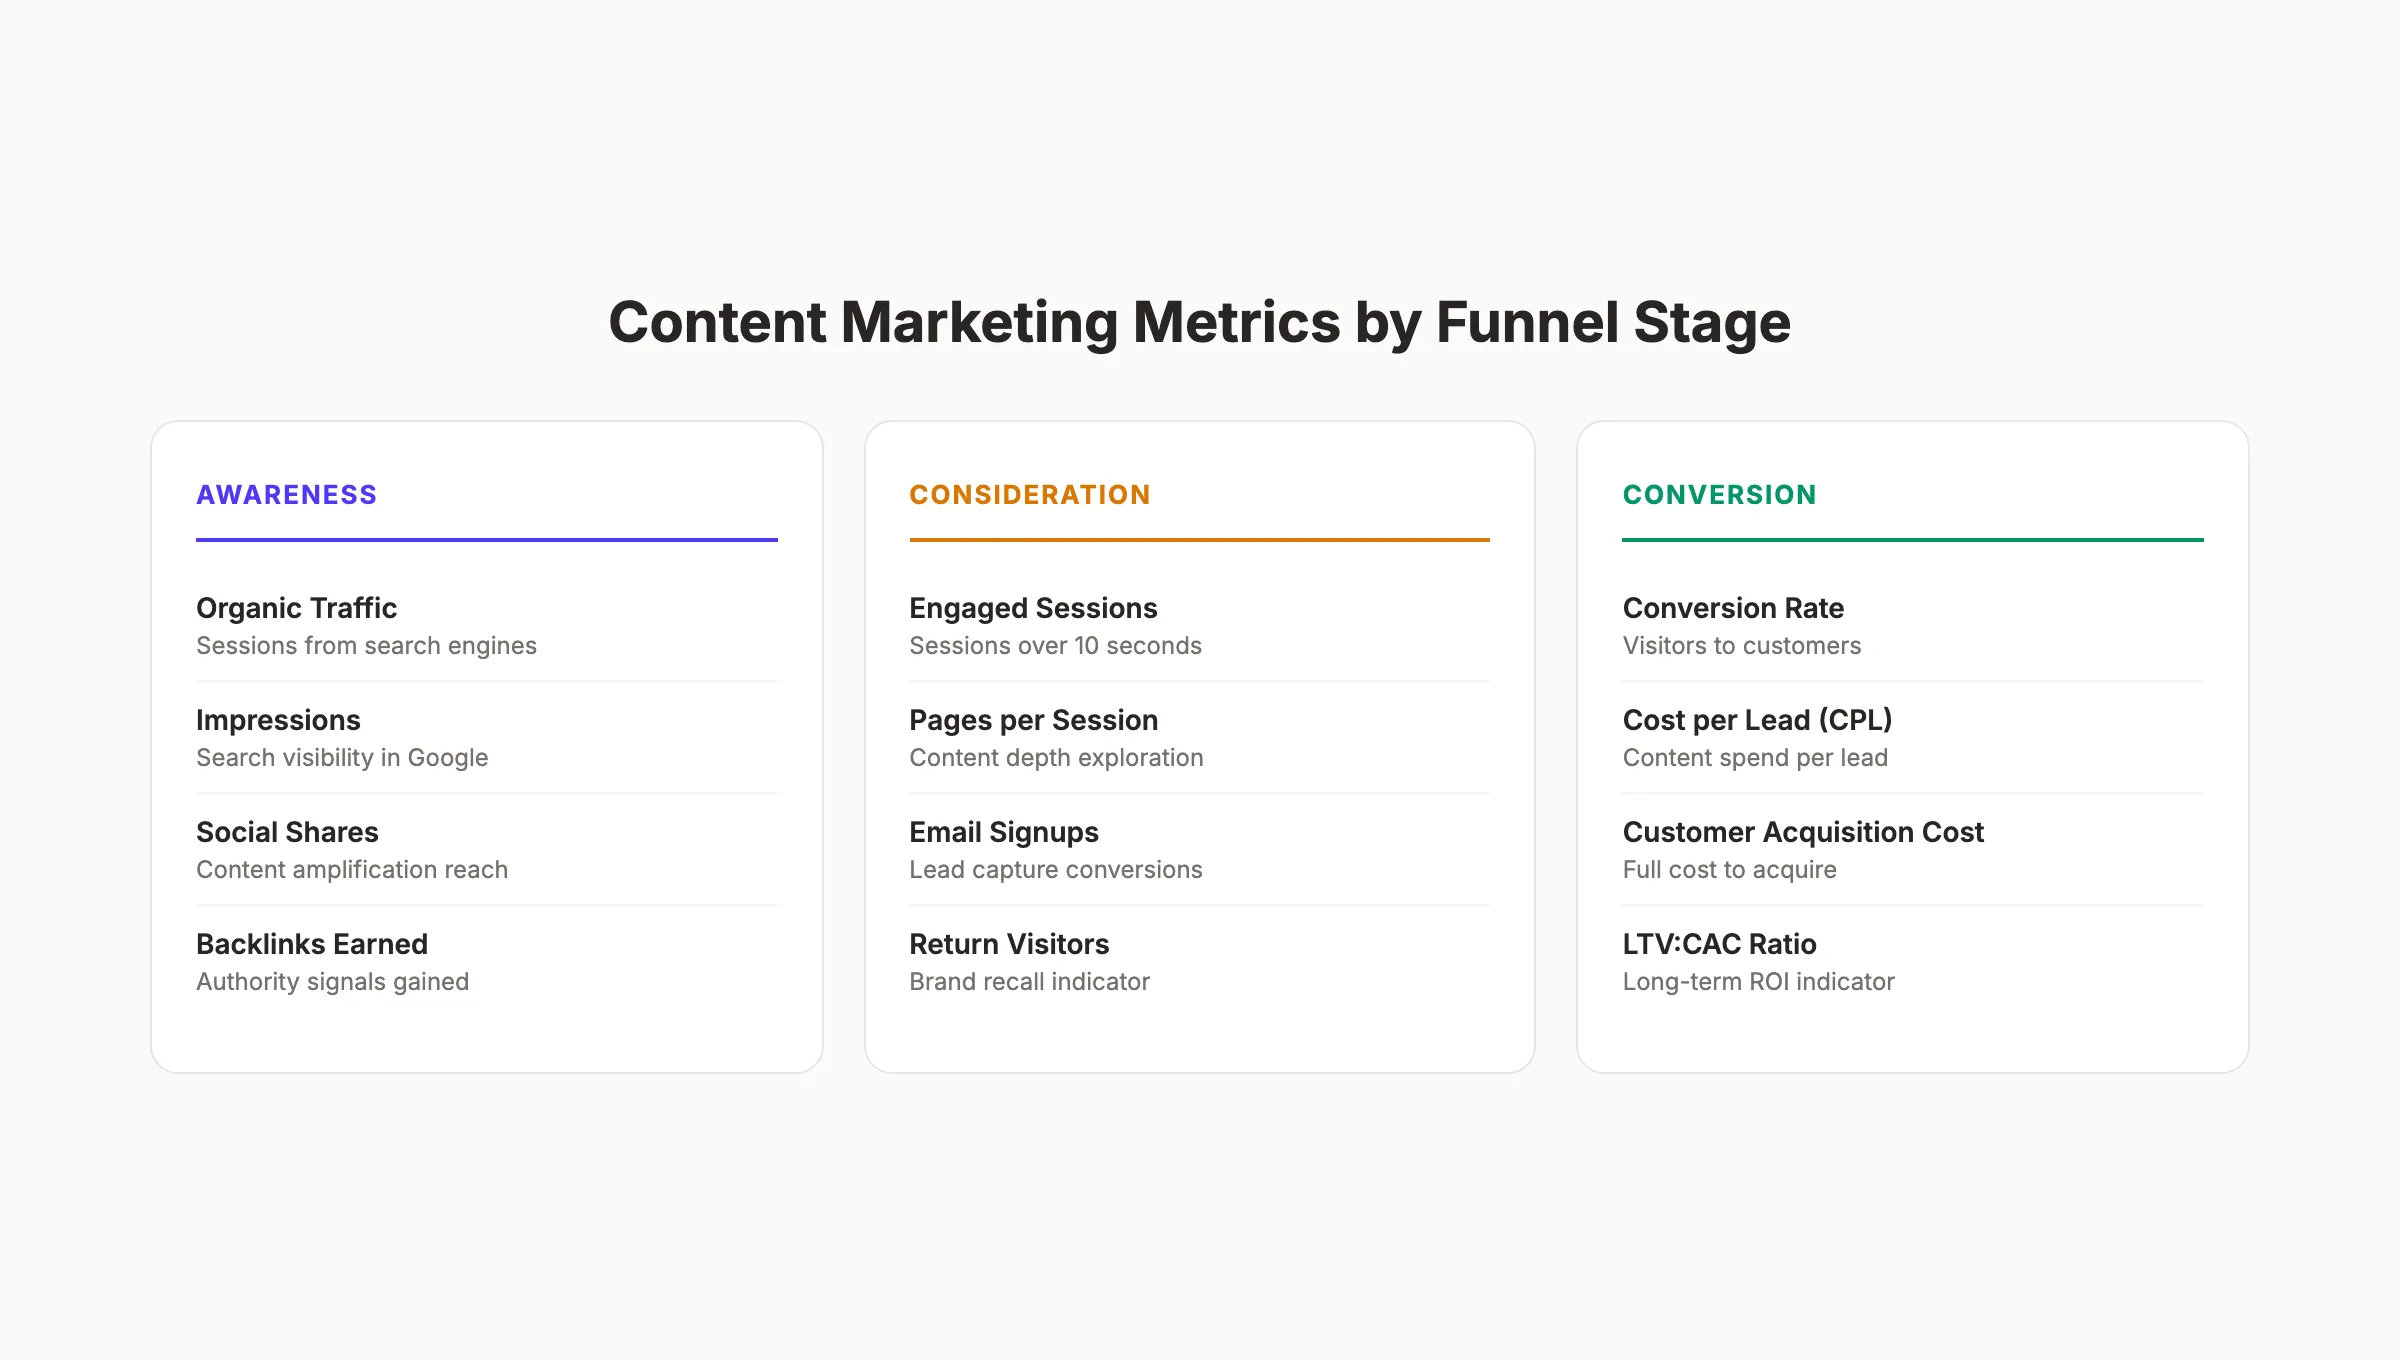
Awareness metrics (top of funnel):
| Metric | Where to Find It | What “Good” Looks Like |
|---|---|---|
| Organic sessions | GA4 > Acquisition | 10%+ month-over-month growth |
| Search impressions | GSC > Performance | Trending upward over 90 days |
| Keyword rankings | Ahrefs / Semrush | Top 10 for target keywords |
| Backlinks earned | Ahrefs / GSC | 5+ new referring domains per month |
Engagement metrics (middle of funnel):
| Metric | Where to Find It | What “Good” Looks Like |
|---|---|---|
| Engaged sessions | GA4 > Engagement | 60%+ of total sessions |
| Average engagement time | GA4 > Pages | 2+ minutes for long-form content |
| Pages per session | GA4 > Engagement | 1.8+ pages |
| Scroll depth | GA4 > Events | 75%+ on key pages |
The mistake most teams make is reporting these metrics in isolation. A blog post with 10,000 pageviews and zero conversions has a different story than one with 500 pageviews and 25 leads.
Always pair traffic metrics with conversion data. That connection is what separates vanity reporting from ROI measurement.
Your organic click-through rates directly impact how much traffic each ranking position delivers. Position 1 gets roughly 10x the clicks of position 10.
We publish 30+ SEO articles per month for businesses like yours. Every post targets specific keywords and tracks performance automatically. Start for $1 →
Step 5: Track Lead Generation and Conversions
This is where content connects to revenue. Every lead generated through content is a data point in your ROI calculation.
Set up tracking for each conversion type:
Email signups: Use GA4 events triggered on form submission. Assign a value based on your email-to-customer conversion rate. If 5% of email subscribers become customers worth $1,000 each, one signup is worth $50.
Demo requests and contact forms: These are high-intent conversions. Track them as GA4 key events with a dollar value matching your average deal size multiplied by close rate.
Content downloads: Gate high-value content (templates, reports, toolkits) behind an email form. Track downloads as conversions.
Free trial starts: If your business offers trials, track the content path that leads to trial activation.
Here is the conversion value formula:
Conversion Value = Average Customer Value x Conversion-to-Customer Rate
| Conversion Type | Avg Customer Value | Conv-to-Customer Rate | Value per Conversion |
|---|---|---|---|
| Email signup | $1,000 | 5% | $50 |
| Demo request | $5,000 | 20% | $1,000 |
| Free trial | $1,200 | 15% | $180 |
| Content download | $1,000 | 3% | $30 |
Once you assign values, GA4 calculates the total revenue generated by each piece of content automatically.
Why this step matters: Lead tracking transforms content from a cost center into a revenue driver. Without it, content teams fight for budget every quarter.
The quality of leads depends heavily on search intent. Bottom-of-funnel content (“best X for Y” posts) converts at 3 to 5x the rate of top-of-funnel educational posts.
Step 6: Calculate Revenue Attribution
Revenue attribution connects the final dot: which content pieces actually contributed to closed deals?
There are 3 attribution models worth considering:
First-touch attribution credits the first content a buyer consumed. Use this to understand which content brings new prospects into your funnel.
Last-touch attribution credits the final content before conversion. Use this to identify which content closes deals.
Multi-touch attribution distributes credit across every content touchpoint. This is the most accurate for understanding the full buyer journey. GA4 uses this by default.
For B2B companies with longer sales cycles, connect GA4 to your CRM:
- Pass UTM parameters and GA4 client ID into form hidden fields
- Match content touchpoints to CRM deal records
- Run reports on “content-influenced pipeline”
A practical approach: tag every closed deal in your CRM with the content pieces the buyer consumed before converting. Then sum the revenue from all content-influenced deals.
Pipeline influence is often more useful than direct attribution. A buyer might read 7 blog posts over 3 months before requesting a demo. Multi-touch attribution captures that journey.
According to research from HubSpot, companies with documented content strategies achieve 33% higher returns than those without. Documentation forces you to track attribution from day one.
Use your content audit to identify which existing pages drive the most revenue. Double down on what works.
Step 7: Build a Content ROI Dashboard
A dashboard turns raw data into decisions. Build one in Looker Studio (free) connected to GA4 and your CRM.
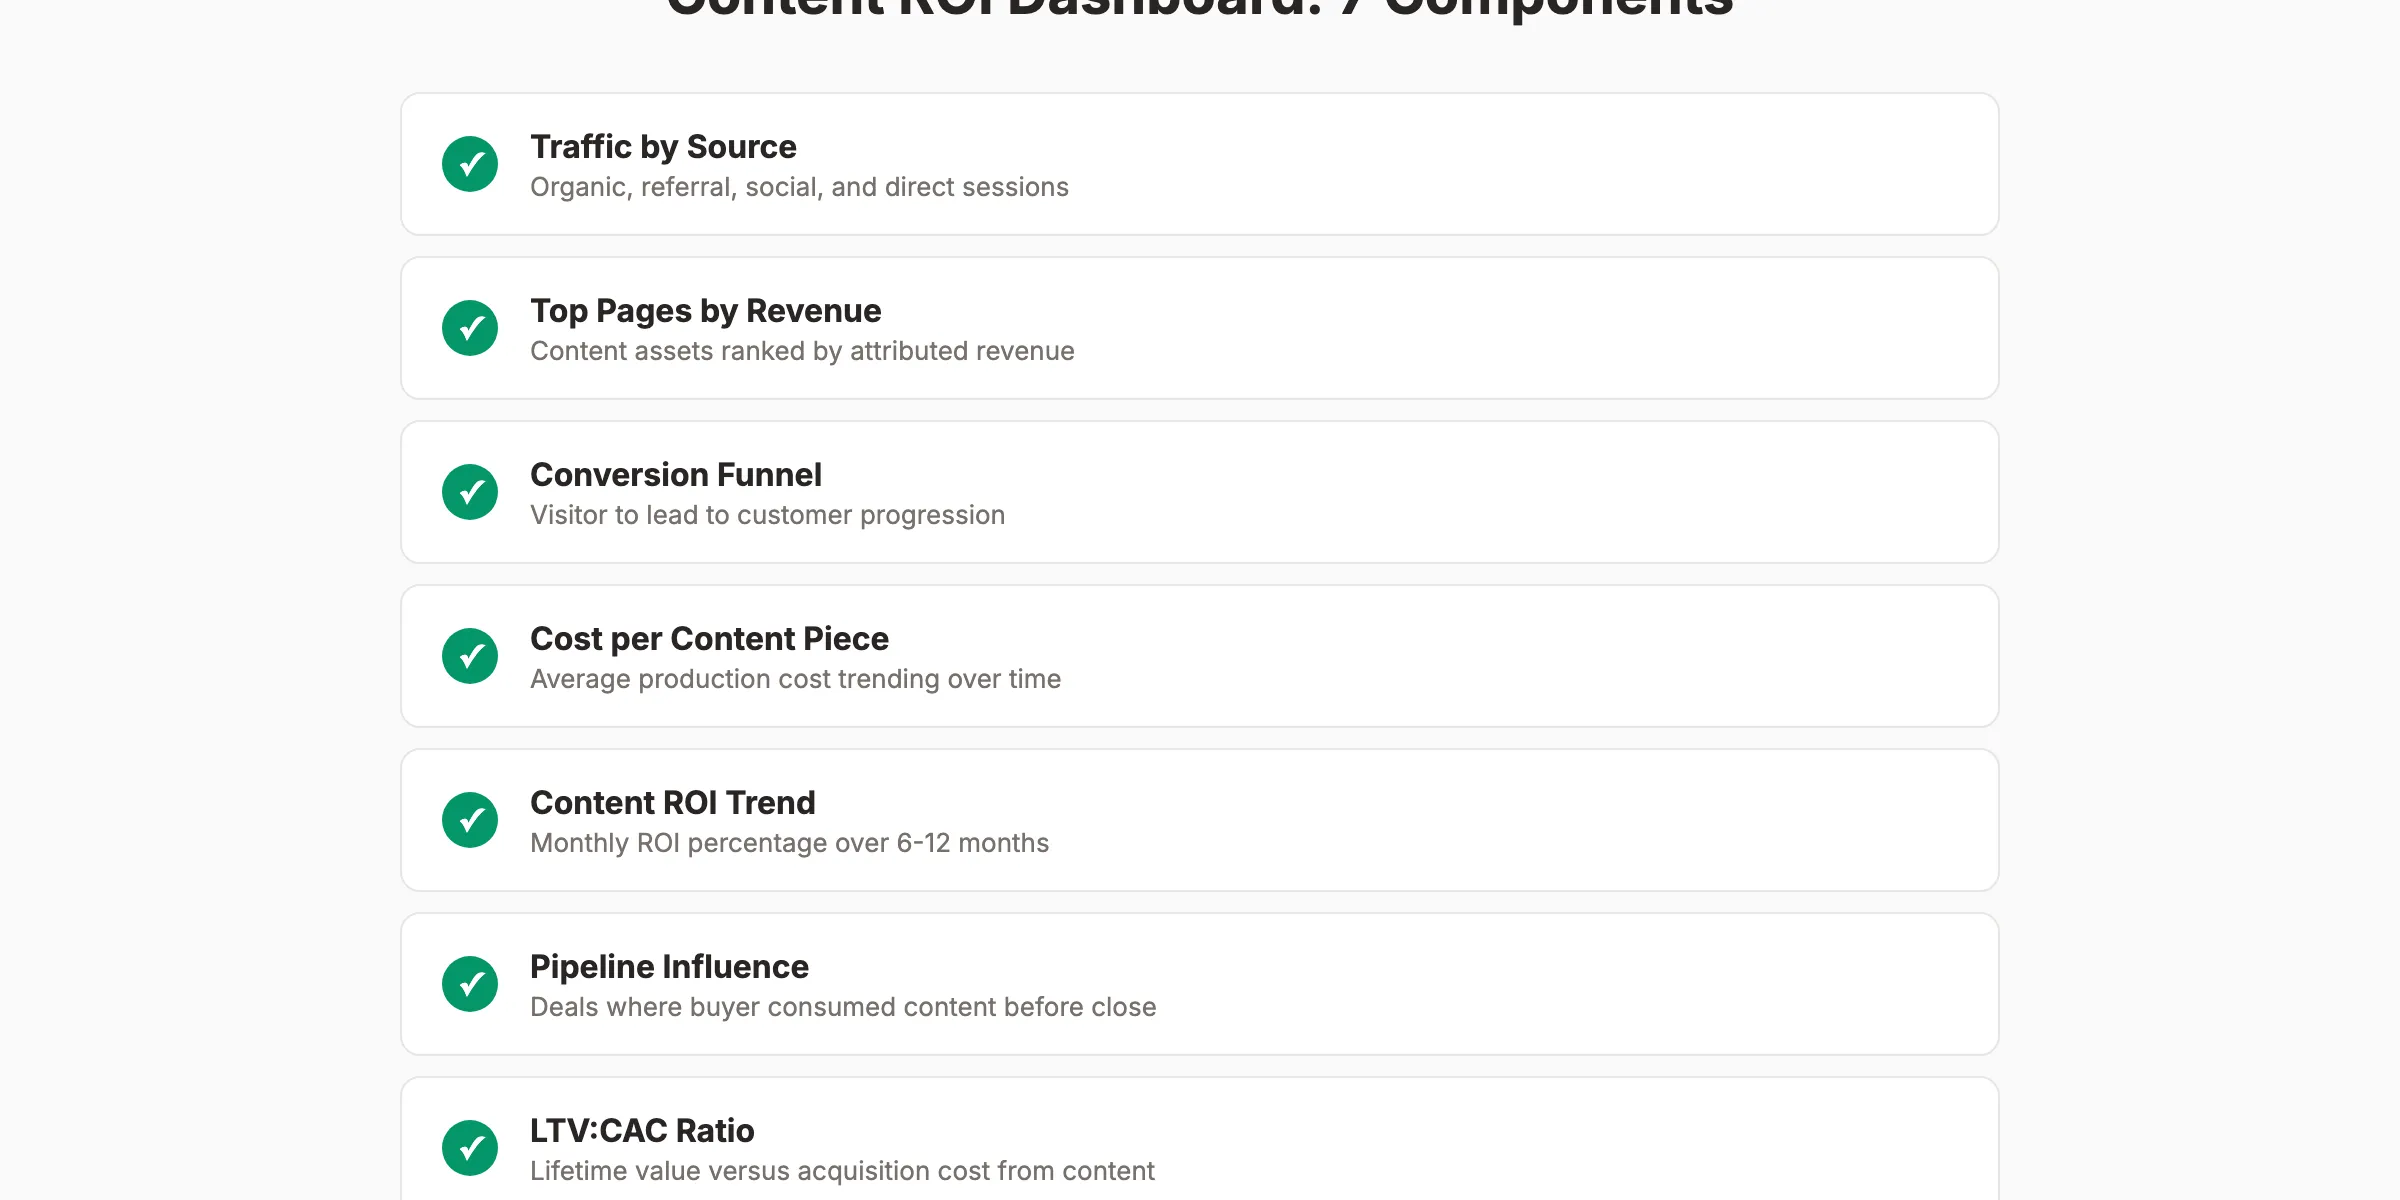
Your dashboard needs 7 components:
-
Traffic by source. Organic, referral, social, direct, and email sessions. Filter to content pages only.
-
Top pages by revenue. Rank your content assets by attributed revenue. This shows which topics and formats drive the most money.
-
Conversion funnel. Visualize the path from visitor to lead to customer. Identify where people drop off.
-
Cost per content piece. Track your average production cost over time. This number should decrease as you optimize your process.
-
Content ROI trend. Plot monthly ROI percentage over 6 to 12 months. Content ROI should increase over time as posts compound.
-
Pipeline influence. Show deals where the buyer consumed content before purchase. This is often 5 to 10x larger than direct attribution.
-
LTV:CAC ratio. Lifetime value divided by customer acquisition cost from content. A healthy ratio is 3:1 or better.
Reporting cadence:
| Report | Frequency | Audience |
|---|---|---|
| Traffic and engagement | Weekly | Content team |
| Lead and conversion metrics | Bi-weekly | Marketing leadership |
| Full ROI report | Monthly | Executive team |
| Strategic content review | Quarterly | C-suite |
Pro tip: Include the ROI trend chart in every executive report. A line going up and to the right is the most persuasive argument for continued content investment.
The data from your dashboard also feeds your keyword research process. Double down on topics that generate revenue, not just traffic.
Done-for-you content that drives measurable results. We handle writing, publishing, and SEO optimization for 30+ articles per month. Start for $1 →
Step 8: Report, Optimize, Repeat
Measurement is not a one-time project. It is a monthly discipline.
Monthly reporting rhythm:
- Pull ROI numbers from your dashboard
- Identify the top 5 and bottom 5 content pieces by revenue
- Analyze what the top performers have in common (topic, format, length, keyword intent)
- Update or remove underperformers (see our guide on fixing content decay)
- Adjust your content calendar based on what the data shows
Optimization actions by scenario:
| Scenario | Action |
|---|---|
| High traffic, low conversions | Add CTAs, improve offer, test lead magnets |
| Low traffic, high conversion rate | Build backlinks, optimize for more keywords |
| Declining traffic on old posts | Update content, refresh data, re-optimize |
| High cost per piece, low ROI | Streamline production, use templates, automate |
The compounding effect of content means your ROI should improve each quarter. Blog posts published 6 months ago start ranking higher. Internal links pass authority to new posts. Your domain builds topical authority.
This is what we call the Content Compound Effect. Every article stacks on the last. The 30th blog post performs better than the first because of the 29 that came before it.
Understanding how long SEO takes sets realistic expectations. Most content programs need 3 to 6 months before ROI turns positive.
Why this step matters: Teams that review and optimize monthly see 2x the ROI of teams that publish and forget. The feedback loop is the system.
Content Marketing ROI Benchmarks by Industry
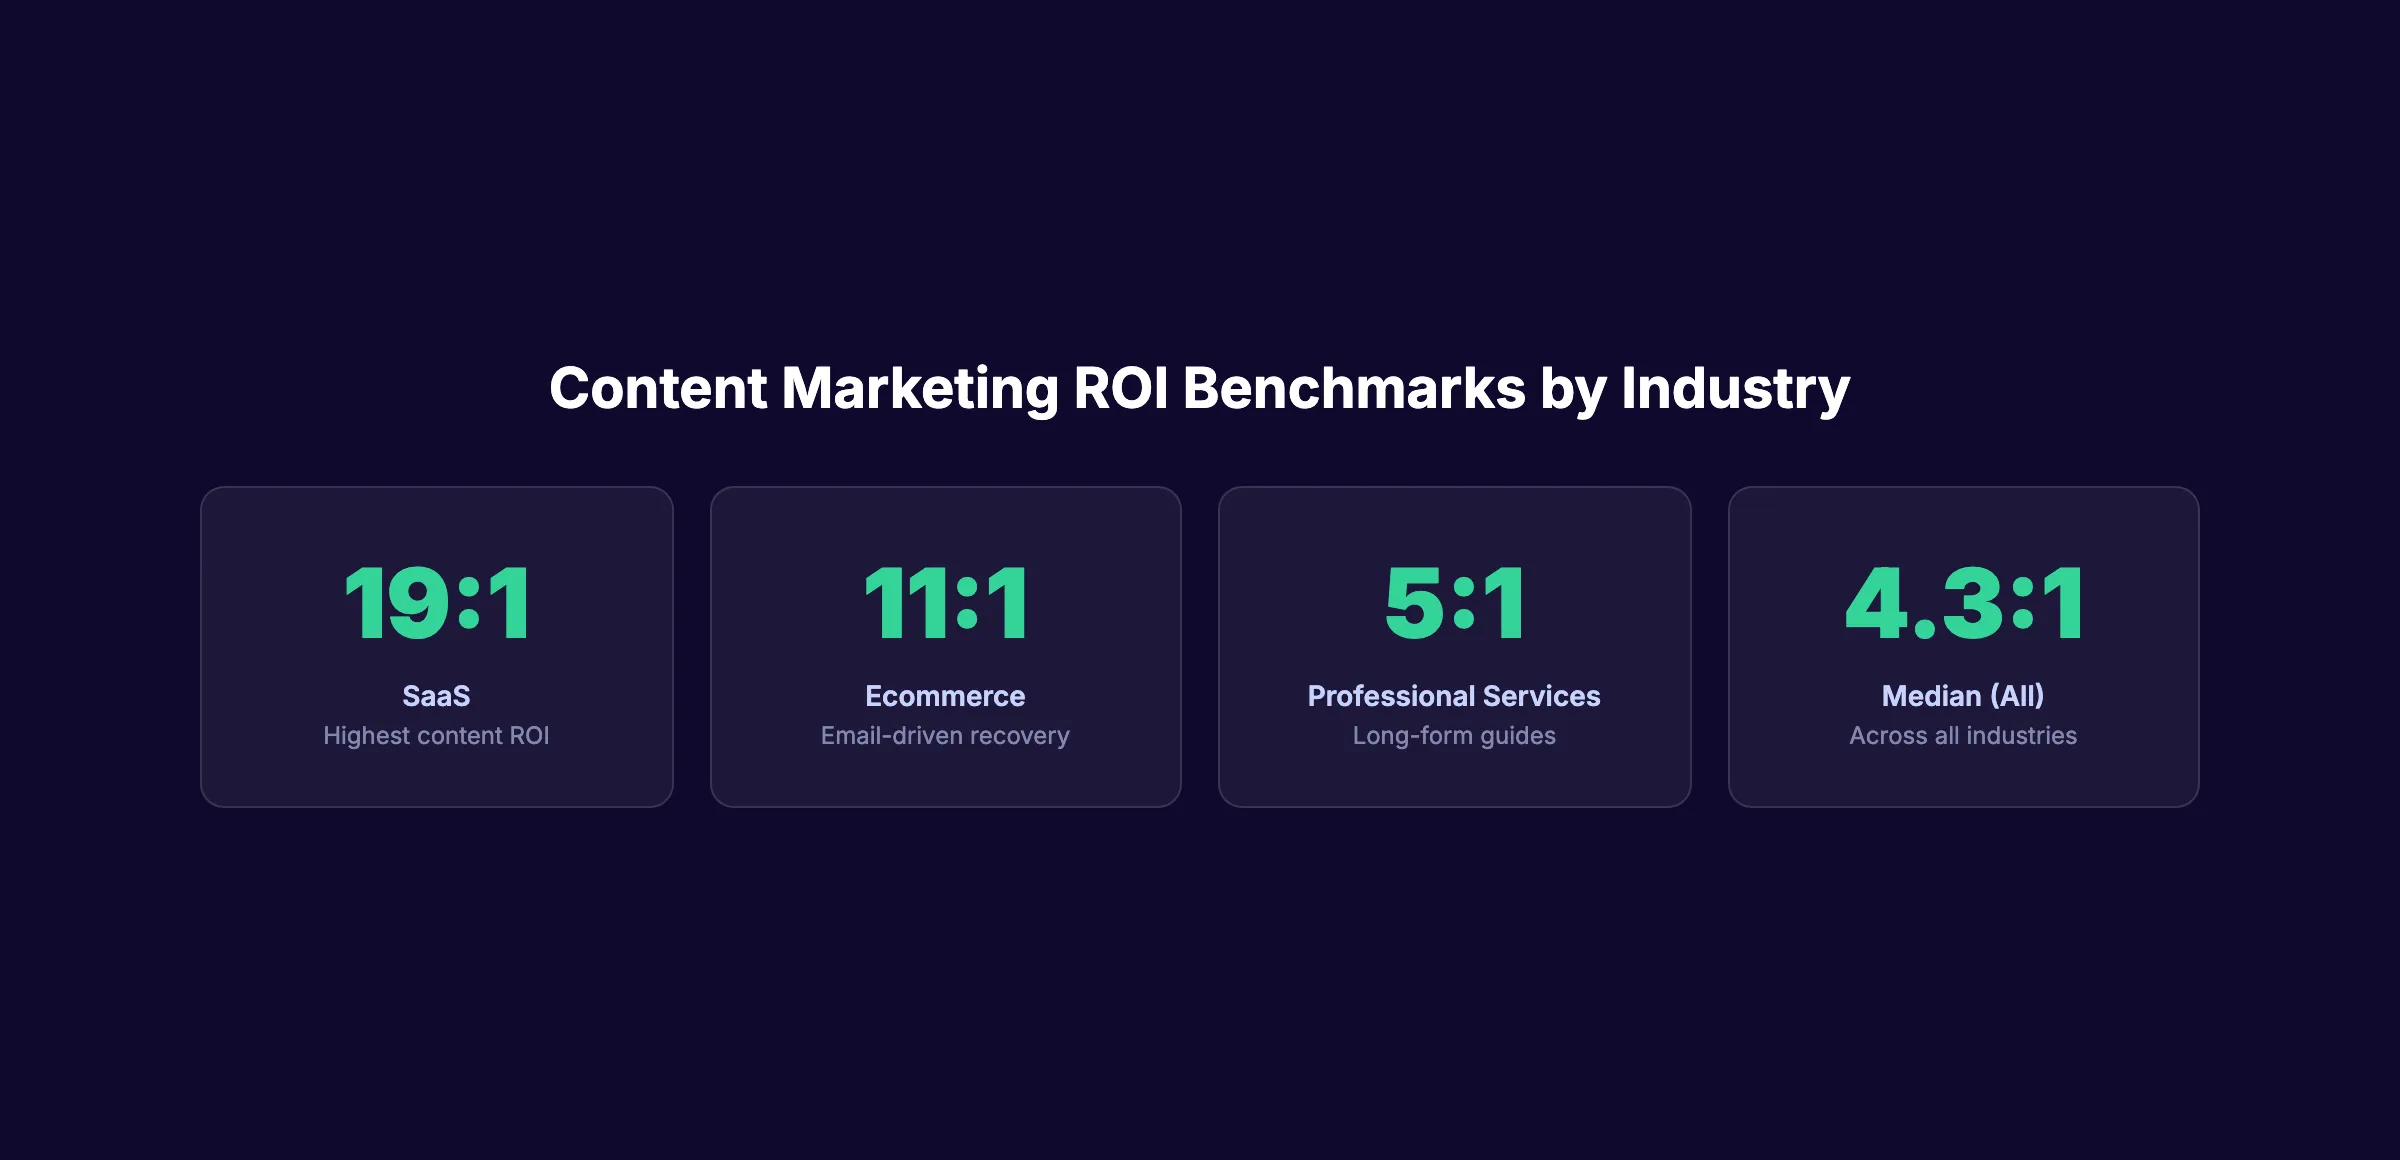
Knowing your ROI number is useful. Knowing how it compares to industry standards is actionable.
| Industry | Average Content ROI | Key Driver |
|---|---|---|
| SaaS | 19:1 | Long-form guides that nurture trial signups |
| Ecommerce | 11:1 | Email content and cart recovery sequences |
| Professional services | 5:1 | Authority content that generates consultations |
| Healthcare | 4:1 | Educational content building patient trust |
| Median (all industries) | 4.3:1 | Varies by content maturity |
The SaaS industry leads because software companies have high customer lifetime values and low marginal costs. A single blog post that generates 1 enterprise deal can return 50x its production cost.
For local service businesses, ROI often appears lower because deal sizes are smaller. But the cost of content is also lower. A dental practice publishing SEO-optimized blog posts at $99 per month that generates 2 new patients worth $3,000 each sees a 60:1 return.
Review the latest content marketing statistics for updated benchmarks and trends.
Common Mistakes When Measuring Content ROI
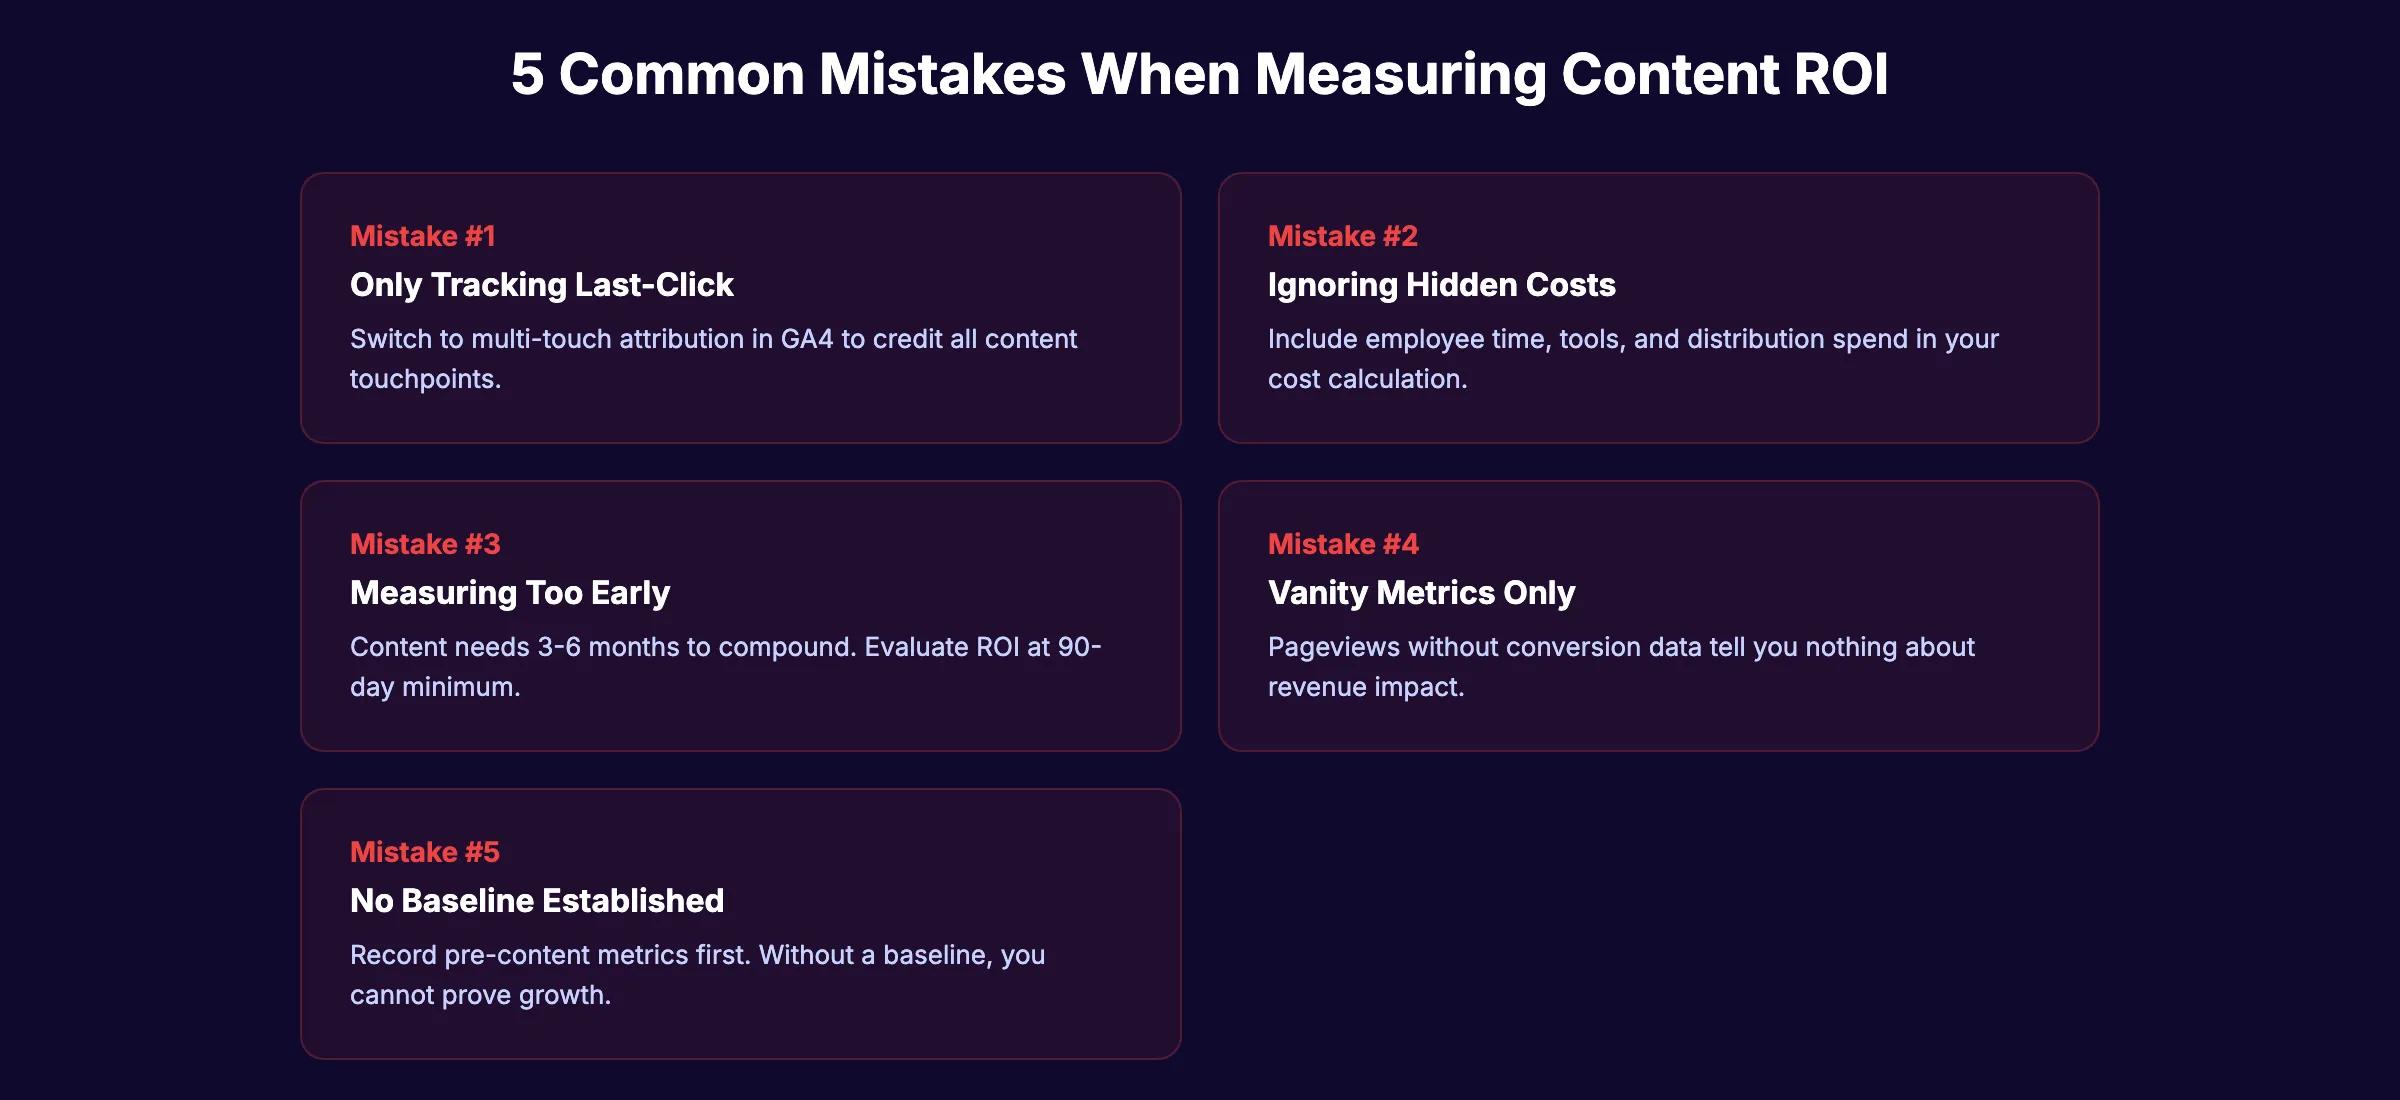
After working with hundreds of content programs, these are the 5 errors we see most often.
1. Only tracking last-click attribution. A buyer reads 7 articles before converting. Last-click gives credit to only the final one. Switch to multi-touch attribution in GA4.
2. Ignoring hidden costs. Employee time is a cost. Your SEO tool subscription is a cost. That 2-hour approval meeting is a cost. Count everything.
3. Measuring too early. Blog content needs 3 to 6 months to rank and generate consistent traffic. Evaluating ROI at 30 days produces misleading results. Set a 90-day minimum measurement window.
4. Reporting vanity metrics only. Pageviews and social shares feel good but say nothing about revenue. Always pair traffic metrics with conversion and revenue data.
5. No baseline established. You need pre-content benchmarks to prove growth. Record your traffic, leads, and revenue before launching a content program. Without a baseline, you cannot calculate lift.
The teams that avoid these mistakes measure ROI accurately, defend their budgets, and scale their programs. The teams that do not lose funding to paid ads.
Looking at SEO statistics shows that organic search drives 53% of all website traffic. That is a channel worth measuring correctly.
Frequently Asked Questions
What is a good ROI for content marketing?
The median content marketing ROI across all industries is 4.3:1. That means $4.30 returned for every $1 invested. SaaS companies see up to 19:1. Any positive ROI above 3:1 indicates a healthy program. New programs should target break-even within 6 months and 3:1 or better by month 12.
How long does it take to see ROI from content marketing?
Most content programs take 3 to 6 months to show positive ROI. SEO content needs time to index, rank, and generate consistent organic traffic. Paid distribution can accelerate early results, but organic compounding is where the real returns come from. Track leading indicators (traffic, engagement) weekly while waiting for lagging indicators (revenue, ROI) to materialize.
Which metrics should I track to measure content marketing ROI?
Track metrics across the full funnel. Awareness: organic traffic, impressions, and keyword rankings. Consideration: engaged sessions, pages per session, and email signups. Conversion: conversion rate, cost per lead, customer acquisition cost, and LTV:CAC ratio. The most important single metric is revenue attributed to content through multi-touch attribution.
How do I measure content ROI without a CRM?
Use GA4 conversion events with assigned monetary values. Track form submissions, email signups, and purchase completions. Assign a value to each based on your average customer value multiplied by conversion rate. This approach gives you an estimated ROI without needing full CRM integration. It is less precise than CRM-connected attribution but far better than no measurement at all.
Does content marketing ROI improve over time?
Yes. Content marketing ROI compounds. A blog post costs money once to produce but generates traffic and leads for years. As your content library grows, internal links strengthen, domain authority increases, and new posts rank faster. Most programs see ROI double between month 6 and month 12. This is the Content Compound Effect in action. Consistent publishing at scale makes every article more effective than the last.
How do I prove content marketing ROI to my CEO?
Build a monthly dashboard showing 3 numbers: total content cost, total revenue attributed to content, and the ROI percentage. Include a trend line showing ROI growth over time. Tie content performance to pipeline influence (deals where buyers consumed content). CEOs respond to revenue data, not traffic charts. Present content as a compounding investment, not a monthly expense.
Start Measuring Content ROI Today
The difference between content teams that thrive and ones that get cut is measurement. Follow these 8 steps. Build the dashboard. Report the numbers monthly.
Content marketing delivers the highest ROI of any digital channel when you track it properly. The formula is simple. The discipline of measuring it every month is what separates programs that scale from programs that get canceled.
Let Stacc handle the content. You track the ROI. We publish 30+ SEO blog posts per month so you can focus on measuring results. Start for $1 →
Related Tools & Resources
Free SEO Tools:
Best Lists:

Written by
Siddharth GangalSiddharth is the founder of theStacc and Arka360, and a graduate of IIT Mandi. He spent years watching great businesses lose organic traffic to competitors who simply published more. So he built a system to fix that. He writes about SEO, content at scale, and the tactics that actually move rankings.
30 SEO blog articles published every month
Keyword-optimized, scheduled, and live on your site. Automatically.
30-day trial · Cancel anytime
theStacc
Stop writing SEO content manually
30 blog articles, 30 GBP posts, and social media content. Published every month. Automatically.
Start Your $1 Trial$1 for 3 days · Cancel anytime