40 Ecommerce Statistics for 2026 (Revenue + SEO)
40 ecommerce statistics for 2026 covering revenue, mobile, cart abandonment, SEO, and social commerce. All sourced and verified. Updated March 2026.
Siddharth Gangal • 2026-03-30 • SEO Tips
In This Article
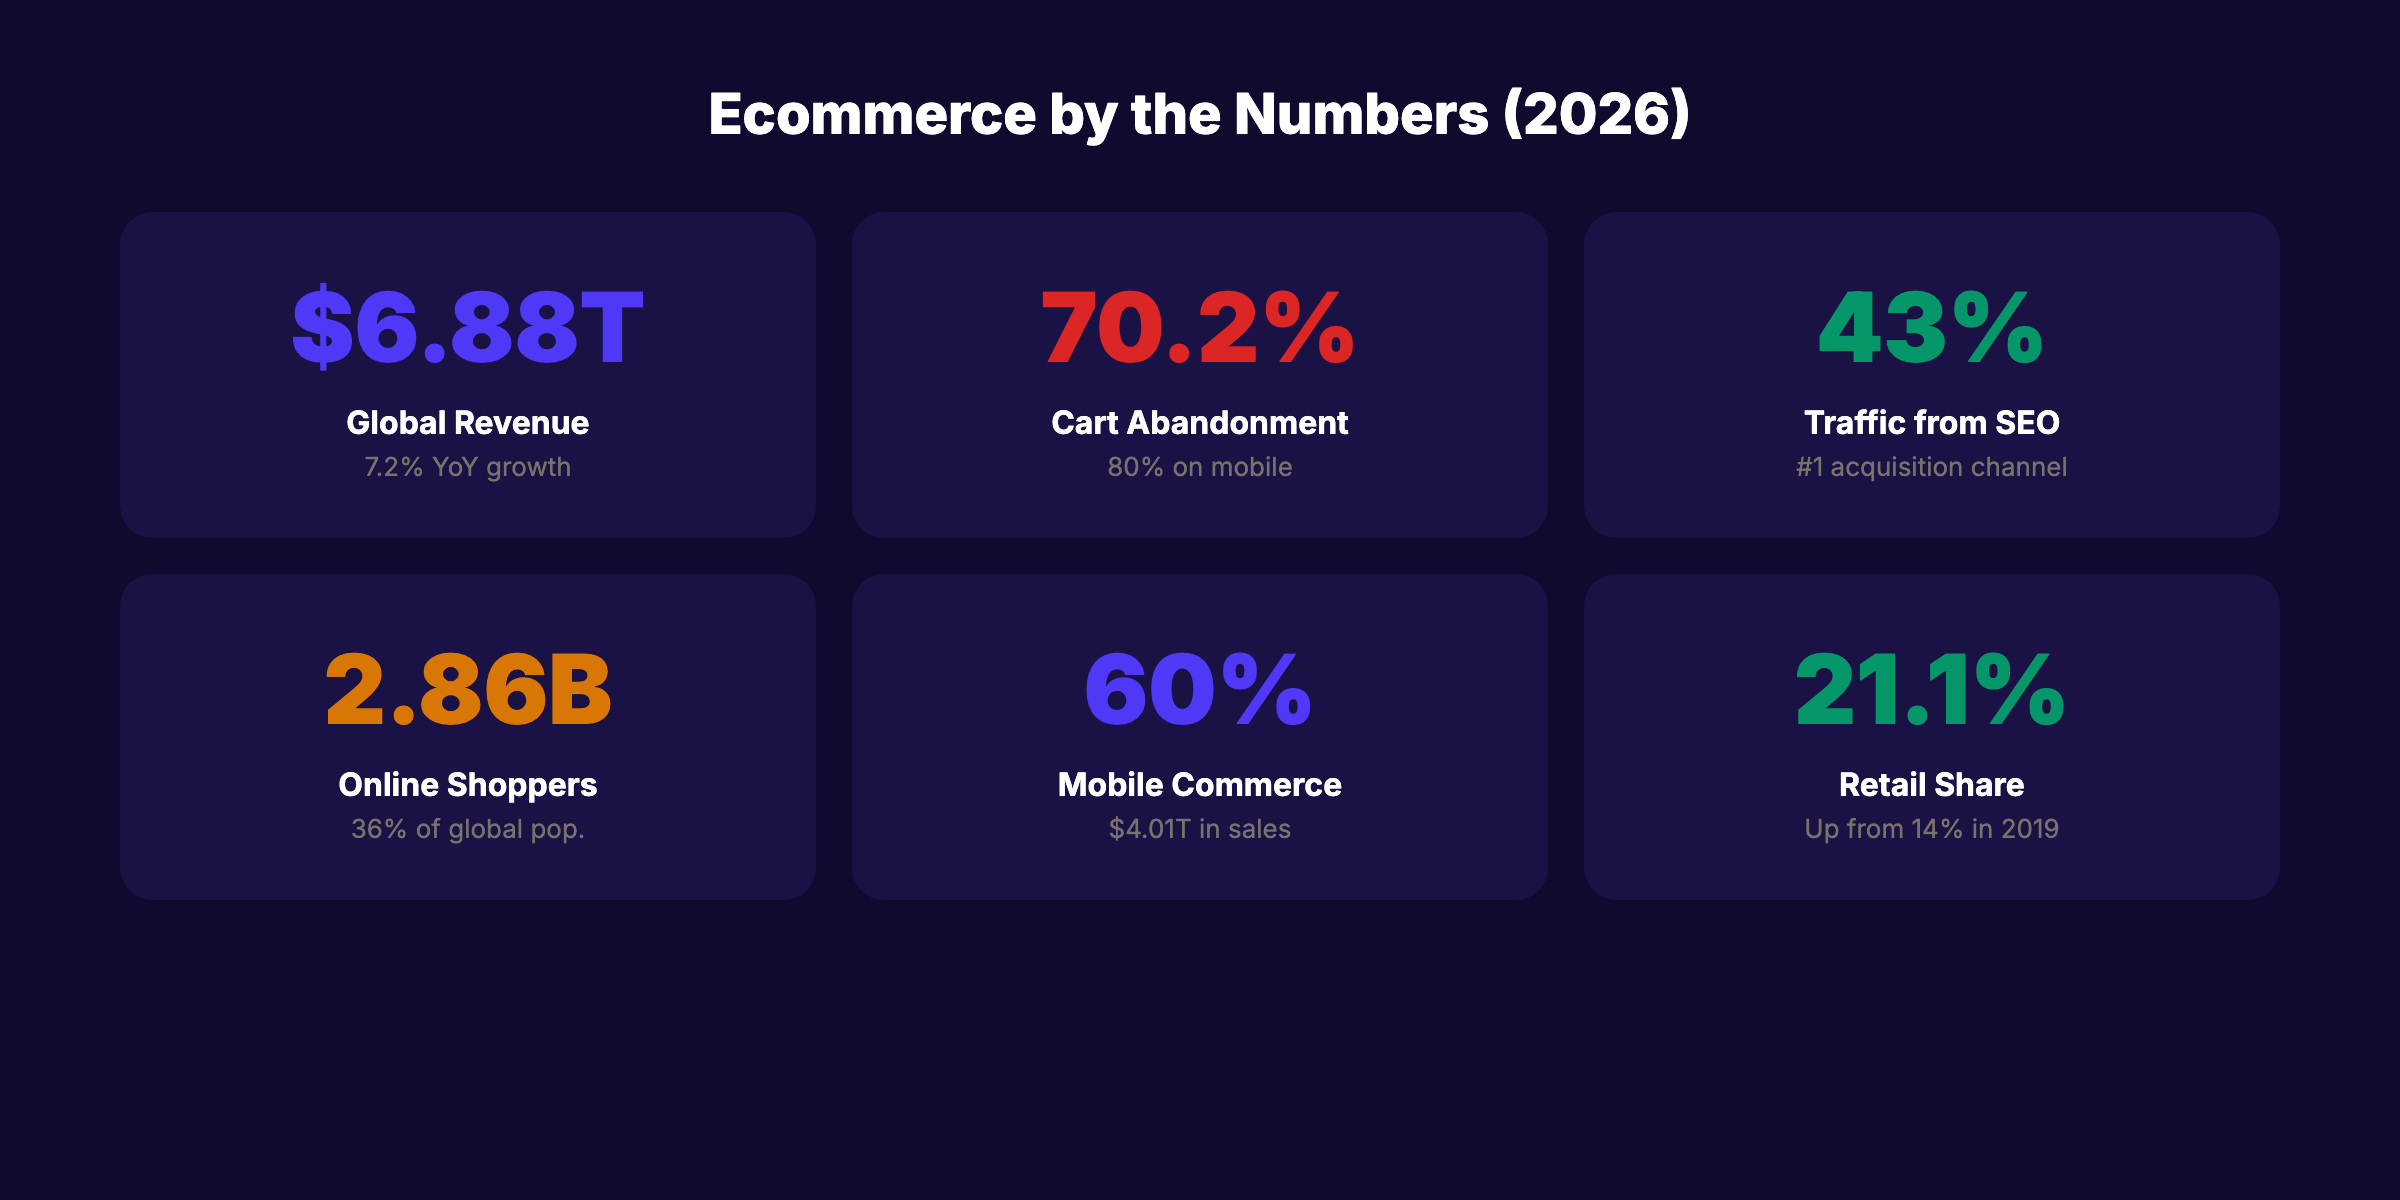
Global ecommerce revenue will reach $6.88 trillion in 2026. That is a 7.2% increase from 2025. Over 2.86 billion people will buy something online this year. Ecommerce now accounts for 21.1% of all retail sales worldwide.
Ecommerce statistics tell you where money is moving, where customers are shopping, and where the growth opportunities are. Whether you run an online store or market for one, these numbers shape strategy.
We compiled 40 ecommerce statistics from Statista, Shopify, Baymard Institute, and other primary sources. Every stat includes the source and year.
Here is what the data covers:
- Global ecommerce revenue, growth, and market share
- Mobile commerce and device-specific conversion data
- Cart abandonment rates and recovery potential
- Ecommerce SEO traffic and ranking statistics
- Social commerce and AI adoption numbers
Global Ecommerce Revenue Statistics
1. Global ecommerce sales will reach $6.88 trillion in 2026. (Source: Statista, 2026) That represents a 7.2% increase over the $6.42 trillion recorded in 2025.
2. Ecommerce accounts for 21.1% of total global retail sales in 2026. (Source: Shopify, 2026) The remaining 78.9% happens in physical stores. The gap is closing every year.
3. US ecommerce hit $1.23 trillion in 2025. (Source: US Department of Commerce, 2025) Online sales made up 16.4% of total US retail spending. The US trails the global average in ecommerce penetration.
4. Asia-Pacific commands 41.7% of global ecommerce sales. (Source: Statista, 2025) The Americas hold 37.4%. Europe accounts for 18.4%. Asia-Pacific leads due to China, India, and Southeast Asian mobile-first markets.
5. Cross-border ecommerce sales reached $2.4 trillion in 2025. (Source: Shopify, 2025) International transactions are growing faster than domestic ones. Currency, shipping, and localization remain the biggest barriers.
6. Global ecommerce is projected to hit $7.38 trillion by 2027. (Source: Statista, 2026) The compound annual growth rate of 7-8% shows no signs of slowing through the end of the decade.
7. Over 2.86 billion people will shop online in 2026. (Source: Statista, 2026) That represents roughly 36% of the global population. In 2025, the number was 2.77 billion.
Mobile Commerce Statistics
8. Mobile commerce will account for $4.01 trillion in 2026. (Source: Statista, 2026) That is nearly 60% of all ecommerce revenue generated on mobile devices.
9. 75% of ecommerce website traffic comes from mobile devices. (Source: SeoProfy, 2025) Mobile dominates traffic. But it does not dominate conversions. The gap is the biggest revenue opportunity in ecommerce.
10. Mobile converts at roughly half the rate of desktop. (Source: Baymard Institute, 2025) Desktop peak conversion sits around 7%. Mobile peaks at 3.5%. Smaller screens, harder product comparison, and more casual browsing drive the gap.
11. 68% of US ecommerce traffic comes from mobile. (Source: Charle Agency, 2025) Mobile SEO optimization is no longer optional. It is the primary channel for product discovery.
12. 57% of global ecommerce sales happened on mobile in 2024. (Source: Shopify, 2025) This number is trending toward 60%+ in 2026 as mobile payment systems (Apple Pay, Google Pay) reduce checkout friction.
13. Mobile users spend 2.3x more time browsing than desktop users. (Source: Flowlu, 2025) More browsing time does not equal more purchasing. Optimizing the mobile purchase path is the highest-ROI investment for most stores.
Stop writing. Start ranking. Stacc publishes 30 SEO articles per month for $99. Start for $1 →
Cart Abandonment Statistics
14. The global shopping cart abandonment rate is 70.22%. (Source: Baymard Institute, 2026) 7 out of 10 shoppers who add items to their cart leave without buying. This has remained remarkably consistent for over a decade.
15. Mobile cart abandonment reaches 80.02%. (Source: Baymard Institute, 2026) Desktop abandonment sits at 66.41%. Tablets land at 68.84%. Mobile is the leakiest part of the funnel.
16. $260 billion in lost orders are recoverable through better checkout UX. (Source: Baymard Institute, 2026) Based on US and EU ecommerce sales of $738 billion, Baymard calculates that checkout improvements could recover over a third of abandoned carts.
17. Fixing checkout UX issues can increase conversions by 35.26%. (Source: Baymard Institute, 2026) This figure comes from 10 years of large-scale A/B testing. The fixes are not complex. Simpler forms, guest checkout, and transparent shipping costs are the biggest wins.
18. 48% of consumers abandon carts due to extra costs (shipping, taxes, fees). (Source: Baymard Institute, 2025) Unexpected costs at checkout kill conversions more than any other factor. Showing total cost upfront reduces abandonment significantly.
19. 26% of shoppers abandon because the site requires account creation. (Source: Baymard Institute, 2025) Guest checkout is not a nice-to-have. It is a conversion requirement.
20. Cart abandonment emails recover 3-5% of lost sales. (Source: Ringly.io, 2026) Automated recovery emails sent within 1 hour of abandonment perform best. Three-email sequences outperform single sends.
Ecommerce SEO Statistics
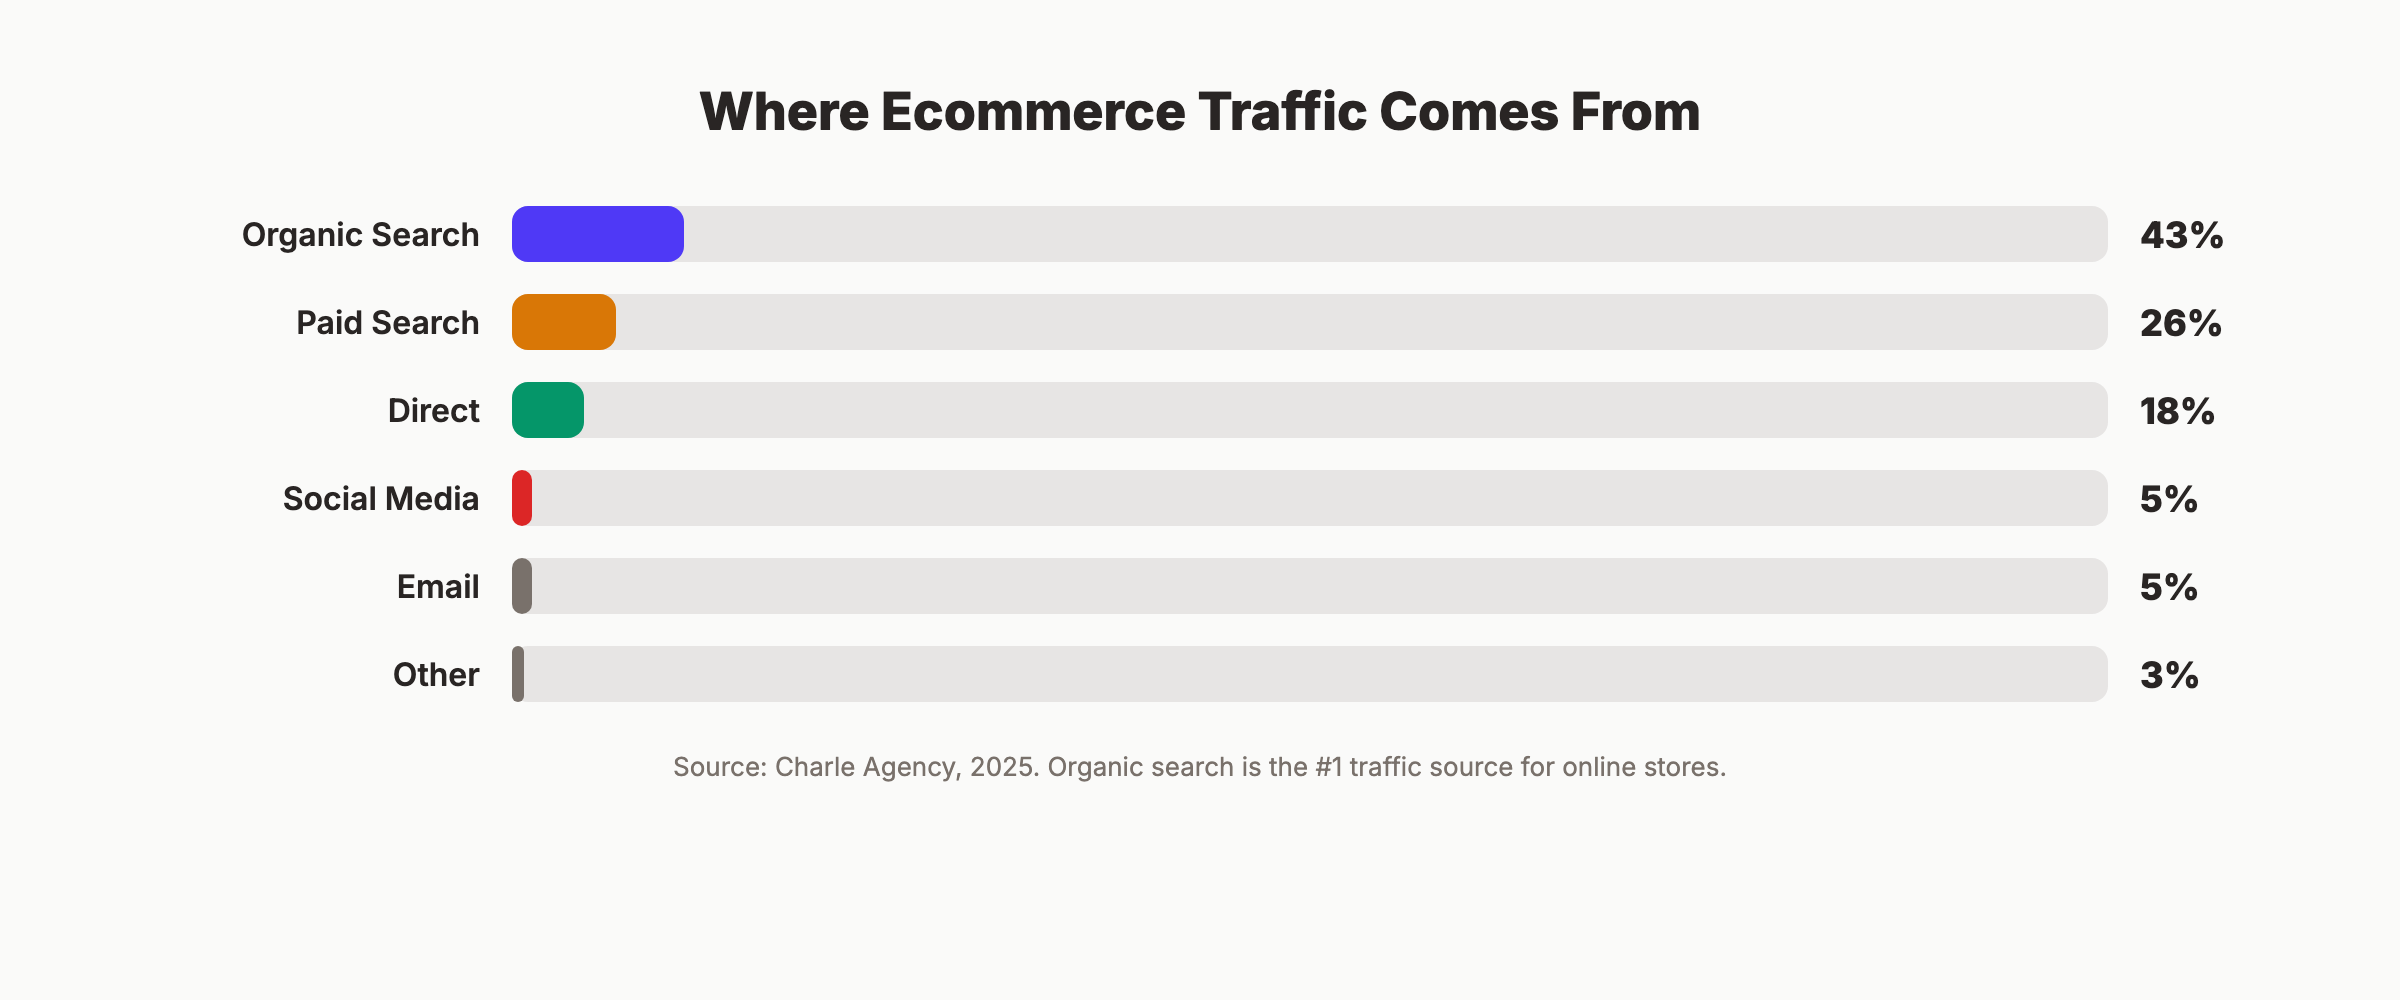
21. Organic search drives 43% of all ecommerce traffic. (Source: Charle Agency, 2025) Search is the single largest traffic source for online stores. Paid ads, social, and email trail behind. For more data, see our SEO statistics roundup.
22. Organic search generates 23.6% of ecommerce orders. (Source: Charle Agency, 2025) Nearly 1 in 4 online purchases starts with an organic Google search. That makes ecommerce SEO one of the highest-ROI marketing channels.
23. 68% of US online shoppers search Google before purchasing. (Source: Taylor Scher SEO, 2025) Even when shoppers plan to buy from a specific store, they search Google first. Ranking for product and category keywords captures this behavior.
24. The average ecommerce brand ranks for 1,783 keywords organically. (Source: Reboot Online, 2025) Those rankings drive an estimated 9,625 organic visits per month. Increasing keyword coverage is the most predictable way to grow organic traffic.
25. 86% of ecommerce brands lack optimized internal links. (Source: Charle Agency, 2025) Even 41% of high-visibility ecommerce sites have poor internal linking. Fixing internal link architecture is one of the fastest SEO wins.
26. Pages with schema markup get 20-40% higher click-through rates. (Source: Charle Agency, 2025) Product schema, review schema, and FAQ schema improve visibility in search results. Most ecommerce sites underuse structured data.
27. Organic search traffic converts at 2-4% for ecommerce. (Source: Anchor Group Tech, 2025) Organic visitors have higher purchase intent than social or display traffic. They searched for the product. They are closer to buying.
Your SEO team. $99 per month. 30 optimized articles, published automatically. Start for $1 →
Social Commerce and AI Statistics
28. Social commerce sales exceeded $1.17 trillion globally in 2025. (Source: Shopify, 2025) Social selling through Instagram, TikTok Shop, and Facebook Marketplace is now a trillion-dollar channel.
29. 70% of ecommerce companies will use AI by 2026. (Source: Craftberry, 2026) AI applications include personalized recommendations, demand forecasting, chatbots, and fraud prevention.
30. AI personalization increases ecommerce conversion rates by 10-15%. (Source: Flowlu, 2025) Product recommendations powered by AI account for up to 31% of ecommerce revenue on sites that implement them.
31. Social media drives only 5% of ecommerce traffic. (Source: Charle Agency, 2025) Despite the hype, social media generates 10x less traffic than organic search. SEO remains the dominant acquisition channel.
32. TikTok Shop reached $33 billion in GMV in 2025. (Source: Tekrevol, 2025) TikTok Shop is the fastest-growing social commerce platform. But it primarily serves impulse and low-ticket purchases.
33. Organic CTR dropped 54% for queries with AI Overviews. (Source: SEOFOMO, 2026) CTR fell from 1.41% to 0.64% when AI Overviews appear. The positive news: only 3.2% of shopping queries trigger AI Overviews.
Consumer Behavior Statistics
34. 81% of shoppers research products online before buying. (Source: Tekrevol, 2025) The research phase is where SEO and content marketing capture demand. Blog posts, product comparisons, and review pages influence purchase decisions.
35. Free shipping is the top purchase motivator for 73% of online shoppers. (Source: Flowlu, 2025) Free shipping beats discounts, fast delivery, and product selection as the primary conversion driver.
36. 56% of consumers return to a website after a personalized experience. (Source: Flowlu, 2025) Personalization increases repeat visits. Product recommendations, recently viewed items, and personalized email sequences drive retention.
37. The average ecommerce order value is $131 in the US. (Source: DontPayFull, 2025) Average order value varies significantly by category. Electronics and luxury goods skew higher. Apparel and household items sit below the average.
38. 87% of shoppers read online reviews before purchasing. (Source: Tekrevol, 2025) Reviews directly impact conversion rates. Products with 5+ reviews convert at 270% higher rates than products with zero reviews.
3,500+ blogs published. 92% average SEO score. See what Stacc can do for your site. Start for $1 →
Growth and Future Projections
39. Ecommerce is projected to reach $7.89 trillion by 2028. (Source: Statista, 2026) The 5-year outlook shows consistent 7-8% annual growth. No single market disruption is expected to change this trajectory.
40. By 2027, ecommerce will represent 23%+ of total retail sales. (Source: Statista, 2026) For context, ecommerce was 14% of retail in 2019. The pandemic accelerated online adoption by 3-5 years.
Key Takeaways
- $6.88 trillion — Global ecommerce revenue in 2026 (7.2% growth)
- 70.22% — Average cart abandonment rate (80% on mobile)
- 43% — Share of ecommerce traffic from organic search
- $260 billion — Recoverable lost orders from better checkout UX
- 75% — Ecommerce traffic coming from mobile devices
- 2.86 billion — People shopping online globally in 2026
- 86% — Ecommerce brands with poor internal link optimization
Methodology
Sources: Statista, Shopify, Baymard Institute, US Department of Commerce, Charle Agency, SeoProfy, SEOFOMO, Flowlu, Tekrevol, Craftberry, Reboot Online, Anchor Group Tech, DontPayFull, Ringly.io, Taylor Scher SEO.
Last updated: March 2026
Note: We update this page quarterly to ensure all statistics remain current. Each stat includes its original source and year of publication.
FAQ
What is the most important ecommerce statistic for 2026?
Global ecommerce will reach $6.88 trillion in 2026 with 21.1% of total retail happening online. For individual store owners, the 70.22% cart abandonment rate is the most actionable number. Fixing checkout UX can increase conversions by over 35%.
How much of ecommerce traffic comes from SEO?
Organic search drives 43% of all ecommerce traffic and generates 23.6% of online orders. That makes SEO the single largest traffic source for online stores. Ecommerce SEO consistently outperforms social media (5% of traffic) as an acquisition channel.
What is the average ecommerce cart abandonment rate?
The global average is 70.22% across all devices. Mobile cart abandonment is higher at 80.02%. Desktop sits at 66.41%. Baymard Institute research shows that $260 billion in abandoned orders are recoverable through better checkout design.
How big is mobile commerce in 2026?
Mobile commerce will generate $4.01 trillion in 2026. That represents nearly 60% of all ecommerce revenue. Despite dominating traffic (75% of visits), mobile converts at roughly half the rate of desktop.
How often are these ecommerce statistics updated?
We update this page quarterly. All statistics include their original source and publication year. Last updated: March 2026.
The ecommerce market is growing at $450+ billion per year. The biggest opportunities are in mobile conversion optimization, organic search traffic, and checkout UX improvements. The data is clear. The stores that invest in SEO and user experience will capture a disproportionate share of this growth.
Written and published by Stacc. We publish 3,500+ articles per month across 70+ industries. All data verified against public sources as of March 2026.
