How to Set Up Google Analytics 4 in 8 Steps
Step-by-step GA4 setup guide covering account creation, tracking code, key events, and GSC integration. Used by 14.2 million websites. Updated 2026.
Siddharth Gangal • 2026-03-28 • SEO Tools
In This Article
14.2 million websites run Google Analytics 4 right now. Over 81% of all web analytics runs through Google. If your site is not tracking visitors with GA4, you are making decisions without data.
That blind spot costs real money. You do not know which pages drive leads. You do not know where visitors drop off. You do not know whether last month’s blog post generated a single conversion.
The Google Analytics 4 setup process takes about 15 minutes. The problem is that most guides skip critical configuration steps. They show you how to paste the tracking code and stop there. Then you spend weeks wondering why your data looks wrong.
We have published 3,500+ blogs across 70+ industries. Every content decision we make starts with analytics data. GA4 is the foundation of that process. This guide walks you through the complete setup, including the steps most tutorials skip.
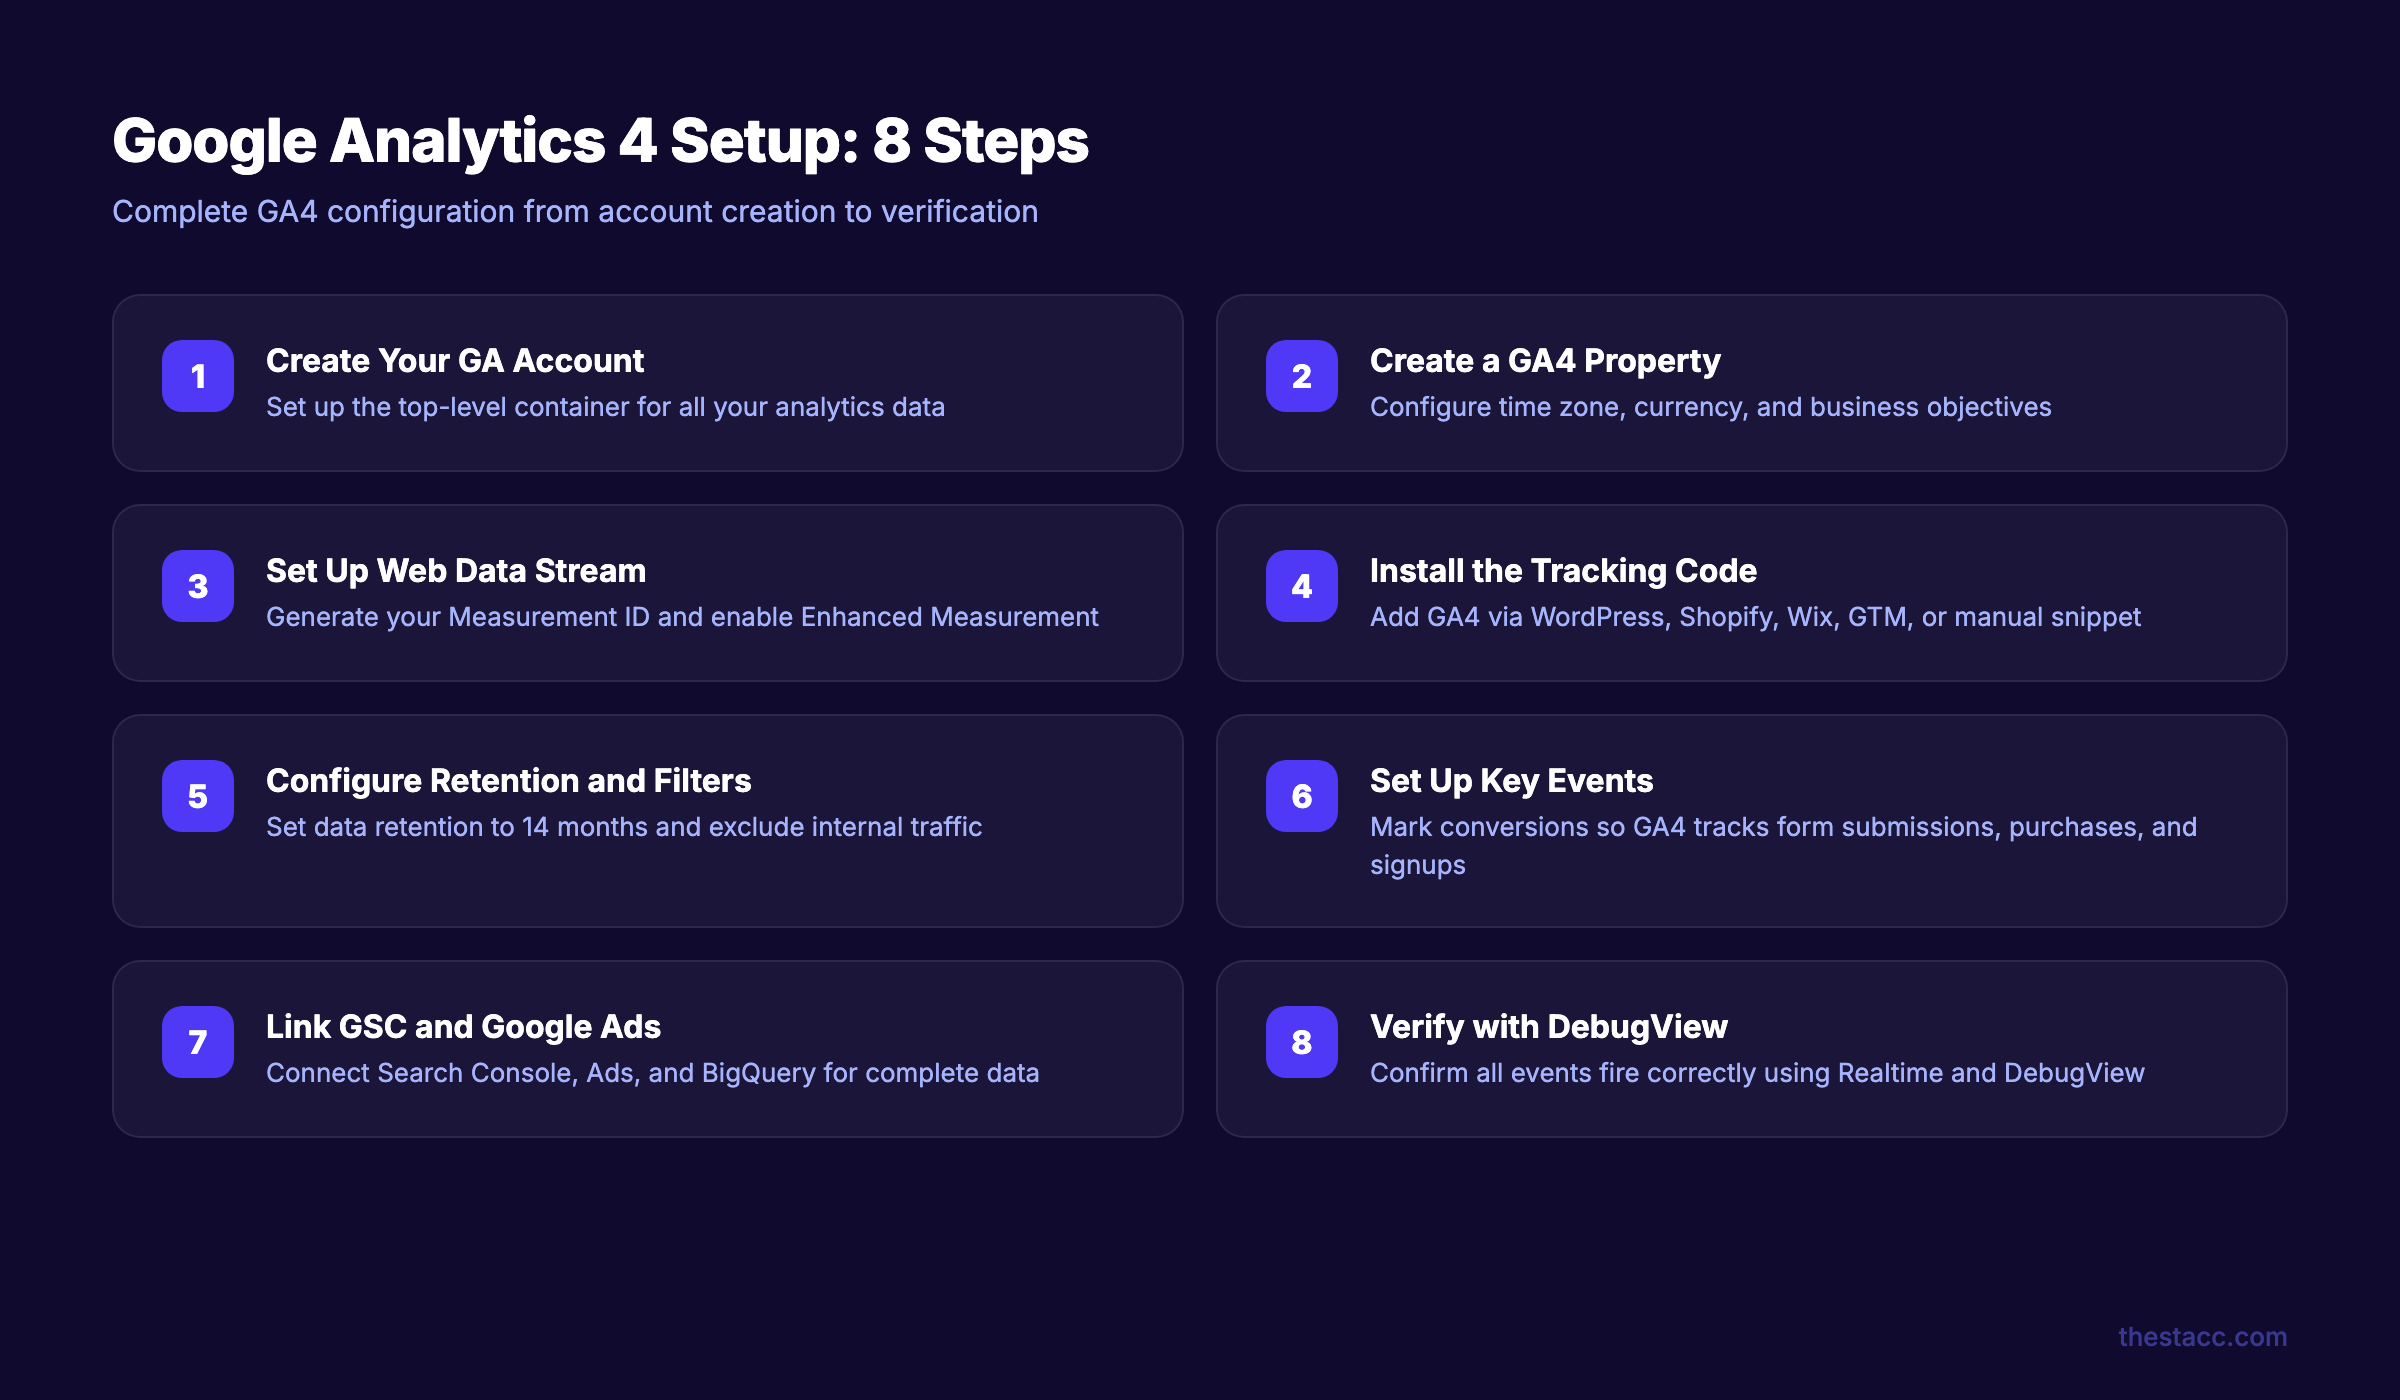
Here is what you will learn:
- How to create your GA4 account and property from scratch
- How to install the tracking code on WordPress, Shopify, or any website
- How to configure data retention, key events, and internal traffic filters
- How to link GA4 to Google Search Console and Google Ads
- How to verify everything works using DebugView
- The 7 most common setup mistakes and how to avoid them
Time required: 15 to 30 minutes Difficulty: Beginner What you need: A Google account and access to your website’s code or CMS
What Is Google Analytics 4?
Google Analytics 4 is Google’s current web analytics platform. It replaced Universal Analytics (UA) in July 2023. Every new Google Analytics property now uses the GA4 model.
The biggest change from UA is how GA4 collects data. Universal Analytics tracked sessions and pageviews. GA4 tracks events. Every interaction is an event. A pageview is an event. A scroll is an event. A button click is an event.
This event-based model gives you more flexibility. You can track almost any user action without writing custom code. But it also means the interface and reports look different from what UA users remember.
According to GA4.com’s usage data, 43.35% of the top 10,000 websites already use GA4. Over 2 million WordPress sites and 520,000 Shopify stores have it installed. Google Analytics holds 81.4% of the web analytics market. It is the default.
GA4 is free. The paid version, Analytics 360, exists for enterprise-scale sites. But the free tier handles up to 10 million events per month. That covers the vast majority of small and mid-size businesses.
Now, here is the step-by-step process.
Step 1: Create Your Google Analytics Account
Go to analytics.google.com and sign in with the Google account you want to use as the admin.
If you already have a Google Analytics account from UA, you can create a new GA4 property inside the same account. Skip to Step 2.
If this is your first time:
- Click Start measuring
- Enter your Account name (your business name works fine)
- Under Account Data Sharing Settings, review each checkbox. Most businesses leave all four enabled. The data sharing helps Google improve its products and provide benchmarking data
- Click Next
Specifically:
- Use one account per business. If you manage multiple websites, create one account for each business entity
- Name the account after the business, not the website. Example: “Acme Plumbing” not “acmeplumbing.com”
- The admin Google account controls access. Use a company-owned Google account, not a personal one. If the person who set it up leaves, you need access
Why this step matters: The account is the top-level container for all your analytics data. Getting the structure wrong now creates access headaches later. Google recommends a maximum of 3 data streams per property. One account, one property per website, one data stream per platform (web, iOS, Android).
Step 2: Create Your GA4 Property
After creating the account (or navigating to Admin in an existing account), you will set up the property.
- Click Create Property
- Enter your Property name (your website name or business name)
- Select your Reporting time zone and Currency
- Click Next
Google will ask about your business:
- Select your Industry category from the dropdown
- Choose your Business size (Small, Medium, Large, Very large)
- Click Next
Then select your Business objectives. GA4 customizes your default reports based on what you choose:
- Generate leads — Best for service businesses
- Drive online sales — Best for ecommerce
- Raise brand awareness — Best for content sites
- Examine user behavior — Best for product teams
- Get baseline reports — Gives you all standard reports
Pro tip: Select Get baseline reports if you are unsure. This gives you every report type. You can always customize later. The other options hide certain reports by default, which confuses new users.
- Accept the Terms of Service
- Click Create
Why this step matters: The time zone and currency settings affect how GA4 attributes sessions and revenue. If your business operates in CST but you select UTC, your daily traffic reports will split at midnight UTC, not midnight Central. Set this correctly now. Changing it later does not fix historical data.
Step 3: Set Up Your Web Data Stream
A data stream tells GA4 where to collect data from. For most businesses, you need one web data stream.
- After creating the property, click Web as your platform
- Enter your Website URL (example: https://yoursite.com)
- Enter a Stream name (example: “Main Website”)
- Leave Enhanced Measurement toggled on
- Click Create stream
GA4 will generate your Measurement ID. It looks like G-XXXXXXXXXX. Copy this. You need it for the next step.
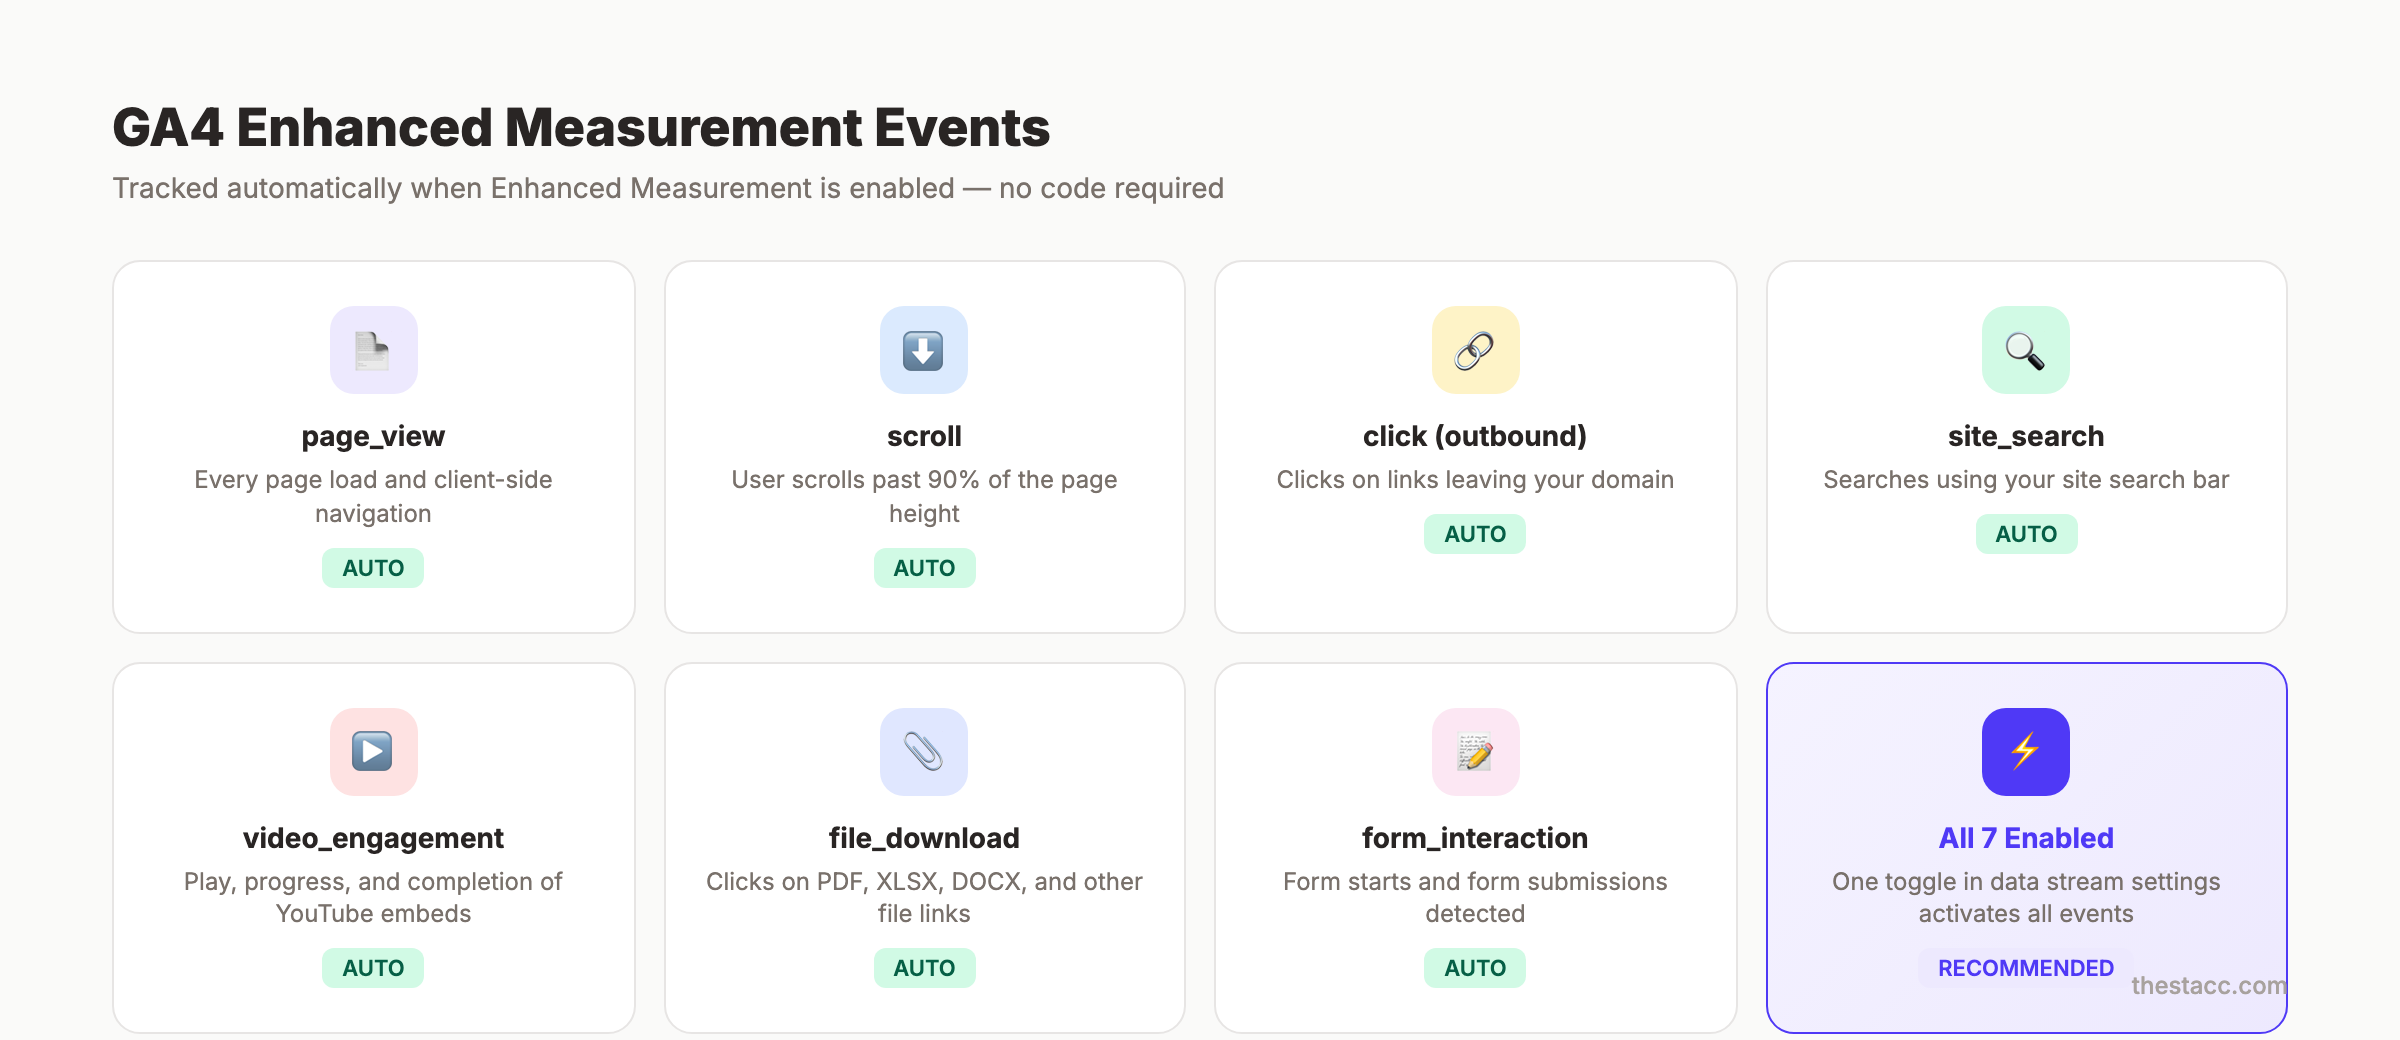
About Enhanced Measurement:
Enhanced Measurement automatically tracks these events without any code:
| Event | What It Tracks |
|---|---|
| page_view | Every page load and navigation |
| scroll | When a user scrolls past 90% of the page |
| click (outbound) | Clicks on links leaving your domain |
| site_search | Searches using your site’s search bar |
| video_engagement | Play, progress, and completion of embedded YouTube videos |
| file_download | Clicks on links to files (PDF, XLSX, DOCX, etc.) |
| form_interaction | Form starts and submissions |
Leave Enhanced Measurement on. You can toggle individual events by clicking the gear icon next to the toggle.
Why this step matters: The Measurement ID is your unique tracking identifier. Without it, GA4 cannot connect data to your property. Enhanced Measurement gives you useful event data from day one with zero configuration.
Pro tip: YouTube video tracking only works if the embed URL includes ?enablejsapi=1. If your embedded videos do not show engagement data, add that parameter.
Step 4: Install the GA4 Tracking Code on Your Website
This is where most guides start and stop. The installation method depends on your platform.
Option A: WordPress (Recommended for Most Users)
The simplest method is Google’s Site Kit plugin:
- In your WordPress admin, go to Plugins → Add New
- Search for Site Kit by Google
- Install and activate the plugin
- Click Start Setup and sign in with the same Google account
- Site Kit will detect your GA4 property and connect automatically
- Verify the connection shows your G-XXXXXXXXXX Measurement ID
If you prefer a lightweight option, use the Insert Headers and Footers plugin:
- Install the plugin
- Go to Settings → Insert Headers and Footers
- Paste the gtag.js snippet (from your GA4 data stream settings) into the Scripts in Header box
- Save
Option B: Shopify
- In your Shopify admin, go to Online Store → Preferences
- Scroll to Google Analytics
- Or install the official Google & YouTube app from the Shopify App Store
- Paste your G-XXXXXXXXXX Measurement ID
- Save
Option C: Wix
- Go to Settings → Tracking & Analytics
- Click New Tool → Google Analytics
- Paste your G-XXXXXXXXXX Measurement ID
- Select All Pages under “Add code to pages”
- Save
Option D: Google Tag Manager (Most Flexible)
If you already use Google Tag Manager, this is the best method for long-term flexibility:
- Open your GTM container
- Click Tags → New
- Choose Google Analytics: GA4 Configuration as the tag type
- Enter your G-XXXXXXXXXX Measurement ID
- Set the trigger to All Pages
- Click Save, then Submit to publish the container
Pro tip: Create a Constant Variable in GTM for your Measurement ID. Name it “GA4 Measurement ID.” This way, if you need the ID in multiple tags later, you change it in one place.
Option E: Manual Installation (Custom Sites)
If none of the above apply, paste this code directly in the <head> section of every page:
<!-- Google tag (gtag.js) -->
<script async src="https://www.googletagmanager.com/gtag/js?id=G-XXXXXXXXXX"></script>
<script>
  window.dataLayer = window.dataLayer || [];
  function gtag(){dataLayer.push(arguments);}
  gtag('js', new Date());
  gtag('config', 'G-XXXXXXXXXX');
</script>
Replace G-XXXXXXXXXX with your actual Measurement ID.
Why this step matters: Without the tracking code installed correctly, GA4 collects zero data. This is the most common point of failure. If you see no data after 24 hours, the code is either missing, on the wrong pages, or blocked by a caching plugin.
Stop guessing what works. Stacc publishes 30 SEO-optimized articles per month and tracks performance automatically. Start for $1 →
Step 5: Configure Data Retention and Filters
GA4’s default settings are not optimized for most businesses. Two configurations need immediate attention.
Change Data Retention to 14 Months
By default, GA4 keeps user-level and event-level data for 2 months. This affects the Explorations reports (your custom analysis tool). Standard reports use aggregated data and are not affected.
- Go to Admin → Data Settings → Data Retention
- Change Event data retention from 2 months to 14 months
- Toggle on Reset user data on new activity
- Click Save
According to Analytics Mania, leaving this at 2 months is the single most common GA4 setup mistake. You will not notice the problem until you try to run a year-over-year comparison in Explorations and discover the data is gone.
Exclude Internal Traffic
Your own team’s visits pollute your data. A 10-person team checking the website daily adds 200+ fake sessions per month.
- Go to Admin → Data Streams → [Your Stream] → Configure Tag Settings
- Click Show All to expand options
- Click Define internal traffic
- Click Create and set:
- Rule name: “Office IP” (or “Team Traffic”)
- Match type: IP address equals
- Value: Your office IP address (search “what is my IP” on Google)
- Save the rule
Then activate the filter:
- Go to Admin → Data Settings → Data Filters
- Find the Internal Traffic filter
- Change its state from Testing to Active
- Save
Why this step matters: Wrong data retention means you lose historical analysis capability. Unfiltered internal traffic inflates your metrics and distorts conversion rate calculations. These two settings take 3 minutes to fix but affect every report you look at.
Step 6: Set Up Key Events (Conversions)
GA4 calls conversions “key events.” These are the actions that matter most to your business. GA4 tracks pageviews and scrolls automatically. But it does not know which actions represent leads, sales, or signups unless you tell it.
Mark Existing Events as Key Events
Some events already exist from Enhanced Measurement. You just need to flag the important ones:
- Go to Admin → Events
- Find the event you want to track as a conversion
- Toggle the Mark as key event switch
Common events to mark as key events:
| Business Type | Key Event | Event Name |
|---|---|---|
| Service business | Contact form submission | form_submit or generate_lead |
| Ecommerce | Purchase completion | purchase |
| SaaS | Free trial signup | sign_up |
| Content site | Newsletter subscription | Custom event |
| Any | Phone number click | click (with link_url filter) |
Create Custom Events (If Needed)
If the event you want to track does not exist yet:
- Go to Admin → Events → Create Event
- Click Create
- Name your event (use snake_case:
book_appointment,request_quote) - Set conditions. Example: track form submissions on your contact page only:
- Parameter: event_name | Operator: equals | Value: form_submit
- Parameter: page_location | Operator: contains | Value: /contact
After creating it, go back to the Events list and mark it as a key event.
Why this step matters: Without key events, GA4 only shows you traffic volume. You cannot measure ROI, calculate cost per lead, or know which pages actually drive business. This is the difference between “we got 5,000 visitors” and “we got 47 leads from organic search.”
Pro tip: Do not create duplicate events. If you track form submissions through GTM, do not also create the same event in GA4’s interface. Duplicate events double-count your conversions and make every report inaccurate.
Step 7: Link Google Search Console and Google Ads
GA4 works best when connected to other Google products. Two integrations are essential.
Link Google Search Console
This integration shows your organic search queries directly inside GA4 reports.
- Go to Admin → Product Links → Search Console Links
- Click Link
- Select the Search Console property that matches your website
- Select the GA4 web data stream
- Click Submit
After linking, you will find a new Search Console section under Reports → Acquisition. It shows:
- The exact queries driving organic traffic to your site
- Click-through rates for each query
- Average position in search results
- Landing page performance by query
If you have not set up Google Search Console yet, read our Google Search Console guide first.
Link Google Ads (If Running Paid Campaigns)
- Go to Admin → Product Links → Google Ads Links
- Click Link
- Select your Google Ads account
- Enable Personalized Advertising (recommended)
- Click Submit
This connection lets you:
- See Google Ads campaign data in GA4 reports
- Import GA4 key events as Google Ads conversions
- Build remarketing audiences from GA4 data
- Compare paid vs organic performance in one place
Connect to BigQuery (Free for All GA4 Users)
Most businesses skip this, but BigQuery export gives you unsampled, raw event data. GA4’s standard reports sample data above 10 million events per month. BigQuery does not.
- Go to Admin → Product Links → BigQuery Links
- Click Link
- Select or create a Google Cloud project
- Choose Daily export (free) or Streaming (may incur costs)
- Click Submit
Why this step matters: GA4 in isolation gives you website behavior data. GA4 linked to Search Console tells you which keywords bring visitors. GA4 linked to Google Ads shows you which campaigns convert. These connections turn raw data into decisions.
Your SEO team. $99 per month. 30 optimized articles, published automatically. Track the results in GA4. Start for $1 →
Step 8: Verify Your Setup with DebugView
Do not assume everything works. Verify it.
Use GA4 Realtime Report
- Open your website in a new browser tab
- In GA4, go to Reports → Realtime
- You should see at least 1 active user (you)
- Click through a few pages and confirm page_view events appear
- Trigger a key event (submit a test form, click a tracked button) and confirm it appears
If you see zero users after 5 minutes, the tracking code is not installed correctly. Go back to Step 4.
Use DebugView for Detailed Verification
DebugView shows every event GA4 receives in real time, with full parameter details.
To enable DebugView:
If you use Google Tag Manager:
- Open GTM Preview mode (click Preview in the top right)
- Browse your website in the preview window
- GA4 automatically enters debug mode for that session
If you installed gtag.js manually, add debug_mode to your config:
gtag('config', 'G-XXXXXXXXXX', { debug_mode: true });Then in GA4:
- Go to Admin → DebugView
- Browse your site and watch events stream in
- Click any event to see its parameters
- Verify that key events fire correctly
Post-Setup Verification Checklist
Run through this before considering your setup complete:
- Realtime report shows your visit within 5 minutes
- page_view events fire on every page navigation
- Enhanced Measurement events work (scroll past 90% of a page, click an outbound link)
- Key events fire when you submit a form or complete the tracked action
- Internal traffic filter excludes your IP (check from your office network)
- Data retention is set to 14 months
- Search Console link shows data (may take 24 to 48 hours)
- DebugView shows all expected events and parameters
Why this step matters: GA4 data issues are silent. The platform does not warn you if events are misconfigured, if internal traffic is inflating numbers, or if key events are double-counting. DebugView is the only way to catch these problems before they corrupt weeks of data.
7 Common GA4 Setup Mistakes (And How to Fix Them)
Even after following the steps above, these mistakes catch people off guard.
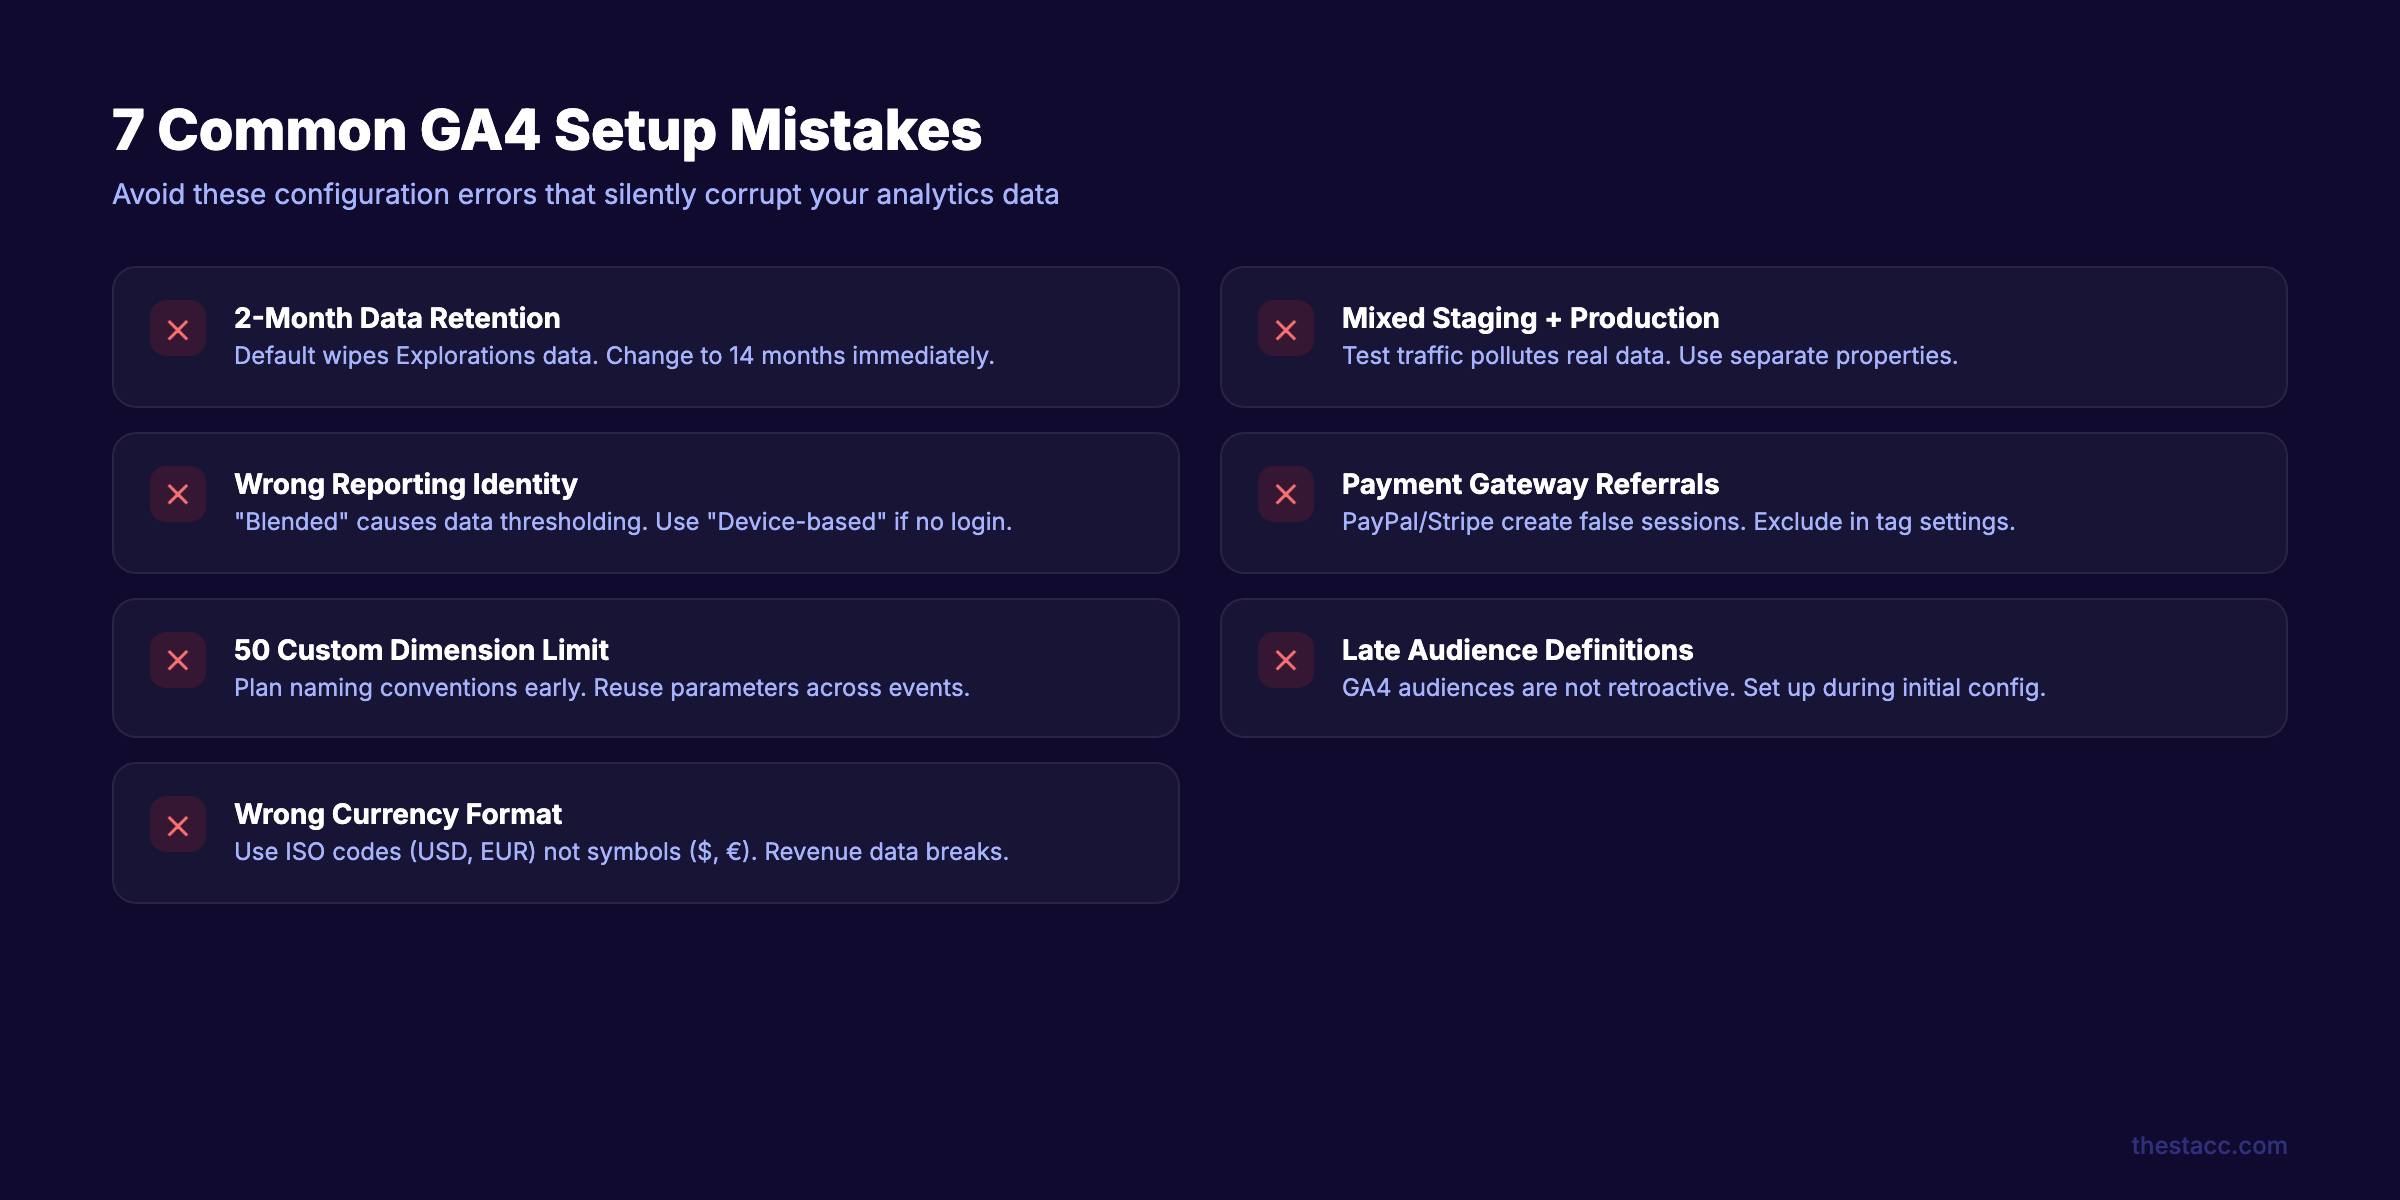
1. Leaving data retention at 2 months. The default wipes your Explorations data after 60 days. Change it to 14 months in Admin → Data Settings → Data Retention. Standard reports are not affected, but any custom analysis you build in Explorations will lose historical data.
2. Not separating staging from production. If your development or staging site uses the same Measurement ID, test traffic mixes with real visitor data. Create a separate GA4 property for staging environments.
3. Wrong reporting identity setting. GA4 defaults to “Blended” reporting identity, which uses Google Signals. This causes data thresholding, where GA4 hides data to protect user privacy. If your site does not have user login, switch to “Device-based” under Admin → Reporting Identity.
4. Not excluding payment gateway referrals. When visitors go to PayPal, Stripe, or another payment processor and return to your site, GA4 creates a new session attributed to the payment gateway. This breaks your conversion attribution. Go to Admin → Data Streams → Configure Tag Settings → List Unwanted Referrals and add your payment domains.
5. Exceeding the 50 custom dimension limit.
GA4 allows 50 custom event-scoped dimensions and 25 user-scoped dimensions. Plan your naming convention before you start. Use reusable parameter names across events (like content_type or item_category) instead of creating unique parameters for every event.
6. Not defining audiences early. GA4 audience data is not retroactive. If you create an audience today, GA4 starts populating it today. It does not backfill historical data. Set up your key audiences (returning visitors, converters, high-value users) during initial setup.
7. Using the wrong currency format in purchase events. Ecommerce sites must send currency as ISO 4217 codes (USD, EUR, GBP), not symbols ($, €, £). If the currency parameter is missing or formatted wrong, your revenue data will not appear in reports.
3,500+ blogs published. 92% average SEO score. See what Stacc can do for your site. Start for $1 →
Results: What to Expect
After completing these 8 steps, your GA4 property will be fully configured and collecting data.
- Immediate: Realtime report shows active visitors. DebugView confirms event tracking.
- Within 24 hours: Standard reports populate with traffic, acquisition, and engagement data.
- Within 48 hours: Search Console data appears in GA4 acquisition reports (if linked).
- Within 7 days: Enough data to identify your top pages, traffic sources, and user behavior patterns.
- Within 30 days: Meaningful trends emerge. You can compare weeks, identify drop-off points, and measure key event rates by channel.
GA4 gets more useful over time. The more data it collects, the better your reports, audiences, and analysis become. That is why setting the data retention to 14 months from day one matters.
Troubleshooting
Problem: GA4 shows no data after installation.
Fix: Check that the tracking code is in the <head> section of every page, not the <body>. Clear any caching plugins (WP Super Cache, W3 Total Cache, Cloudflare). Open your site in an incognito window and check Realtime. If you use a consent management platform, verify it is not blocking the GA4 script before consent.
Problem: Event counts seem doubled. Fix: You likely have the tracking code installed twice. This happens when you add gtag.js manually AND through a plugin or GTM. Check your page source (right-click → View Page Source) and search for your Measurement ID. It should appear exactly once.
Problem: Realtime works but standard reports show zero data. Fix: Standard reports have a 24 to 48 hour processing delay. Wait a full day. If data still does not appear after 48 hours, check that your data filter is not set to “Testing” mode for all traffic (not just internal).
FAQ
Is Google Analytics 4 free?
Yes. GA4 is free for all users. It handles up to 10 million events per month without sampling. The paid version, Google Analytics 360, starts at approximately $50,000 per year and is designed for enterprise-scale websites with billions of monthly events.
How long does GA4 take to start showing data?
The Realtime report shows data within seconds of correct installation. Standard reports take 24 to 48 hours to process. Some reports, like Search Console integration data, can take up to 72 hours to populate fully.
Can I use GA4 on multiple websites?
Yes. Create one GA4 property per website. You can manage multiple properties under a single Google Analytics account. Each property gets its own Measurement ID and data stream.
What is the difference between GA4 and Universal Analytics?
Universal Analytics tracked sessions and pageviews. GA4 tracks events. Every user interaction in GA4 is an event, including pageviews, scrolls, and clicks. GA4 also uses a different data model, different reports, and different attribution. UA stopped processing data on July 1, 2023.
Do I need Google Tag Manager for GA4?
No. You can install GA4 with a direct code snippet, a CMS plugin, or a platform integration. GTM adds flexibility for advanced event tracking and is recommended for businesses that plan to track custom events beyond Enhanced Measurement defaults.
How do I find my GA4 Measurement ID?
Go to Admin → Data Streams → click your web stream. The Measurement ID appears at the top. It starts with “G-” followed by 10 alphanumeric characters.
Setting up GA4 correctly the first time saves you from months of bad data and retroactive fixes. Follow the 8 steps, run the verification checklist, and check your reports after 48 hours.
Your analytics foundation is now in place. The next step is using that data to improve your SEO performance and content strategy.
Written and published by Stacc. We publish 3,500+ articles per month across 70+ industries. All data verified against public sources as of March 2026.
