SEO Reporting: The Complete Guide (2026)
Learn how to create SEO reports that prove ROI. Covers metrics, tools, templates, and reporting frequency. With real KPI benchmarks. Updated 2026.
Siddharth Gangal • 2026-03-28 • SEO Tips
In This Article
SEO reporting is where most businesses fail at search optimization. Not because their SEO strategy is wrong. Because they cannot prove it is working.
42.86% of digital marketing clients are unsatisfied with their agency’s reports. The most common complaint: data without insights. A 30-page PDF full of charts that nobody reads and nobody understands. Meanwhile, the question that actually matters goes unanswered: “How much money did SEO make us this month?”
This guide covers how to build SEO reports that answer that question. Which metrics to include, which to skip, how to structure the report for different audiences, and how to connect organic traffic to revenue.
We have published 3,500+ SEO articles across 70+ industries. We track every metric in this guide for our own content and our clients. These are the reporting frameworks that actually retain clients and prove ROI.
Here is what you will learn:
- The 4 tiers of SEO metrics (and which tier your report should lead with)
- How to connect organic traffic to revenue using attribution
- The exact report structure that keeps clients engaged
- How to tailor reports for executives vs marketing managers vs SEO teams
- Common mistakes that make reports useless
- How often to report (the answer is not always “monthly”)
What SEO Reporting Is and Why It Matters
SEO reporting is the process of collecting, analyzing, and presenting data about your organic search performance. A good report shows what happened, why it happened, and what to do next. A bad report shows charts with no context.
Why Reports Get Ignored
Most SEO reports fail because they lead with the wrong data. Business owners do not care about Domain Authority scores or backlink counts. They care about leads, revenue, and growth. When a report opens with vanity metrics, the reader disengages within 30 seconds.
The fix is simple: lead with business outcomes, not SEO metrics. Start with revenue and conversions. Then show the SEO work that drove those results.
The Business Case for Good Reporting
SEO delivers a median ROI of 748% according to First Page Sage. That is $7.48 returned for every $1 invested. But that return is invisible without proper reporting. A business that cannot measure SEO ROI eventually stops investing in SEO.
Good reporting serves 3 functions:
- Proves ROI — Connects SEO activity to revenue. Justifies continued investment.
- Identifies what works — Shows which content, keywords, and pages drive results.
- Guides strategy — Reveals what to do next based on data, not guesswork.
For a full breakdown of how to measure content ROI, see our content marketing ROI guide.
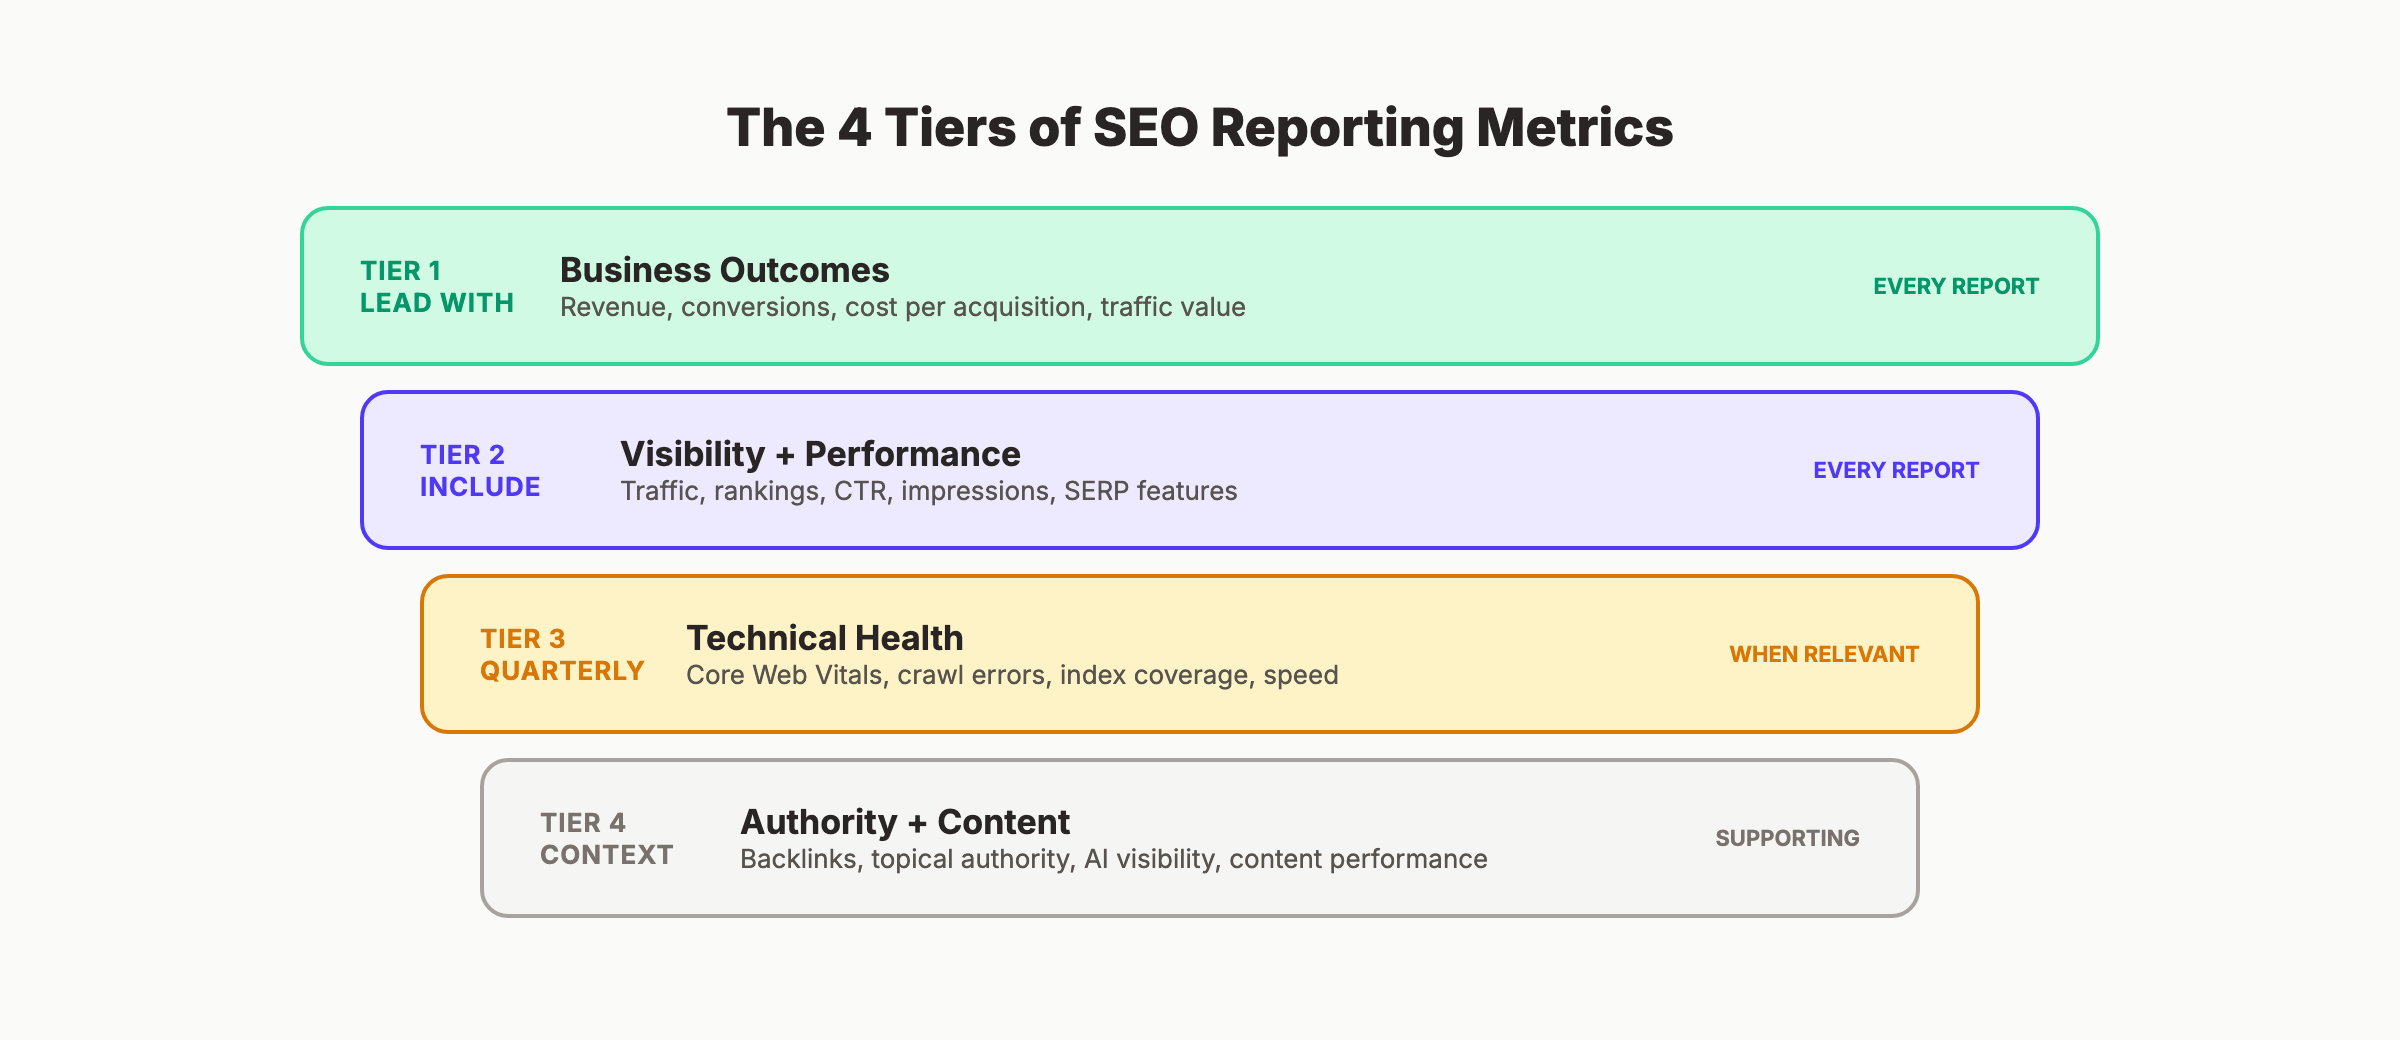
The 4 Tiers of SEO Metrics
Not all metrics belong in every report. Organize them into tiers based on who reads the report and what decisions they make.
Tier 1: Business Outcome Metrics (Lead With These)
| Metric | What It Measures | Where to Find It |
|---|---|---|
| Organic revenue | Dollar value from organic traffic | Google Analytics (e-commerce tracking or goal values) |
| Organic conversions | Leads, form fills, phone calls, purchases from organic | GA4 conversion events |
| Organic conversion rate | % of organic visitors who convert | GA4 (conversions / sessions) |
| Cost per organic acquisition | How much each organic lead costs | SEO spend / organic conversions |
| Traffic cost equivalent | What the organic traffic would cost as PPC | Ahrefs or Semrush “Traffic Value” |
Traffic cost equivalent is the metric that makes SEO budgets defensible. If your organic traffic would cost $15,000 per month to replicate with Google Ads, a $99 to $500 SEO investment is obviously worth it.
Tier 2: Visibility and Performance Metrics
| Metric | What It Measures | Where to Find It |
|---|---|---|
| Organic traffic | Total sessions from search engines | GA4 |
| Keyword rankings | Position distribution and movement | Ahrefs, Semrush, or GSC |
| Click-through rate (CTR) | % of impressions that result in clicks | Google Search Console |
| Impressions | How often your pages appear in search results | GSC |
| SERP feature captures | Featured snippets, PAA, AI Overviews | Semrush or manual tracking |
Include these metrics in every report. But never lead with them. Traffic without revenue context is a vanity metric.
Tier 3: Technical Health Metrics
| Metric | Benchmark | Impact |
|---|---|---|
| LCP (Largest Contentful Paint) | Under 2.5 seconds | Sites meeting this threshold see 15-25% higher conversions |
| INP (Interaction to Next Paint) | Under 200ms | Correlates with 20-30% better engagement |
| CLS (Cumulative Layout Shift) | Under 0.1 | Reduces form abandonment by 10-15% |
| Crawl errors | Zero critical errors | Prevents pages from being indexed |
| Index coverage | 90%+ of target pages indexed | Ensures Google can find your content |
Report technical metrics quarterly unless active fixes are underway. Include them monthly only when explaining performance changes. Use our SEO audit tool to check these metrics on demand.
Tier 4: Authority and Content Metrics
| Metric | What It Measures |
|---|---|
| Referring domains | Number of unique websites linking to yours (trend over time) |
| Topical authority coverage | How many keyword clusters you own page-1 positions for |
| Content performance | Top pages by traffic, conversions, and engagement |
| AI search visibility | How often AI Overviews and LLMs cite your content |
AI search visibility is the newest reporting metric. For setup guidance, see our post on tracking AI search visibility.
Your SEO team. $99 per month. 30 optimized articles published automatically. Performance tracked. Results reported. Start for $1 →
How to Set Up SEO Reporting
Every SEO report pulls data from the same core sources. Set these up once and reporting becomes a recurring process, not a monthly scramble.
The 3 Essential Data Sources
1. Google Search Console (free)
GSC is the only source of real Google search data. It shows exact queries, impressions, clicks, CTR, and average position for your pages. Every other tool estimates these numbers. GSC reports them directly from Google.
Set up GSC if you have not already. Verify your domain. Submit your sitemap. Then let it collect data for at least 30 days before pulling your first report. See our Google Search Console guide for setup steps.
2. Google Analytics 4 (free)
GA4 tracks what happens after the click. Organic sessions, pages visited, conversions, and revenue. Connect GA4 to GSC for a complete picture of the journey from search query to conversion.
The key reports in GA4 for SEO:
- Traffic acquisition → filter by “Organic Search” to isolate organic visitors
- Landing page performance → which pages drive the most organic visits and conversions
- Conversion paths → how organic traffic contributes to goals across multiple touchpoints
- Engagement metrics → average engagement time and bounce rate for organic visitors
3. A rank tracking tool (free or paid)
Google Search Console shows average position, but it does not track daily movements or competitor positions. Use a dedicated tool:
| Tool | Price | Best For |
|---|---|---|
| Google Search Console | Free | Basic position monitoring, query data |
| Ahrefs | From $99/mo | Deep keyword tracking, backlink data, competitor analysis |
| Semrush | From $139.95/mo | All-in-one reporting, position tracking, site audits |
| Ubersuggest | From $29/mo | Budget-friendly rank tracking |
| SE Ranking | From $52/mo | Agency reporting features |
For a full comparison, see our SEO statistics post with current tool adoption data.
SEO Report Structure and Template
The best SEO reports follow a consistent structure. Use this template for monthly reporting.
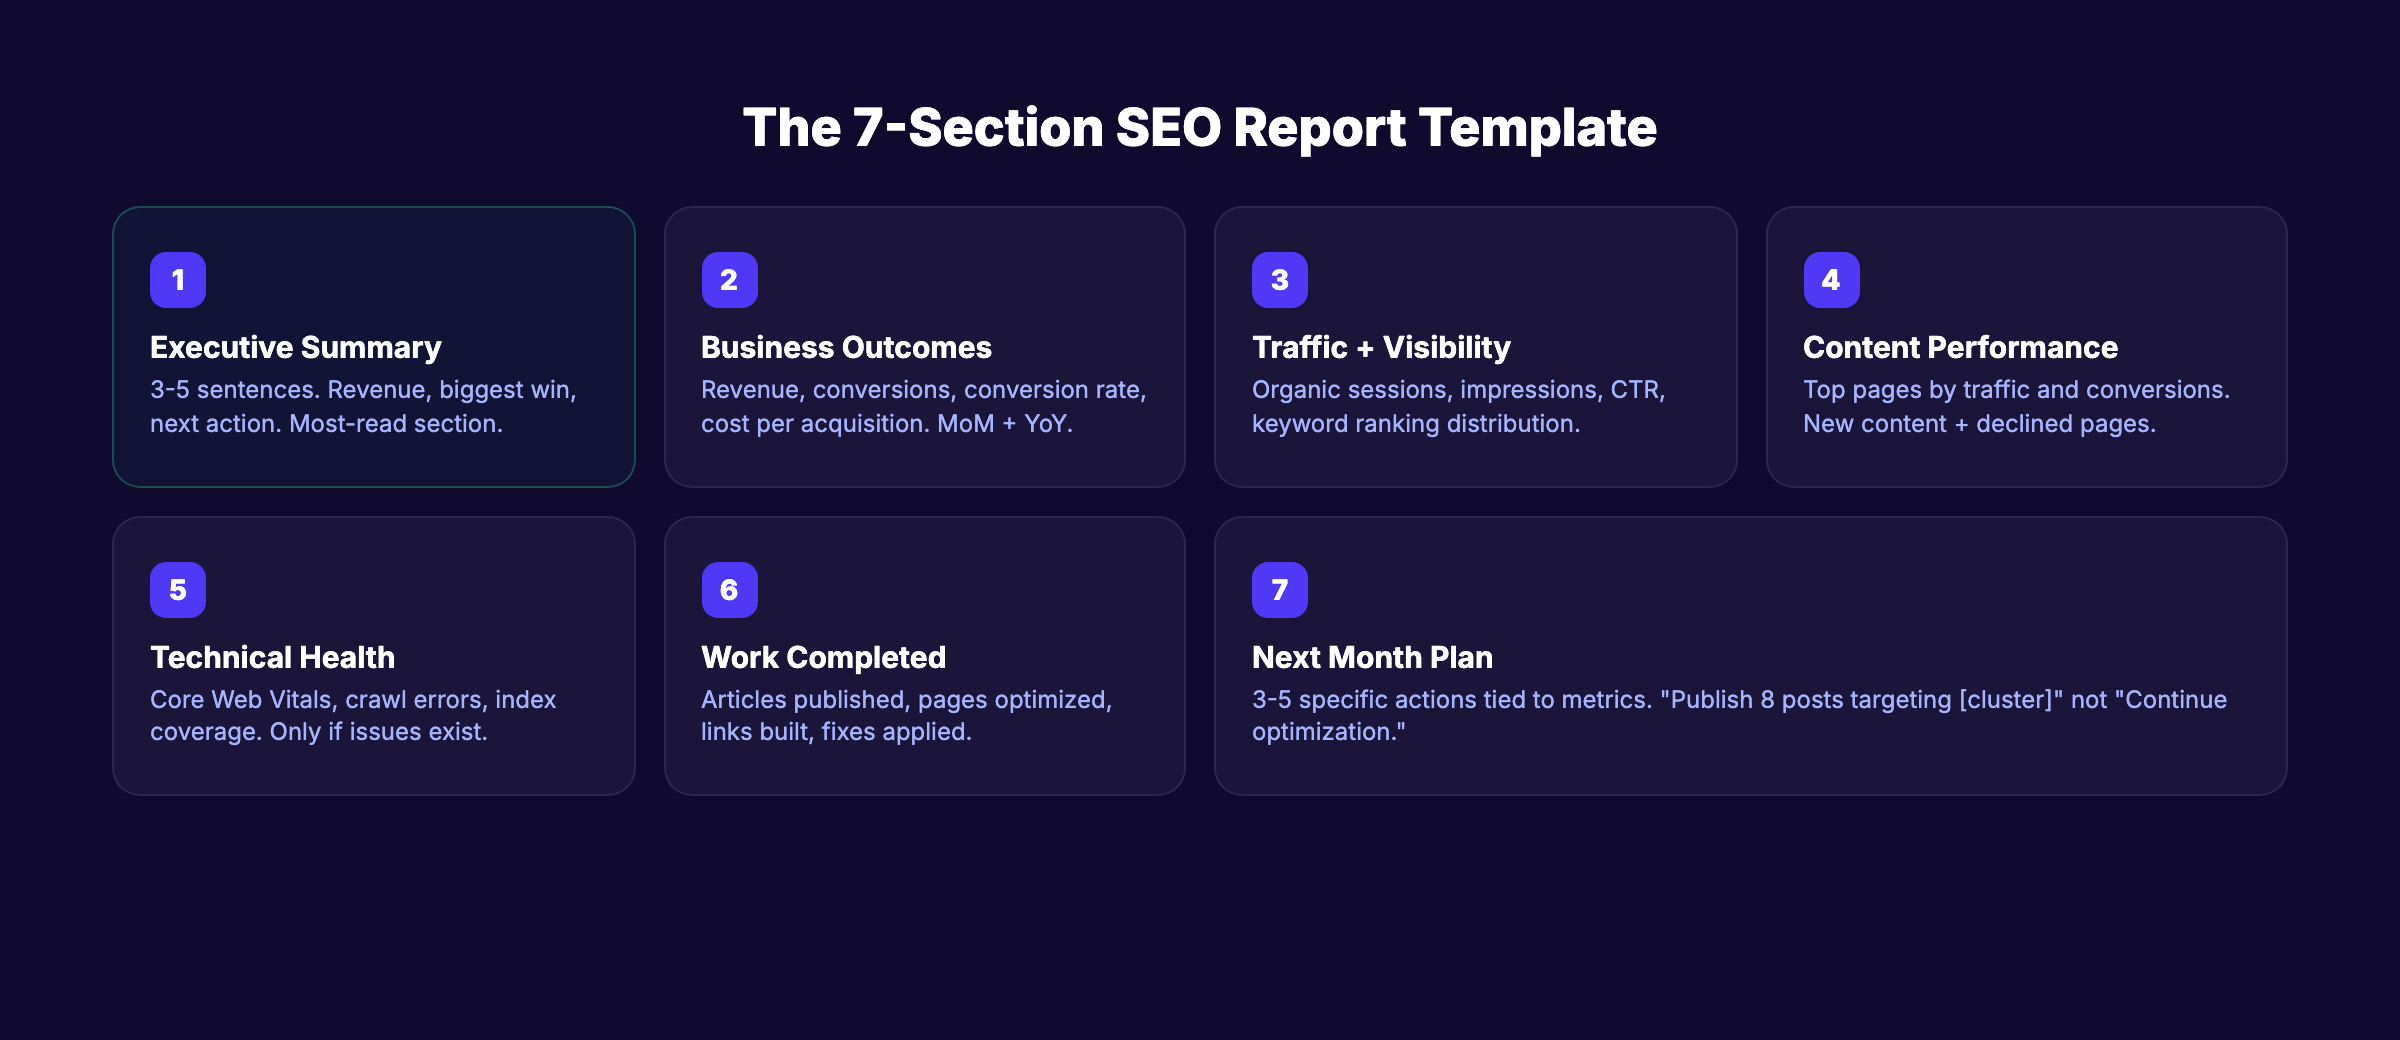
The 7-Section SEO Report
Section 1: Executive Summary (1 paragraph)
3 to 5 sentences covering: organic revenue or conversions this month, traffic trend, biggest win, biggest issue, and one recommended action. This is the section that 80% of stakeholders read. Make it count.
Section 2: Business Outcomes
Organic revenue, conversions, conversion rate, and cost per acquisition. Compare to the previous month and same month last year. Use a simple table or 4 stat cards.
Section 3: Traffic and Visibility
Organic sessions, impressions, CTR, and keyword ranking distribution. Show month-over-month and year-over-year trends. Highlight new page-1 rankings.
Section 4: Content Performance
Top 10 pages by organic traffic. Top 5 pages by conversions. Any new content published this month with early performance data. Pages that declined (and why).
Section 5: Technical Health
Core Web Vitals status. Crawl errors. Index coverage changes. Only include if there are issues to report or fixes to highlight.
Section 6: Work Completed
What you actually did this month. Articles published, pages optimized, links built, technical fixes applied. This section builds trust by showing activity behind the numbers.
Section 7: Next Month Plan
3 to 5 specific actions planned for the next reporting period. Tie each action to a metric it will impact. “Publish 8 blog posts targeting [keyword cluster]” is better than “Continue content optimization.”
3,500+ blogs published. 92% average SEO score. Every article passes a 40-point quality audit before it goes live. Start for $1 →
Reporting for Different Audiences
The same data needs different framing depending on who reads the report. A CEO wants a different story than an SEO manager.
Report by Audience
| Audience | What They Care About | Report Focus | Length |
|---|---|---|---|
| CEO / Business Owner | Revenue, ROI, growth trajectory | Tier 1 metrics only. 1-page summary with 4 numbers | 1 page |
| Marketing Manager | Channel performance, content ROI, strategy alignment | Tiers 1-2. Month-over-month trends and content wins | 3-5 pages |
| SEO Specialist / Team | Rankings, technical health, content gaps, backlink profile | All 4 tiers. Full detail with action items | 8-15 pages |
| Client (Agency) | Proof of work, results, next steps | Tiers 1-2 + work completed + plan. Clear, visual, concise | 5-7 pages |
The number-one reason clients fire SEO agencies is not bad results. It is bad communication. A report that explains why rankings dropped (and what you are doing about it) retains clients. A report that hides bad news loses them.
The Executive Summary Rule
Every report, regardless of audience, needs a plain-language executive summary at the top. One paragraph. No jargon. Answer these 3 questions:
- Did organic traffic and revenue go up or down compared to last month?
- What was the biggest win?
- What is the plan for next month?
If the reader stops after the summary, they still know the essentials.
Reporting for Agencies vs In-House Teams
Agency reports need one extra element: proof of work. In-house teams can skip the “what we did” section because leadership sees the work happening. Agency clients do not. Every agency report should include a clear list of deliverables completed that month. Articles published, pages optimized, links acquired, and technical issues resolved. Without this section, clients assume nothing happened.
In-house reports focus more heavily on strategy alignment. Show how SEO results connect to broader marketing goals. Compare organic channel performance against paid, email, and social. Position SEO within the full marketing mix, not as an isolated activity.
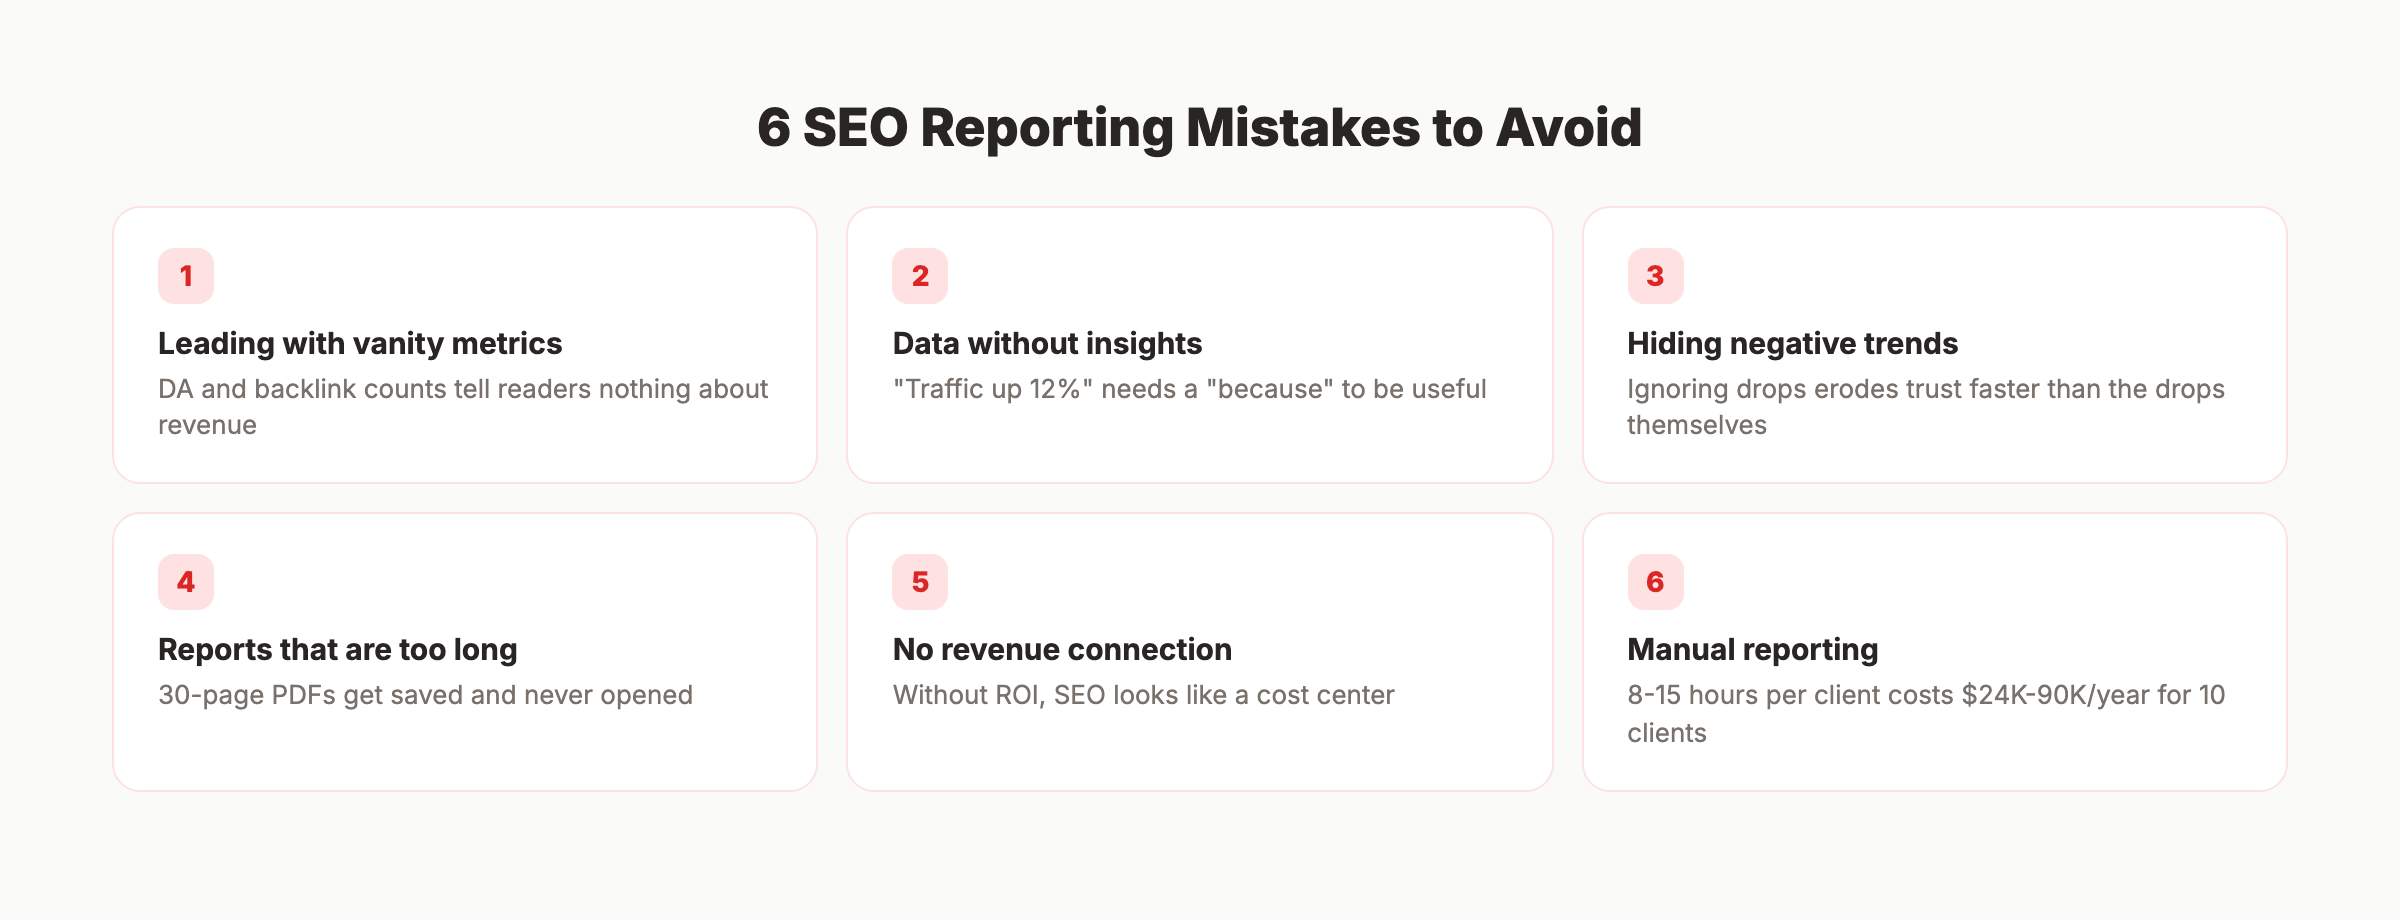
Common SEO Reporting Mistakes
These mistakes are the reason 42.86% of clients are dissatisfied with their reports. Avoid all of them.
Mistake 1: Leading With Vanity Metrics
Domain Authority, total backlinks, and raw impression counts look good but tell the reader nothing about business impact. Lead with revenue and conversions. Show SEO metrics in context.
Mistake 2: Data Without Insights
A chart showing “organic traffic increased 12%” is data. “Organic traffic increased 12% because the 5 blog posts we published in February started ranking for 23 new keywords” is an insight. Every data point needs a “so what.”
Mistake 3: Ignoring Negative Trends
Traffic dropped? A keyword lost rankings? Report it. Explain why. Share your plan to fix it. Hiding bad data erodes trust faster than bad data itself.
Mistake 4: Reports That Are Too Long
A 30-page PDF gets saved and never opened. Keep executive reports to 1 page. Keep detailed reports under 10 pages. If you need more space, create an appendix that lives in a separate document.
Mistake 5: No Connection to Revenue
If your report cannot answer “how much money did SEO generate?” it is incomplete. Set up conversion tracking in GA4. Assign values to goals. Calculate traffic cost equivalent. Without revenue attribution, SEO will always look like a cost center instead of a profit driver.
For help setting up attribution, see our guide on measuring content marketing ROI.
Mistake 6: Manual Reporting Without Automation
Manual SEO reporting costs agencies 8 to 15 hours per client per month. At 10 clients, that is $24,000 to $90,000 per year in labor. Automate data collection. Spend your time on insights and recommendations, not copying numbers between spreadsheets.
Rank everywhere. Do nothing. Blog SEO, Local SEO, and Social on autopilot. Stacc starts at $99 per month with a $1 trial. Start for $1 →
How Often to Send SEO Reports
58% of agencies send monthly reports. That is the right cadence for most businesses. But not all.
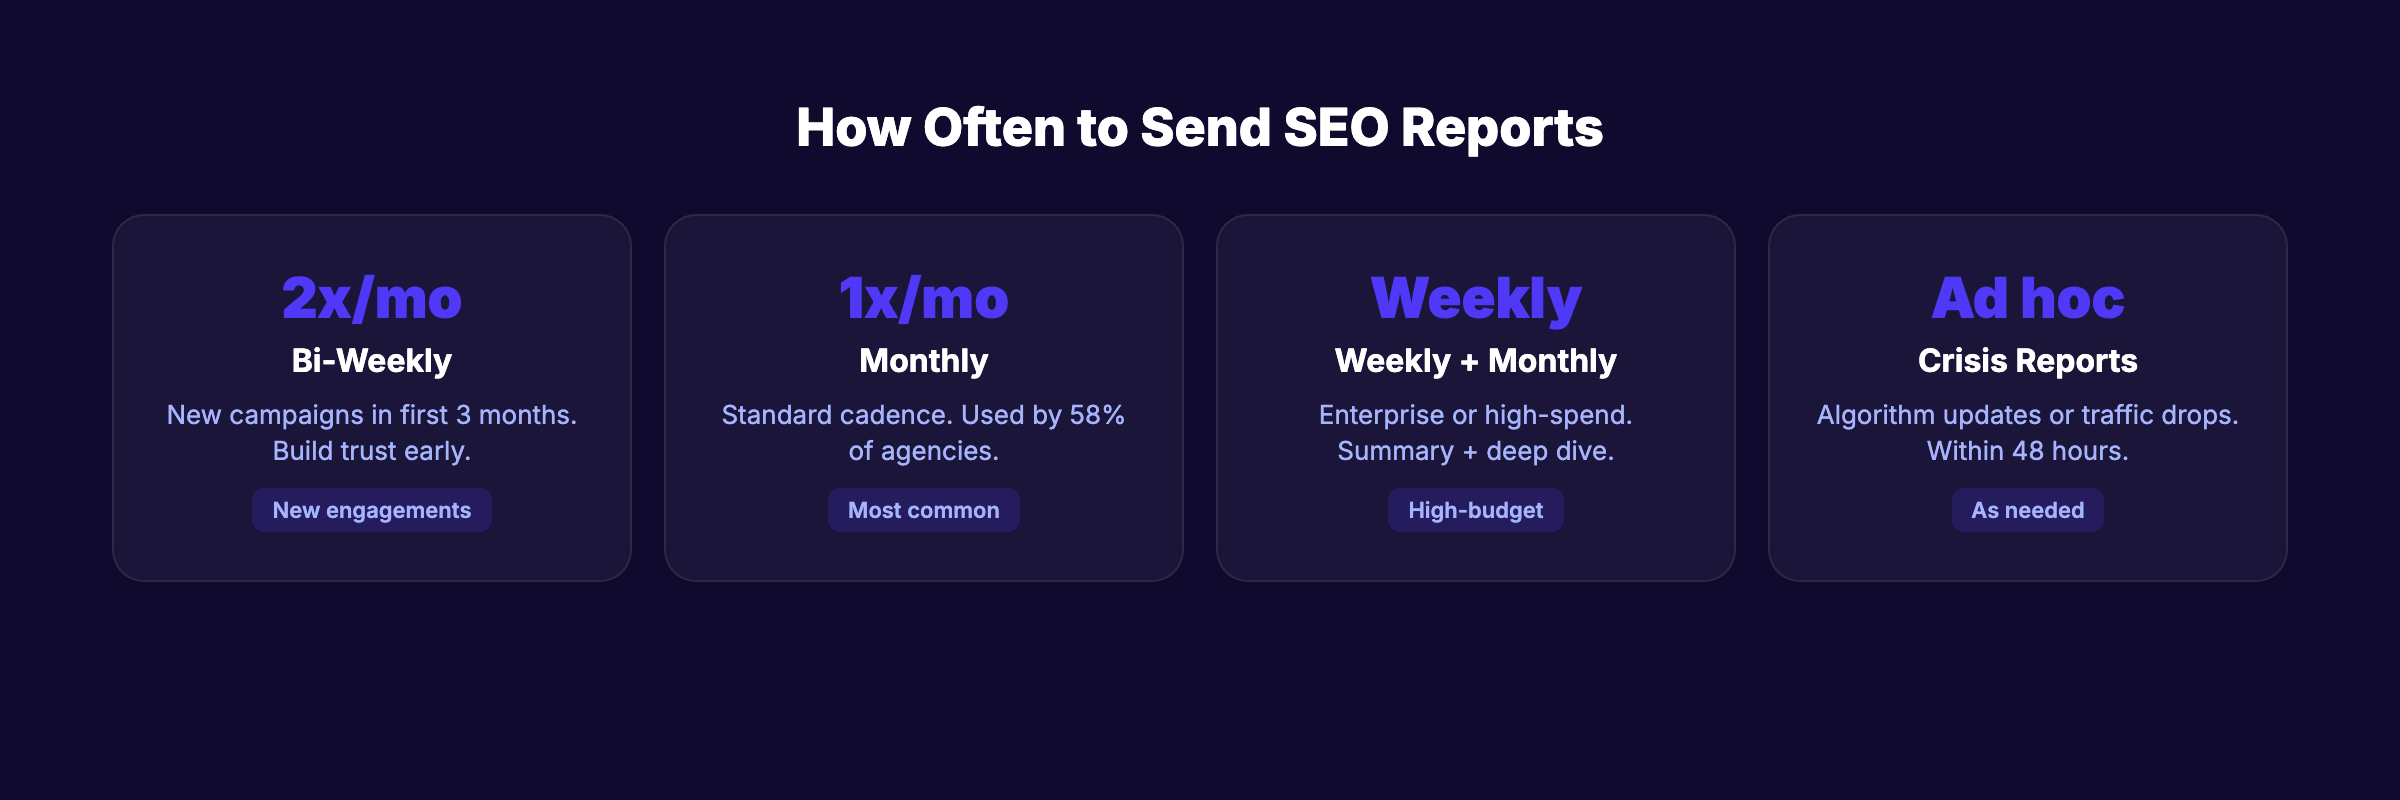
Reporting Frequency Decision Guide
| Situation | Recommended Frequency | Why |
|---|---|---|
| Standard SEO engagement | Monthly | Enough data to show trends. Not so frequent that noise dominates signal |
| New SEO campaign (first 3 months) | Bi-weekly | Early stages need more communication to build trust and set expectations |
| Enterprise or high-spend clients | Weekly summary + monthly deep dive | Large budgets demand more accountability |
| Seasonal businesses | Monthly + pre/post season reports | Capture peak performance windows |
| Crisis or major algorithm update | Ad hoc (within 48 hours) | Quick communication prevents panic |
The wrong time to send a report is when nothing meaningful has changed. If the data looks the same as last week, a weekly report adds noise without value. Report when there is something to say.
The Annual Review
Once per year, produce a full annual review. Compare January to December. Show total organic revenue, traffic growth, keyword gains, and ROI. This is the report that justifies budget renewal and expansion.
For context on what SEO costs and how to budget for it, see our SEO cost guide.
New in 2026: AI Search Metrics
With AI Overviews appearing on 15% to 20% of search queries and growing, add these metrics to your reports:
- AI Overview appearances — How often your content appears in AI-generated answers
- AI-referred traffic — Visitors arriving from ChatGPT, Perplexity, and other AI search tools
- SERP feature capture rate — Featured snippets, People Also Ask, and AI Overviews combined
- Click-through rate trend — Track whether CTR holds steady or declines as AI features expand
These metrics are new, and benchmarks are still forming. But tracking them now establishes baselines for future comparison. For setup details, see our guide on tracking AI search visibility.
For the broader context on how AI search affects SEO strategy, see our SEO trends for 2026 post.
FAQ
What is SEO reporting?
SEO reporting is the process of collecting and presenting data about organic search performance. A good report covers traffic, rankings, conversions, revenue, and the work completed to achieve those results. The goal is to prove ROI and guide strategy decisions with data instead of guesswork.
What should be included in an SEO report?
At minimum: organic revenue or conversions (business outcomes), organic traffic and keyword rankings (visibility), work completed this period (accountability), and a plan for the next period (direction). Technical health metrics and backlink data are useful additions but should not dominate the report.
How often should you create an SEO report?
Monthly is the standard for most businesses. New campaigns benefit from bi-weekly check-ins during the first 3 months. Enterprise clients with large budgets often receive weekly summaries. The key is reporting when there is meaningful data to discuss, not on an arbitrary schedule.
How do you show SEO ROI in a report?
Calculate traffic cost equivalent (what your organic traffic would cost as PPC), organic conversion value (revenue attributed to organic visitors), and cost per organic acquisition (SEO spend divided by organic conversions). These 3 numbers prove SEO value in terms any business owner understands.
What are the best tools for SEO reporting?
Google Search Console (free, essential), Google Analytics 4 (free, essential), and one paid tool for rank tracking and competitive data. Ahrefs and Semrush are the industry standards. For budget-conscious teams, SE Ranking and Ubersuggest provide solid reporting at lower cost.
What is the difference between SEO metrics and SEO KPIs?
Metrics are any measurable data point (impressions, bounce rate, page speed). KPIs are the specific metrics tied to your business goals. If your goal is lead generation, “organic leads per month” is a KPI. “Total impressions” is just a metric. Reports should focus on KPIs with metrics as supporting context.
SEO reporting is what separates businesses that invest in SEO from businesses that waste money on SEO. The difference is measurement. Track the right metrics, present them clearly, and tie every data point back to business outcomes.
Skip the agency. Keep the results. Stacc starts at $99 per month with a $1 trial. 30 articles. Published automatically. Performance tracked. Start for $1 →
Written and published by Stacc. We publish 3,500+ articles per month across 70+ industries. All data verified against public sources as of March 2026.
