Social Media Statistics 2026: 75+ Facts and Figures
75+ social media statistics for 2026 — all sourced and verified. Users, engagement, ad spend, AI adoption, and social commerce data. Updated March 2026.
Siddharth Gangal • 2026-03-30 • Content Strategy
In This Article
Last updated: March 2026
5.66 billion people now use social media worldwide. That is 68.7% of the global population. Social media users grew by 256 million in the past 12 months alone.
Finding current social media statistics is harder than it should be. Most roundups recycle the same 2024 data. Others cite sources that no longer exist.
This page compiles 75+ social media statistics for 2026, all sourced from original research by DataReportal, Statista, Sprout Social, Hootsuite, HubSpot, Pew Research, and other authoritative sources. Every stat includes its source and year.
We publish 3,500+ social media posts and blog articles across 70+ industries every month. These numbers inform how we build content strategies for our clients.
Here is what the data covers:
- Global usage and growth trends
- Platform-specific user counts and demographics
- Engagement rates by platform
- Advertising spend and benchmarks
- Video, social commerce, and AI adoption stats
Global Social Media Usage Statistics
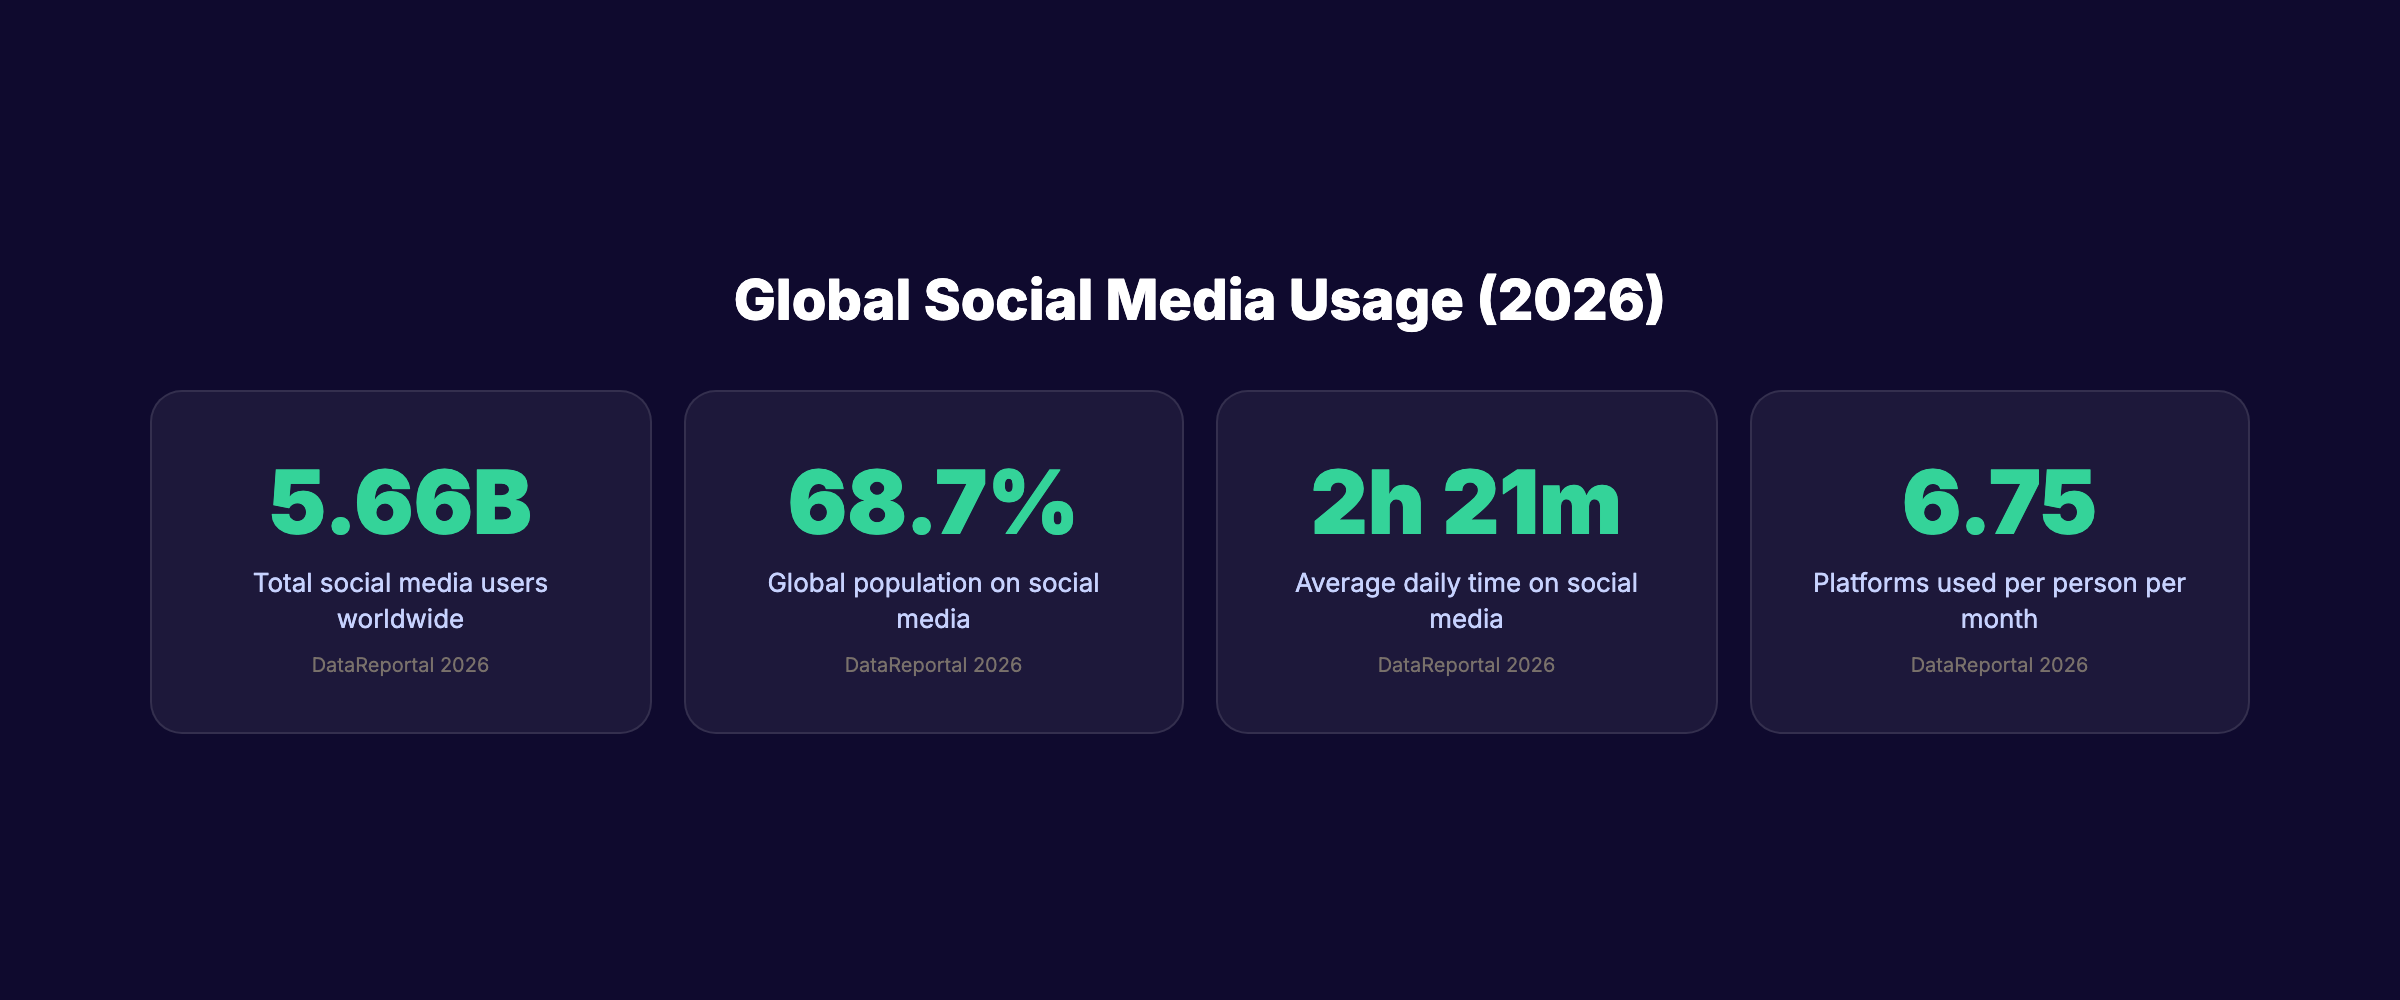
1. 5.66 billion people use social media worldwide in 2026. Source: DataReportal, January 2026 That is 68.7% of the world population. The number grew by 256 million users in the past year.
2. The average person spends 2 hours and 21 minutes per day on social media. Source: DataReportal, 2026 Daily time has remained stable since 2023, suggesting social media usage has reached a plateau in mature markets.
3. The average user accesses 6.75 different social media platforms per month. Source: DataReportal, 2026 Multi-platform usage means brands cannot rely on a single channel. Build a social media calendar that covers at least 3 platforms.
4. 94.5% of internet users are active on social media. Source: DataReportal, 2026 Social media is effectively synonymous with internet use for all practical marketing purposes.
5. Social media now surpasses Google as the primary product discovery channel for consumers under 35. Source: HubSpot State of Marketing, 2026 This shift accelerated in 2025 as TikTok Search and Instagram Shopping matured.
6. 78% of consumers have purchased a product they discovered on social media. Source: Sprout Social, 2026 Social is no longer just awareness. It drives revenue directly.
7. 63% of social media users say they trust recommendations from creators more than brand ads. Source: Hootsuite Social Trends 2026 Creator partnerships outperform paid ads for trust and engagement in most consumer categories.
8. Mobile devices account for 82.9% of all social media usage. Source: Statista, 2026 Every piece of social content must be designed mobile-first. Desktop-first design is a legacy approach.
Platform User Statistics
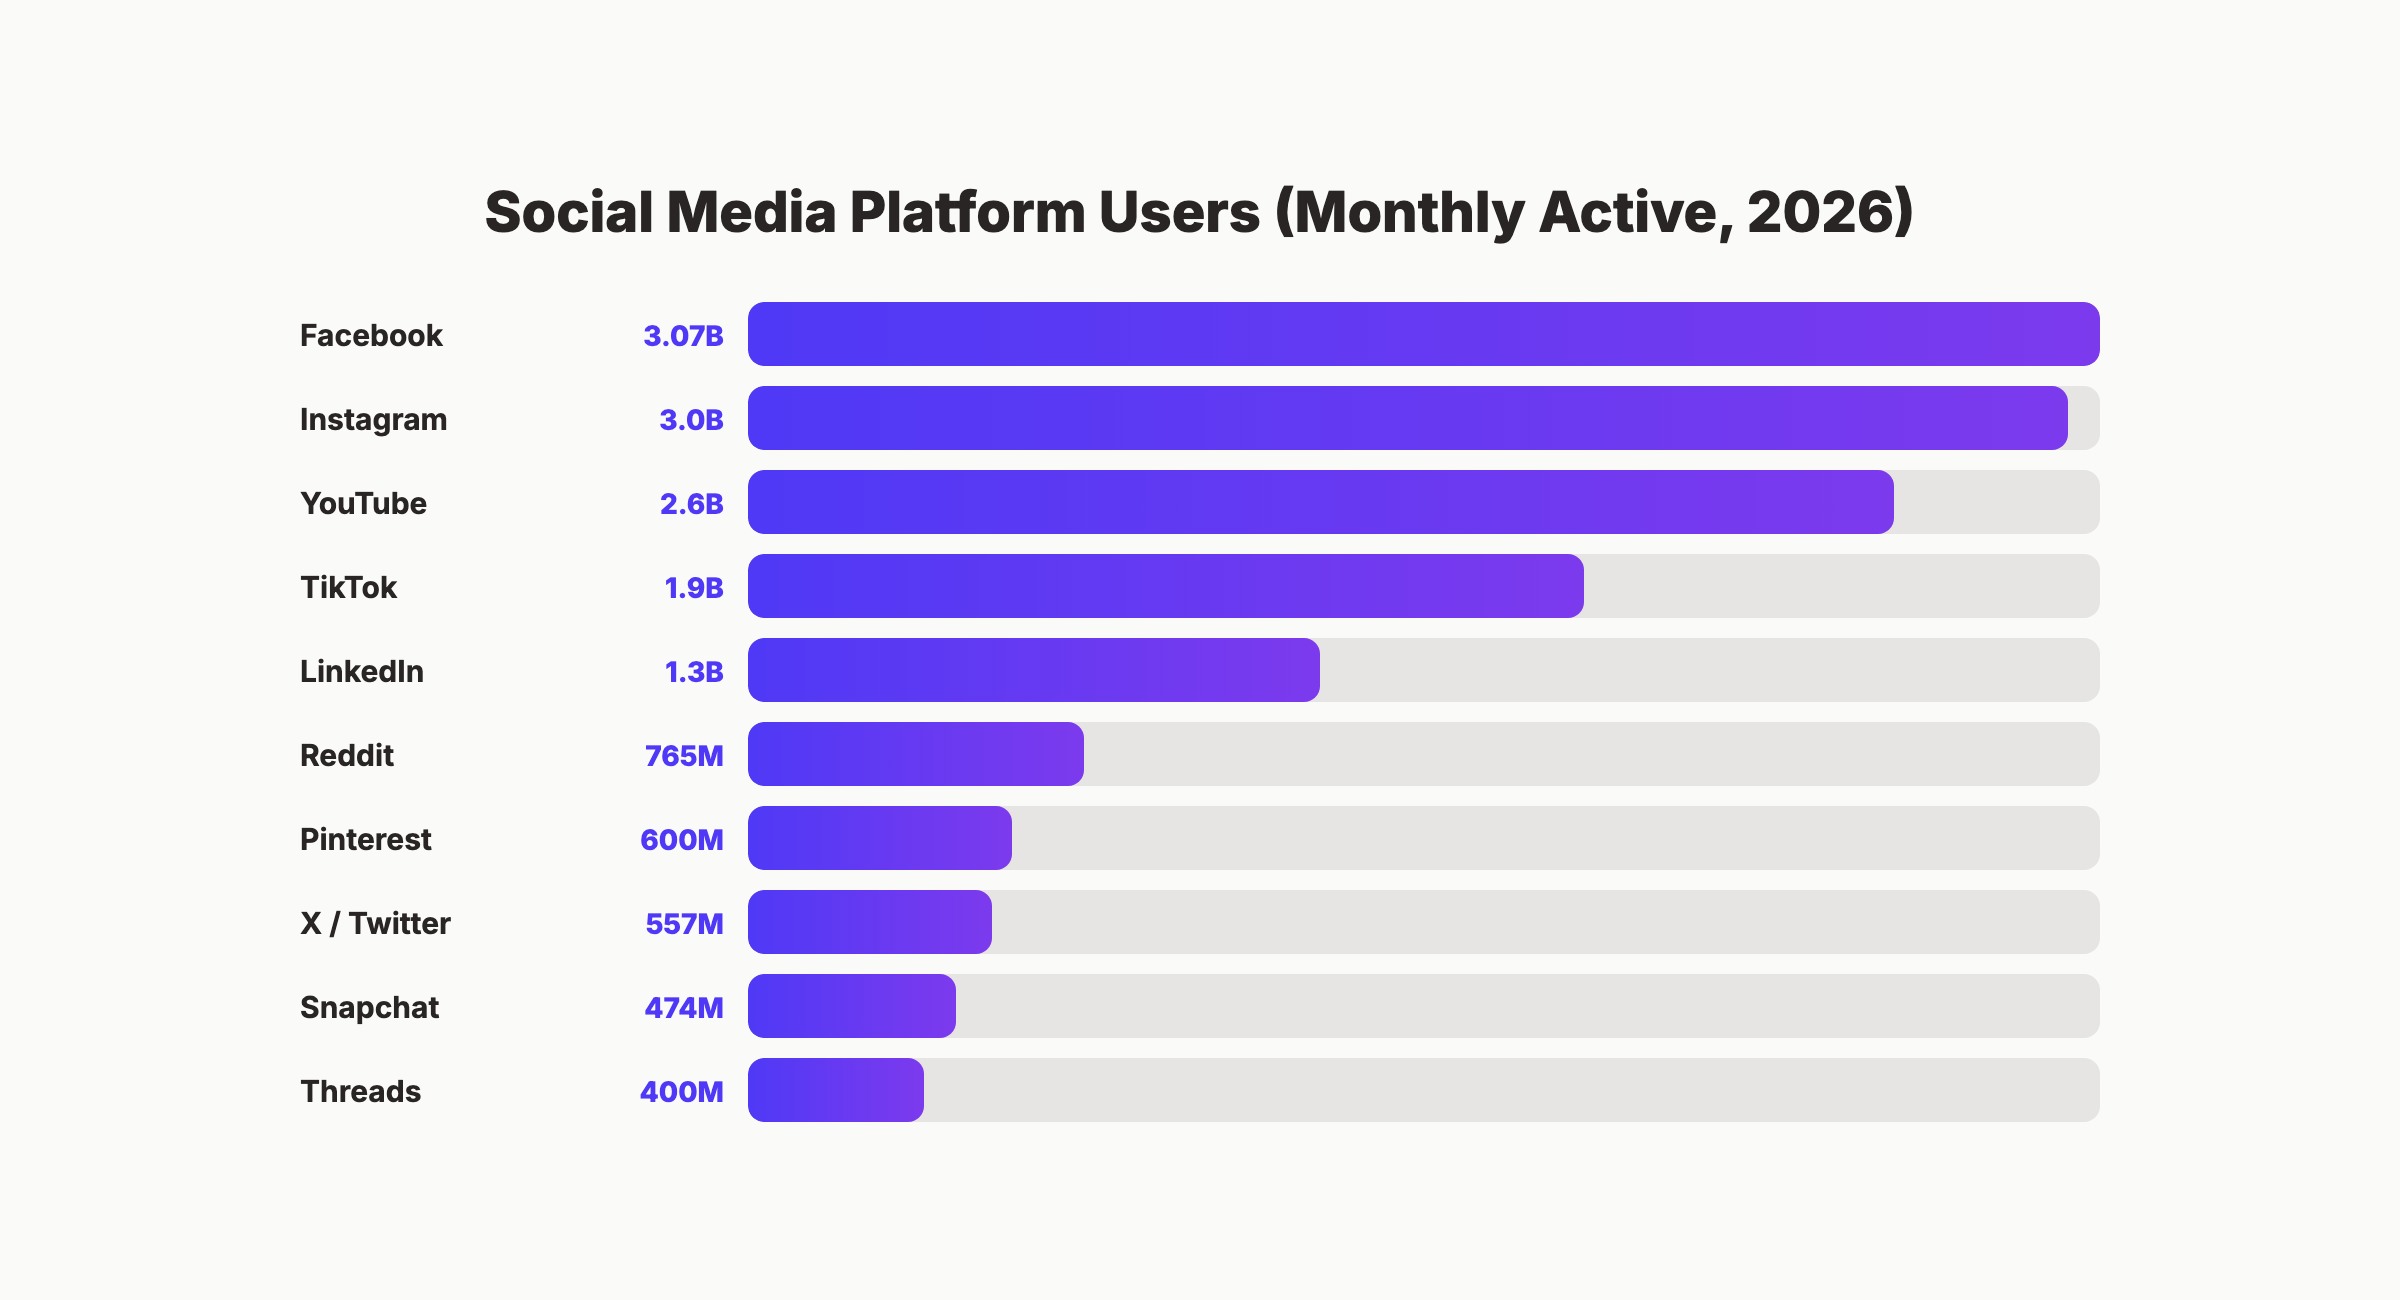
9. Facebook has 3.07 billion monthly active users. Source: Meta Q4 2025 Earnings Facebook remains the largest social platform by total users. Growth is driven by Asia, Africa, and Latin America.
10. Instagram has surpassed 3 billion monthly active users. Source: Meta Q4 2025 Earnings Instagram crossed the 3 billion mark in late 2025. Reels drive 50%+ of time spent on the platform.
11. TikTok has approximately 1.9 billion monthly active users. Source: DataReportal / Business of Apps, 2026 TikTok grew 12% year over year despite regulatory pressure in North America and Europe.
12. YouTube has 2.6 billion monthly active users. Source: Statista, 2026 YouTube Shorts now reaches 2 billion logged-in users monthly, making it a direct competitor to TikTok.
13. LinkedIn has reached 1.3 billion total members. Source: LinkedIn About Page, 2026 LinkedIn remains the dominant platform for B2B social media with the highest organic reach for professional content.
14. X (formerly Twitter) has approximately 557 million monthly active users. Source: DataReportal, 2026 User numbers have stabilized after declines in 2023-2024. Engagement has shifted toward long-form posts and communities.
15. Pinterest has 600 million monthly active users. Source: Pinterest Q4 2025 Earnings Pinterest grew 10% year over year. The platform dominates product discovery in home, fashion, and food categories.
16. Snapchat reaches 474 million daily active users. Source: Snap Q4 2025 Earnings Snapchat remains strongest with the 13-34 age demographic. Spotlight short videos grew 75% year over year.
17. Threads has surpassed 400 million signups. Source: Meta, 2026 Monthly active users are estimated at 100-120 million. Growth slowed after the initial launch surge.
18. Reddit reaches 765 million monthly active users. Source: Reddit Q4 2025 Earnings Reddit is increasingly important for SEO. Google now surfaces Reddit discussions in search results at high frequency.
Stop writing. Start ranking. Stacc publishes 30 SEO articles and social posts per month for $99. No writers. No agencies. Start for $1 →
Social Media Demographics
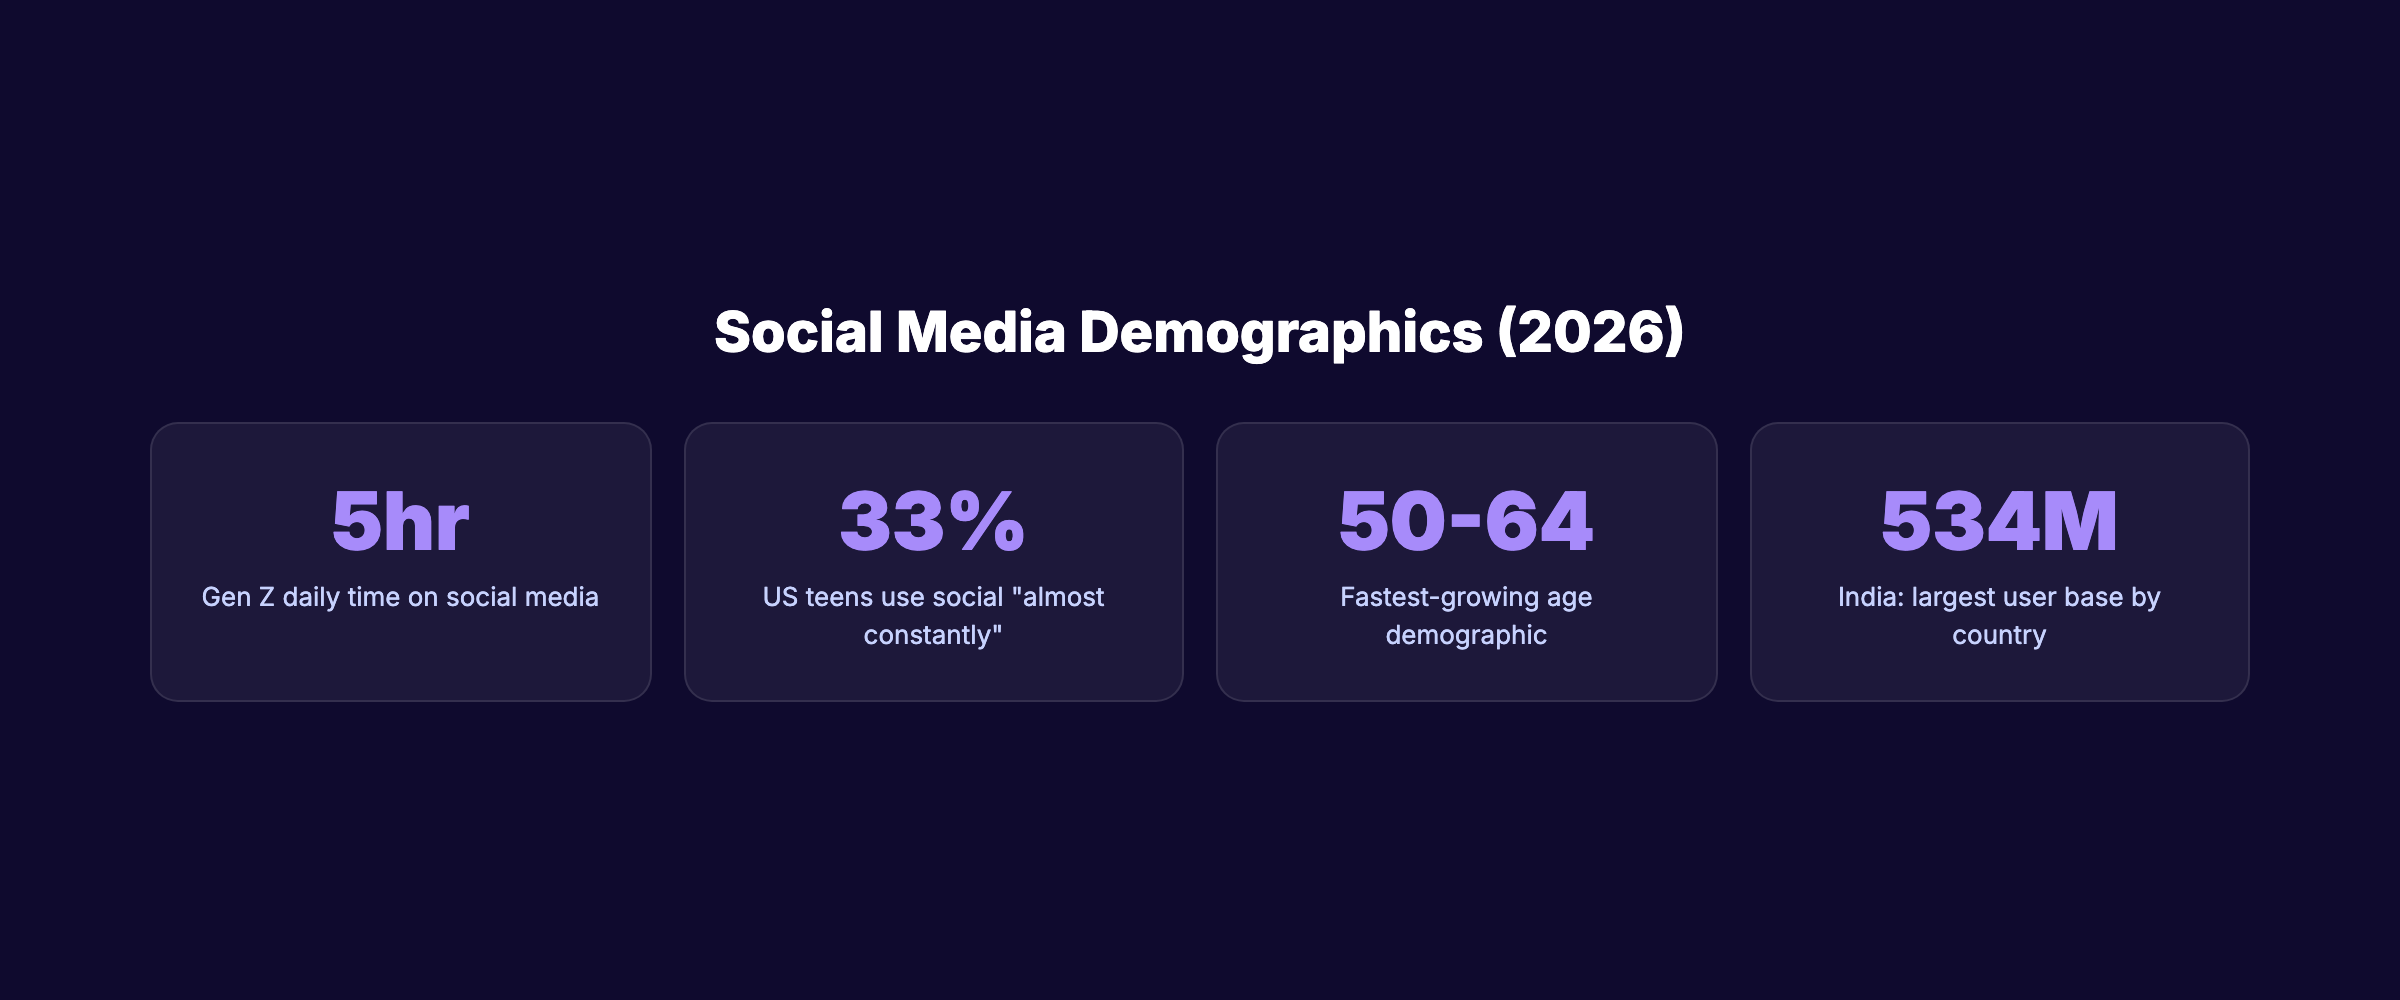
19. Gen Z spends an average of 5 hours per day on social media. Source: GWI, 2026 This is more than double the overall average. Gen Z uses social media as their primary entertainment, news, and shopping channel.
20. 33% of US teenagers say they use social media “almost constantly.” Source: Pew Research Center, 2025 Up from 24% in 2022. The trend toward always-on social usage shows no signs of reversing.
21. Adults ages 50-64 are the fastest-growing social media demographic. Source: Pew Research Center, 2025 Facebook and YouTube drive this growth. Older adults now represent a significant and underserved advertising audience.
22. 54.4% of social media users worldwide are male. 45.6% are female. Source: DataReportal, 2026 The gender gap has narrowed significantly since 2020. Platform-level differences remain larger than the aggregate.
23. India has the largest social media user base at 534 million users. Source: Statista, 2026 India surpassed China (where many global platforms are restricted) as the top market by total users.
24. TikTok skews young: 67% of users are under 35. Source: DataReportal, 2026 The 18-24 age group represents 36% of TikTok users. Brands targeting Gen Z cannot ignore TikTok.
25. LinkedIn users are 60% between the ages of 25 and 34. Source: LinkedIn, 2026 The platform skews toward working professionals in their early career and mid-career stages.
26. 49% of Facebook users are over age 35. Source: Statista, 2026 Facebook is aging. Brands targeting consumers under 25 see better results on TikTok and Instagram.
Engagement Rates by Platform
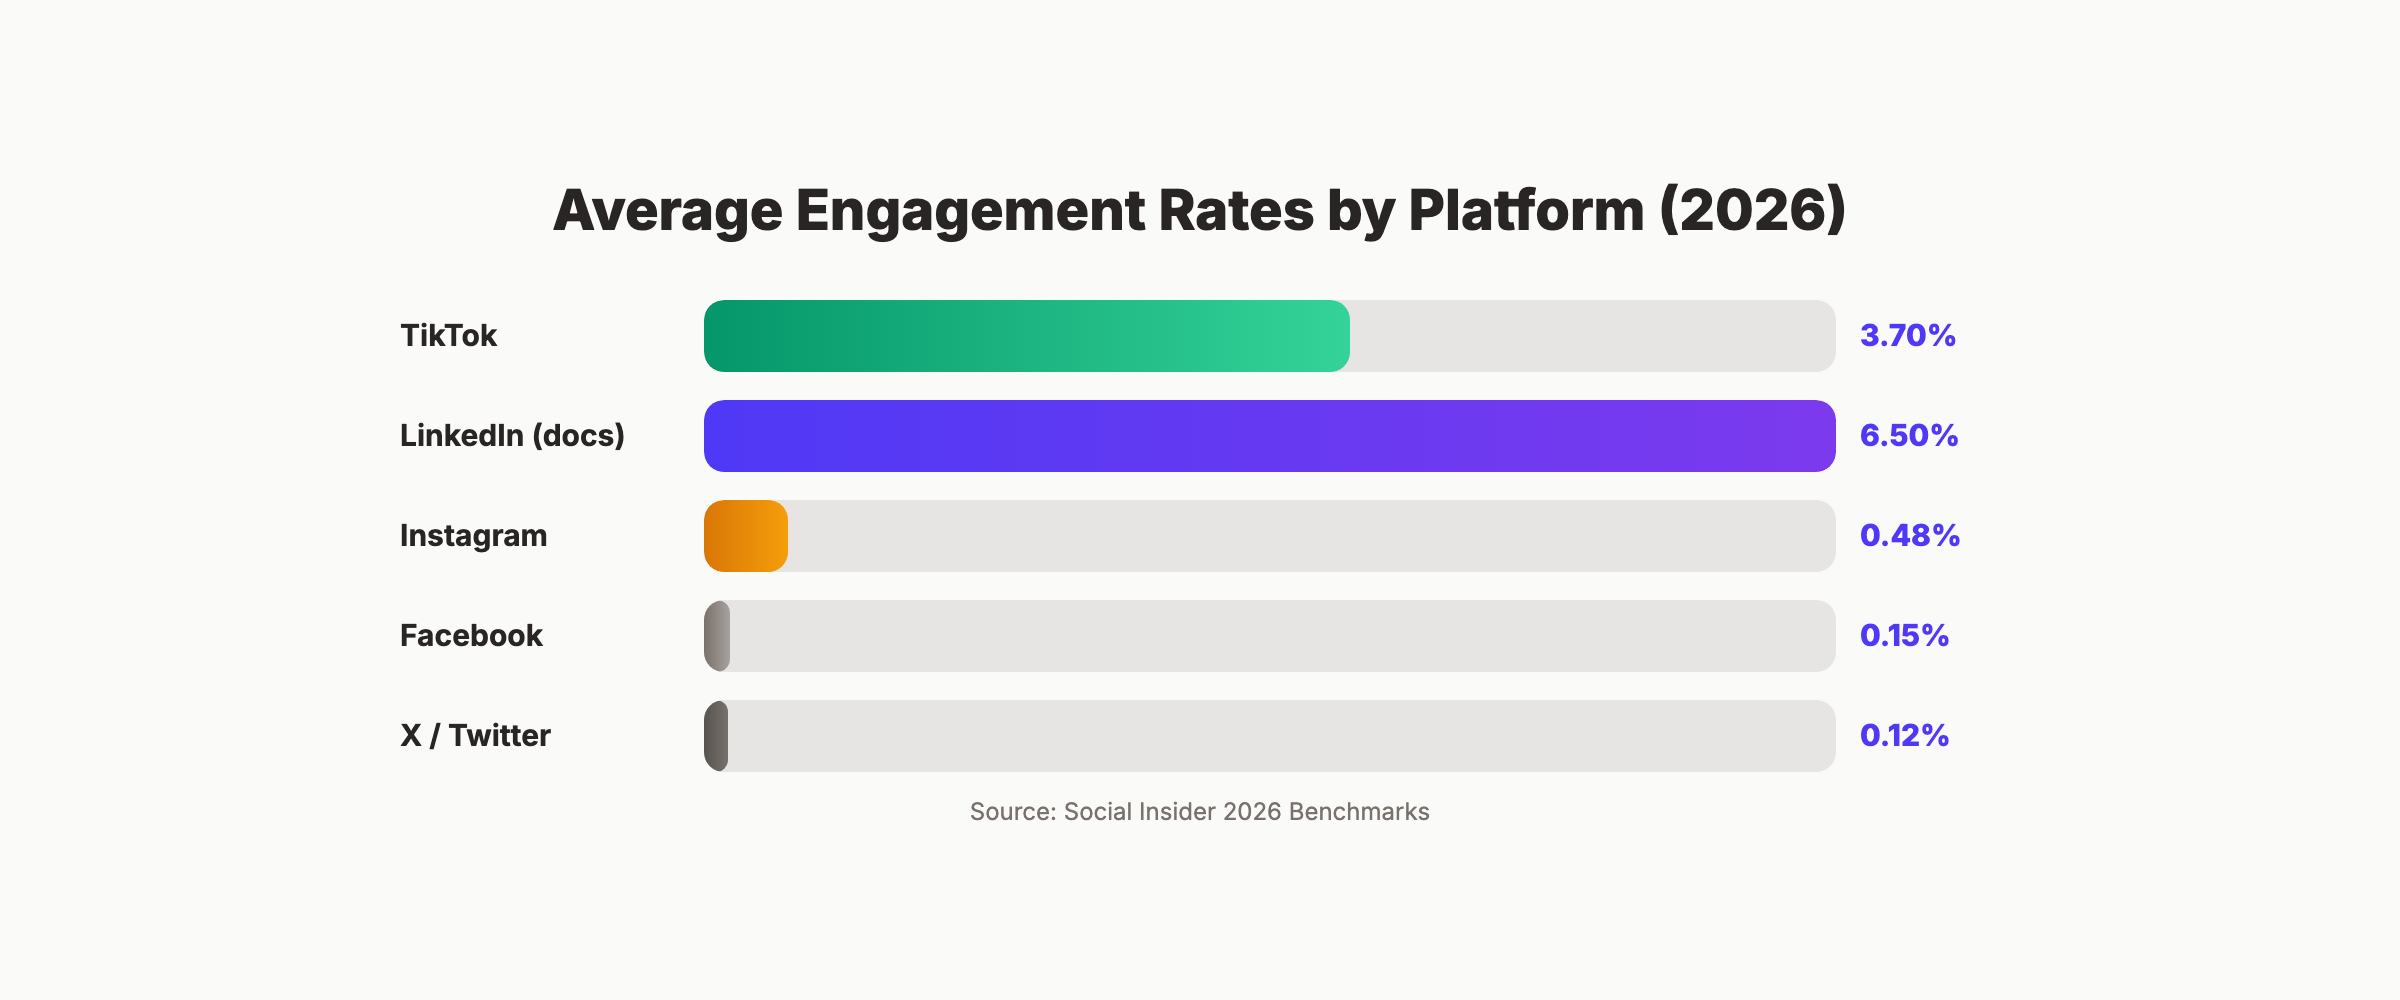
27. TikTok average engagement rate: 3.70% (up 49% year over year). Source: Social Insider, 2026 TikTok dominates engagement across all platforms. Short-form video earns 2.5x more engagement than static posts.
28. LinkedIn average engagement rate: 6.5% for document (carousel) posts. Source: Social Insider, 2026 LinkedIn carousels outperform every other post type on the platform by a wide margin.
29. Instagram average engagement rate: 0.48%. Source: Social Insider, 2026 Reels drive significantly higher engagement (2-3x) compared to static image posts and Stories.
30. Facebook average engagement rate: 0.15%. Source: Social Insider, 2026 Organic reach on Facebook continues to decline. Paid amplification is required for meaningful brand page visibility.
31. X (Twitter) average engagement rate: 0.12%. Source: Social Insider, 2026 X has the lowest average engagement of any major platform. Threads and reply chains outperform standalone posts.
32. Video posts generate 2.5x more engagement than image posts across all platforms. Source: Buffer State of Social Media Engagement, 2026 Every platform algorithm now prioritizes video content. Teams not producing video are competing with a handicap.
33. Posts published between 9 AM and 12 PM local time earn the highest engagement. Source: Hootsuite, 2026 Morning engagement peaks hold across LinkedIn, Facebook, and Instagram. TikTok peaks shift later (6-9 PM).
34. The average organic reach for a Facebook page post is 5.2% of total followers. Source: Hootsuite, 2026 Down from 5.5% in 2024. Brands with social media automation tools publish more consistently, which compounds reach over time.
Your SEO team. $99 per month. 30 optimized articles, published automatically. Social media posts included with the bundle. Start for $1 →
Social Media Marketing Statistics
35. 79% of marketers actively use social media marketing. Source: HubSpot State of Marketing, 2026 Social media is the second most-used marketing channel after email. It outpaces paid search for adoption.
36. 80% of marketers plan to increase their social media budget in 2026. Source: HubSpot, 2026 Budget growth reflects the channel shift from traditional media to digital-first distribution.
37. 73% of marketers say social media marketing has been “somewhat effective” or “very effective” for their business. Source: HubSpot, 2026 The remaining 27% often lack consistent posting schedules or clear content strategies.
38. Social media generates $5.20 in revenue for every $1 spent on advertising. Source: Hootsuite, 2026 ROI varies significantly by platform and industry. Ecommerce sees the highest returns.
39. 76% of consumers expect brands to respond on social media within 24 hours. Source: Sprout Social, 2026 Slow response times drive customers to competitors. 73% of consumers will switch brands after a poor social media experience.
40. Consistent posting (4+ times per week) increases follower growth by 2.5x. Source: Buffer, 2026 Frequency compounds. Social media marketing for local businesses benefits most from daily or near-daily posting.
41. Social media is the number 1 channel for brand discovery among 18-34 year olds. Source: GWI, 2026 Search engines remain dominant for 35+ audiences. Multi-channel presence covers both demographics.
42. 43% of consumers use social media to research products before purchasing. Source: Sprout Social, 2026 Social profiles serve as a second homepage. An outdated or inactive profile loses potential customers.
Social Media Advertising Statistics
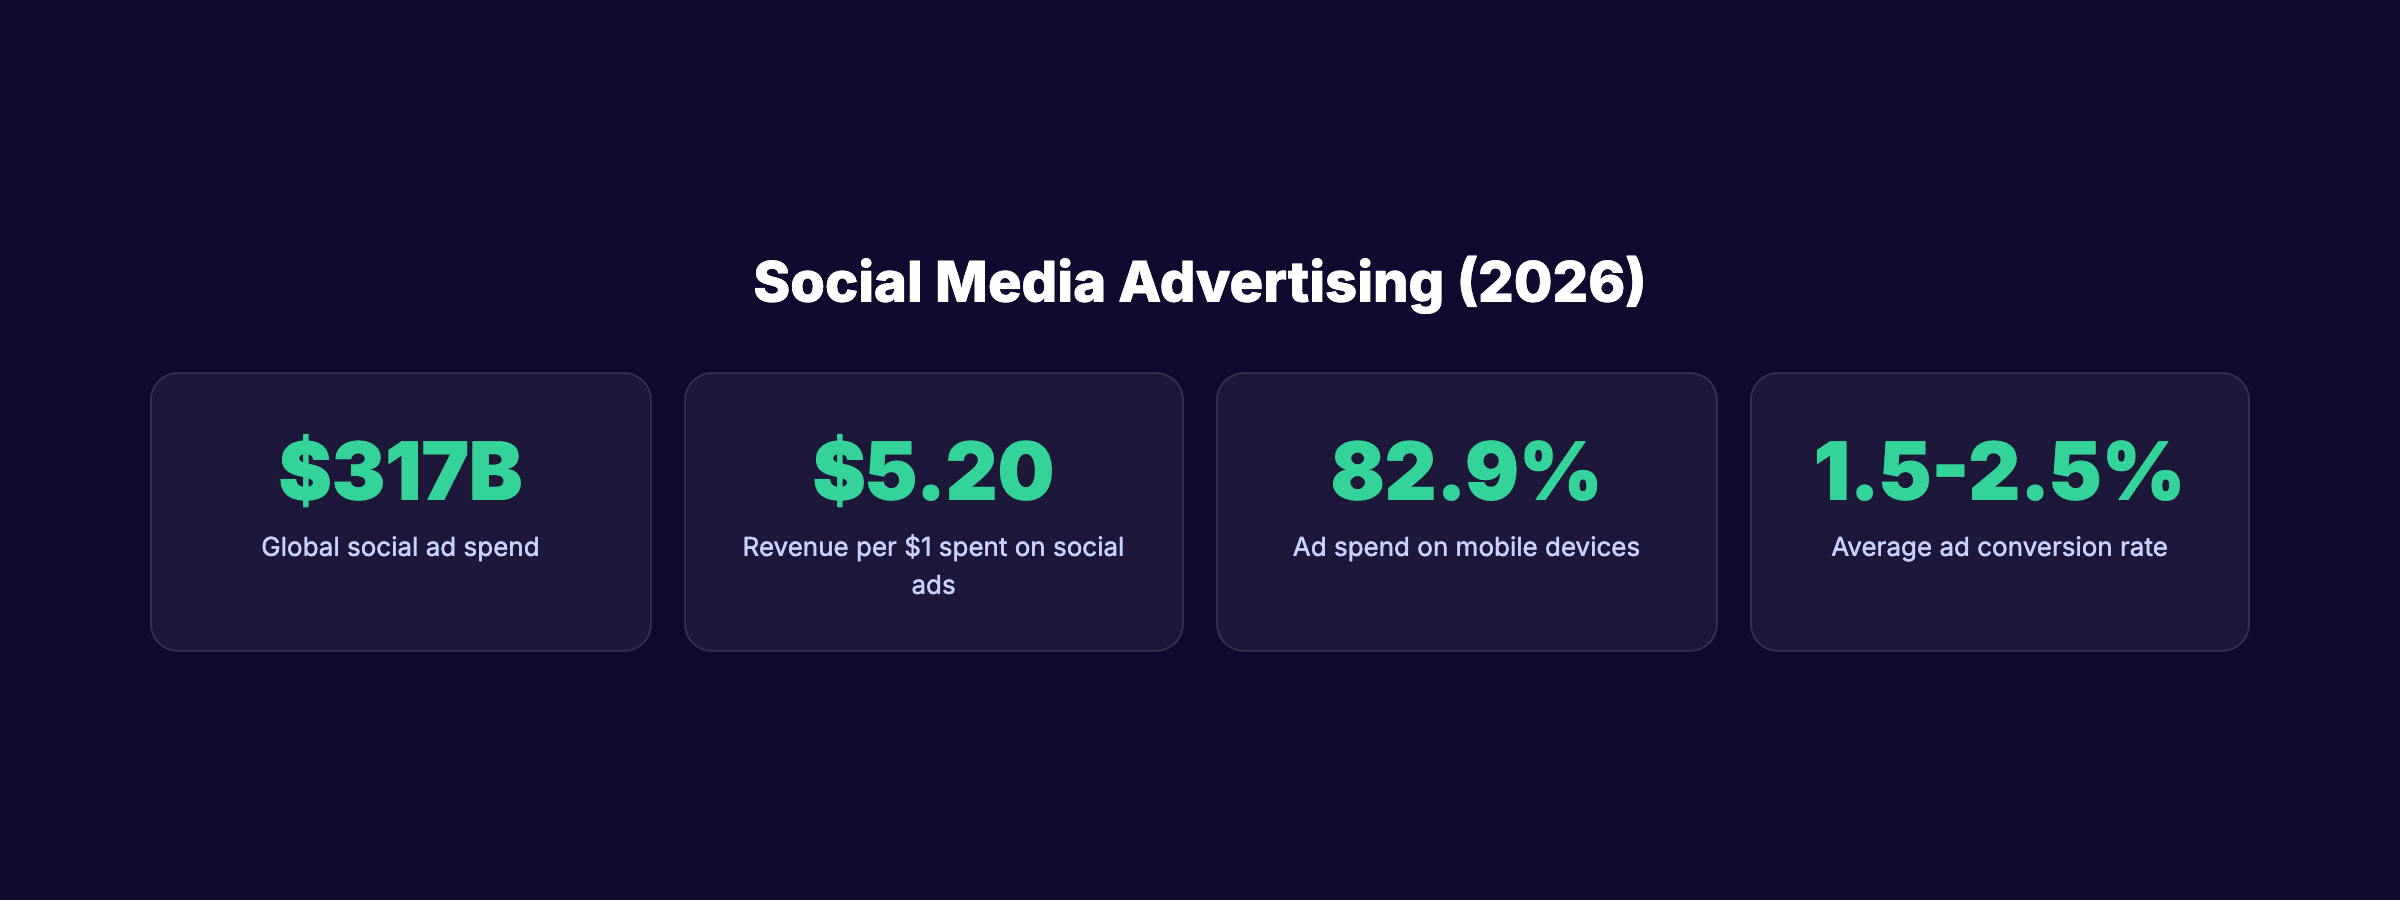
43. Global social media advertising spend reached $317 billion in 2026. Source: Statista, 2026 Social ad spend grew 14% year over year. It now represents 33% of all digital advertising.
44. Facebook/Meta average CPM: $7.19. Source: Revealbot, 2026 CPM varies by industry. Finance and insurance see $15+ CPMs. Retail averages $4-6.
45. Instagram average CPM: $8.30. Source: Revealbot, 2026 Reels ads deliver 20-30% lower CPMs than feed ads, making them the most cost-effective Instagram ad format.
46. TikTok average CPM: $10.00. Source: DataReportal / TikTok for Business, 2026 TikTok CPMs have risen 25% as advertiser demand outpaces inventory. Still delivers strong engagement per impression.
47. LinkedIn average CPC: $5.26. Source: LinkedIn Marketing Solutions, 2026 LinkedIn is the most expensive platform per click. The tradeoff: LinkedIn clicks convert to B2B leads at 3x the rate of other platforms.
48. Average Facebook ad click-through rate: 0.90%. Source: WordStream, 2026 CTR has declined year over year as feed saturation increases. Creative quality and targeting precision matter more than ever.
49. Social media ad revenue on mobile devices accounts for 82.9% of total social ad spend. Source: Statista, 2026 Mobile-first ad creative is non-negotiable. Vertical video (9:16) outperforms horizontal by 40% on mobile.
50. The average conversion rate for social media ads is 1.5-2.5%. Source: WordStream, 2026 Ecommerce conversions average higher (2.5-4%). B2B lead generation averages lower (0.8-1.5%).
Video and Short-Form Content Statistics
51. 85% of marketers say short-form video is the most effective content format. Source: HubSpot, 2026 Short-form video (under 60 seconds) outperforms every other format for engagement and reach.
52. YouTube Shorts now reaches 2 billion logged-in users monthly. Source: YouTube Blog, 2026 Shorts has become a primary content format. It is no longer a secondary feature behind long-form video.
53. TikTok users watch an average of 95 minutes of content per day. Source: Business of Apps, 2026 That is more time per day than Netflix (62 minutes) in most markets. The attention is on short-form video.
54. Instagram Reels account for 50%+ of time spent on Instagram. Source: Meta Q4 2025 Earnings Reels transformed Instagram from a photo app to a video-first platform. Static image posts earn declining reach.
55. Live streams on social media generate a 30% conversion rate for ecommerce. Source: McKinsey, 2025 Live shopping events combine entertainment with direct purchase. China leads adoption. Western markets are catching up.
56. 66% of consumers have watched a brand video on social media in the past month. Source: Sprout Social, 2026 Brand video is expected, not optional. Teams that do not produce video content miss the majority of social reach.
57. Average watch time for social media videos under 60 seconds is 82%. Source: Buffer, 2026 Short videos hold attention. Long videos (over 3 minutes) average only 34% completion rate on social feeds.
3,500+ blogs published. 92% average SEO score. See what Stacc can do for your site and social presence. Start for $1 →
Social Commerce Statistics
58. The global social commerce market reached $2.11 trillion in 2026. Source: Statista, 2026 Social commerce is no longer a niche. It represents a significant share of global ecommerce.
59. TikTok Shop generated $23.4 billion in gross merchandise value in 2025. Source: Bloomberg, 2025 TikTok Shop grew nearly 4x year over year. It is now the fastest-growing social commerce platform.
60. The US social commerce market exceeded $100 billion in 2025. Source: eMarketer, 2025 Instagram Shopping and TikTok Shop drive the majority of US social commerce revenue.
61. 40% of Gen Z consumers prefer to shop directly on social media platforms. Source: GWI, 2026 Social shopping is a generational shift. Younger consumers bypass traditional ecommerce for in-app purchases.
62. Instagram Shopping is used by 130 million users monthly. Source: Meta, 2026 Product tagging in posts and Reels drives discovery. Shoppable content earns 25% higher click-through than non-shoppable.
63. 58% of social media users have made an impulse purchase from a social ad. Source: Sprout Social, 2026 Social media shortens the purchase funnel. Discovery to purchase can happen in a single session.
AI and Social Media Statistics
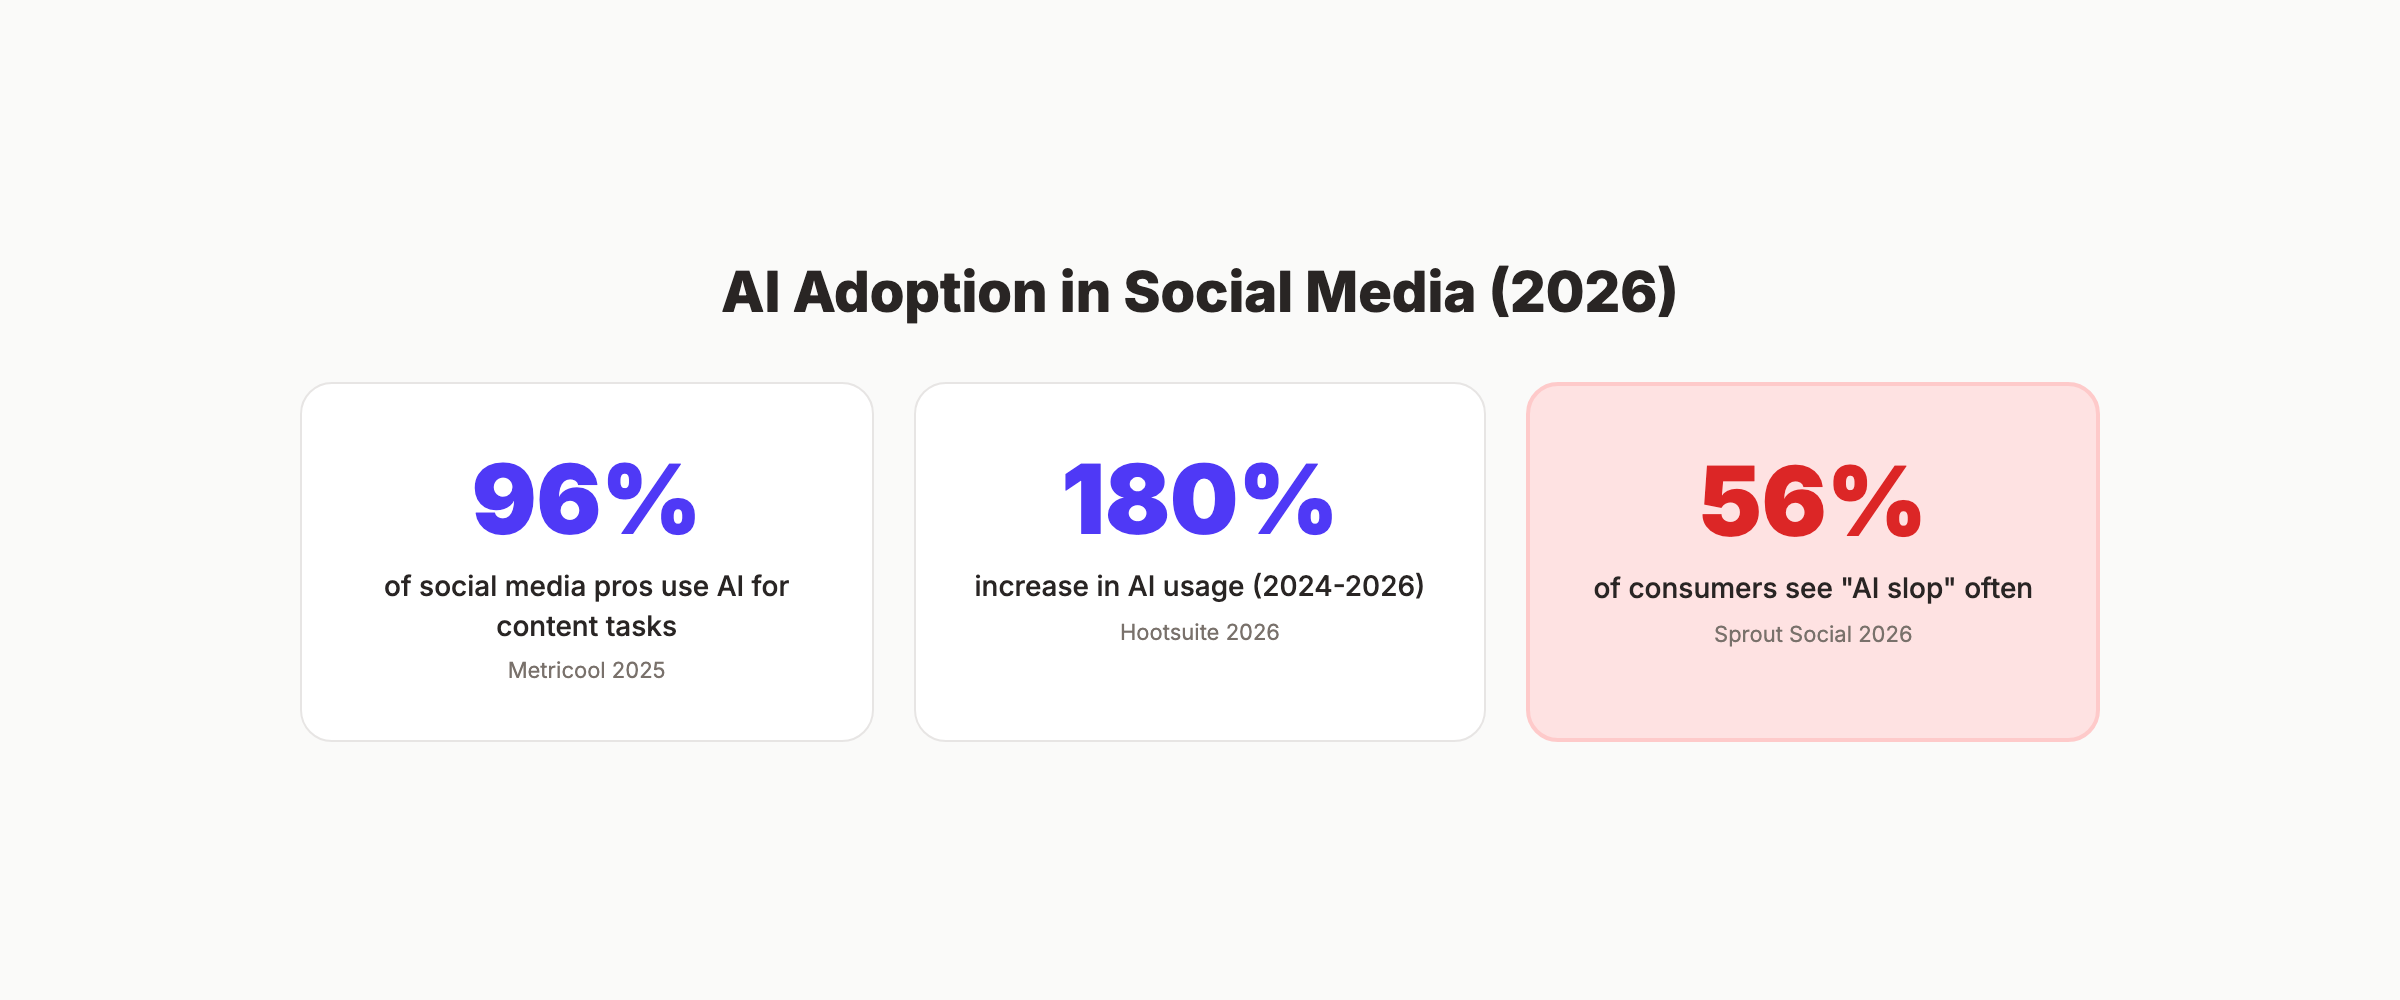
64. 96% of social media professionals now use AI for content tasks. Source: Metricool Social Media AI Report, 2025 AI adoption in social media went from niche to standard practice in under 2 years.
65. AI usage in social media marketing increased 180% between 2024 and 2026. Source: Hootsuite, 2026 The increase reflects both new tool availability and growing comfort with AI-assisted workflows.
66. 78% of social media professionals use AI primarily for brainstorming post ideas. Source: Metricool, 2025 Ideation is the top use case. Content writing (62%) and scheduling optimization (45%) follow. Learn how to create AI social media posts that sound human.
67. 65% of social media professionals use AI for at least half of their posts. Source: Metricool, 2025 AI is not a supplementary tool anymore. It is the primary production method for most teams.
68. 56% of consumers see “AI slop” on social media often or very often. Source: Sprout Social 2026 Content Strategy Report Quality control matters. AI-generated content without human editing drives audience rejection.
69. 50% of Gen Z have blocked, muted, or unfollowed a brand for posting AI-generated content. Source: Sprout Social, 2026 The youngest audience is the most sensitive to inauthentic content. Editing and brand voice training are essential.
70. AI-assisted teams deliver social media content 84% faster than manual-only teams. Source: Monday.com, 2026 Speed is the primary benefit. But speed without quality control leads to the engagement problems in stats 68 and 69.
B2B Social Media Statistics
71. LinkedIn generates 80% of all B2B leads from social media. Source: LinkedIn Marketing Solutions, 2026 No other platform comes close for B2B lead generation. LinkedIn is the default B2B social channel.
72. 75% of B2B buyers use social media to make purchasing decisions. Source: IDC, 2025 B2B buying committees research vendors on LinkedIn and industry forums before initiating contact.
73. B2B companies that post weekly on LinkedIn generate 5.6x more followers than those that post monthly. Source: LinkedIn, 2026 Frequency drives compounding growth. This mirrors the pattern in content marketing statistics for blog publishing.
74. The average B2B social media post earns 2x more engagement on LinkedIn than on any other platform. Source: Social Insider, 2026 LinkedIn is where B2B audiences are. Distributing B2B content on consumer platforms wastes budget.
75. 94% of B2B marketers use LinkedIn for content distribution. Source: Content Marketing Institute, 2026 LinkedIn is the most-used content distribution channel for B2B, ahead of email newsletters (87%) and X (67%).
Influencer Marketing Statistics
76. The global influencer marketing industry exceeds $40 billion in 2026. Source: Statista, 2026 The industry grew 30%+ year over year. Micro-influencers (10K-100K followers) drive the fastest growth segment.
77. Influencer marketing delivers $5.78 in revenue for every $1 spent. Source: Influencer Marketing Hub, 2026 ROI varies by platform. Instagram and TikTok influencer partnerships deliver the highest returns.
78. 94% of marketers say influencer marketing outperforms traditional advertising. Source: Influencer Marketing Hub, 2026 Trust drives performance. Audiences trust creator recommendations over brand ads by a wide margin.
79. Micro-influencers (10K-100K followers) generate 60% higher engagement rates than macro-influencers. Source: HubSpot, 2026 Smaller audiences are more engaged. Micro-influencer partnerships also cost 80-90% less per campaign.
80. 67% of brands plan to increase influencer marketing budgets in 2026. Source: Influencer Marketing Hub, 2026 Budget increases reflect proven ROI and growing consumer preference for creator-led content over brand-produced content.
Rank everywhere. Do nothing. Blog SEO, Local SEO, and Social on autopilot. Stacc starts at $99/mo with a $1 trial. Start for $1 →
Key Takeaways
- 5.66 billion people use social media globally. 68.7% of the world population.
- TikTok leads engagement at 3.70% average rate, up 49% year over year.
- Video dominates: 85% of marketers say short-form video is the most effective format.
- Social commerce hit $2.11 trillion globally. TikTok Shop alone generated $23.4 billion.
- 96% of social media professionals use AI for content tasks. 65% use it for half or more of their posts.
- LinkedIn owns B2B: 80% of B2B social leads come from LinkedIn.
- Ad spend reached $317 billion globally. Mobile accounts for 82.9% of that spend.
- Influencer marketing delivers $5.78 per $1 spent. Micro-influencers outperform larger creators by 60% on engagement.
Methodology
Sources: DataReportal, Statista, Meta Earnings Reports, HubSpot State of Marketing 2026, Sprout Social, Hootsuite Social Trends 2026, Pew Research Center, Social Insider, Buffer, Metricool, LinkedIn Marketing Solutions, Influencer Marketing Hub, GWI, eMarketer, McKinsey.
Last updated: March 2026
Note: We update this page quarterly to ensure all statistics remain current. When a stat changes from our original publication, we note the update date inline.
FAQ
What is the most important social media statistic in 2026?
The 5.66 billion global user count (68.7% penetration) is the headline number. For marketers, the most actionable stat is that video posts generate 2.5x more engagement than image posts. Teams not producing video are leaving reach and engagement on the table.
How many people use social media in 2026?
5.66 billion people use social media worldwide as of January 2026, according to DataReportal. That number grew by 256 million in the past 12 months. 94.5% of all internet users are active on at least one social media platform.
Which social media platform has the most users?
Facebook leads with 3.07 billion monthly active users. Instagram follows at 3 billion. YouTube has 2.6 billion. TikTok has approximately 1.9 billion. LinkedIn has 1.3 billion total members.
Which social media platform has the highest engagement rate?
TikTok leads with a 3.70% average engagement rate, up 49% year over year. LinkedIn carousels achieve 6.5% engagement for document posts. Instagram averages 0.48%, Facebook averages 0.15%, and X averages 0.12%.
How often are these social media statistics updated?
We update this page quarterly. Last updated: March 2026. All statistics include their original source and year for verification.
Social media is not slowing down. 256 million new users joined in the past year. Video, AI, and social commerce are reshaping how brands reach and convert customers. The teams that track these numbers and adapt their strategy accordingly will outperform those relying on last year’s playbook.
Written and published by Stacc. We publish 3,500+ articles per month across 70+ industries. All data verified against public sources as of March 2026.
