Measure AI marketing ROI with our 7-step framework. Attribution, true cost tracking, incrementality tests, and CFO-ready dashboards. 2026 guide.
94% of content marketing teams use artificial intelligence in their workflow. Only 19% track AI-specific key performance indicators. That gap is not a measurement problem. It is a budget problem.
When your chief financial officer asks what the AI tools produced, "we saved time" is not an answer. Time is not revenue. Output volume is not revenue. Even click-through rate is not revenue. The only answer that protects your budget is a number that ties AI investment directly to revenue, cost of acquisition, or customer lifetime value.
This guide gives you that number. We have published 3,500+ blog posts across 70+ industries using AI-assisted workflows. Every post ties back to a measurable outcome. Here is the exact seven-step framework we use to measure AI marketing ROI and prove every dollar in the stack earns its place.
Here is what you will learn:
- How to calculate AI marketing ROI with the correct formula (not the standard version)
- The three-layer attribution model that isolates AI contribution from baseline trend
- How to account for every hidden cost, including review labor and training time
- The incrementality test that proves causation, not just correlation
- How to build a CFO-ready dashboard in under 30 minutes
- Six measurement mistakes that invalidate most AI ROI claims
- Real benchmarks by team size, industry, and AI use case
Step 1: Define What "AI Marketing" Means in Your Stack
AI marketing ROI is the measurable financial return generated by artificial intelligence tools and strategies applied to marketing activities, expressed as a ratio of net benefit to total investment. Before you can measure it, you must define which tools, workflows, and outcomes count.
Most teams treat "AI marketing" as a single line item. It is not. Your stack might include generative AI for content production, smart bidding in ad platforms, predictive lead scoring in your customer relationship management system, email personalisation engines, and conversational agents for customer support. Each produces value through a different mechanism. Each requires a different measurement approach.
Specifically, audit your stack against these categories:
- Content production: Large language model tools used for drafting, editing, or optimising blog posts, emails, social updates, and ad copy
- Ad optimisation: Algorithmic bidding, audience expansion, or creative testing in Google Ads, Meta Ads, or programmatic platforms
- Lead scoring and routing: Predictive models that rank prospects or assign them to sales reps
- Email and personalisation: Dynamic content insertion, send-time optimisation, or subject line testing
- Analytics and attribution: AI-assisted media mix modelling, multi-touch attribution, or forecasting
- Customer support: Chatbots or conversational agents that handle inbound queries
Document every tool, its monthly cost, the team members who use it, and the marketing outcome it is meant to influence. This audit becomes your baseline. Without it, you cannot separate AI impact from everything else your team does.
A B2B SaaS company we work with discovered during this audit that three separate tools were all doing predictive lead scoring. Two were redundant. The audit alone saved $18,000 per year before any ROI calculation began.
Why this step matters: If you do not define the perimeter of "AI marketing," every improvement gets credited to AI and every failure gets blamed on something else. That is not measurement. That is storytelling.
Prove every AI dollar drives revenue. theStacc publishes 30 SEO-optimised articles per month for $99. Every post is tracked against organic traffic, leads, and revenue attribution. See how it works.
Step 2: Establish a Pre-AI Baseline for Every Metric
Every return on investment story begins with a baseline. Capture your pre-AI metrics for at least 30 days before introducing any new tool. Without this, improvements look like progress but lack verifiable proof.
The baseline must cover three layers: campaign performance, pipeline impact, and business outcomes. Most teams stop at layer one. That is why 74% of companies have yet to show real return on investment from their AI use.
| Layer | Metrics to Baseline | Measurement Frequency |
|---|---|---|
| Campaign performance | Cost per acquisition, click-through rate, return on ad spend, open rate, conversion rate | Daily |
| Pipeline impact | Marketing qualified leads, sales qualified leads, pipeline velocity, lead-to-close ratio | Weekly |
| Business outcomes | Revenue lift, customer acquisition cost, customer lifetime value, marketing efficiency ratio | Quarterly |
Record each metric for the 30 days before AI introduction. Note any seasonal trends, campaign spikes, or external events that might distort the baseline. If your conversion rate was already improving 0.1% per month and it improves 0.3% after AI, your AI-attributed lift is 0.2%, not 0.3%.
Store this data in a dedicated spreadsheet or dashboard. Do not mix it with post-AI data. The separation is what makes your calculation defensible.
According to HubSpot's 2026 State of Marketing report, only 36% of marketers can accurately measure marketing return on investment. The other 64% lack baselines, attribution models, or both. That is not a skills gap. It is a data gap.
Why this step matters: Skipping the baseline turns every ROI claim into a guess. Your chief financial officer will ask what the numbers looked like before AI. If you do not have that answer, the conversation ends.
Step 3: Apply the Correct AI Marketing ROI Formula
The standard return on investment formula is incomplete for AI marketing. It ignores efficiency gains, compounding effects, and indirect costs. The correct formula adds those back in.
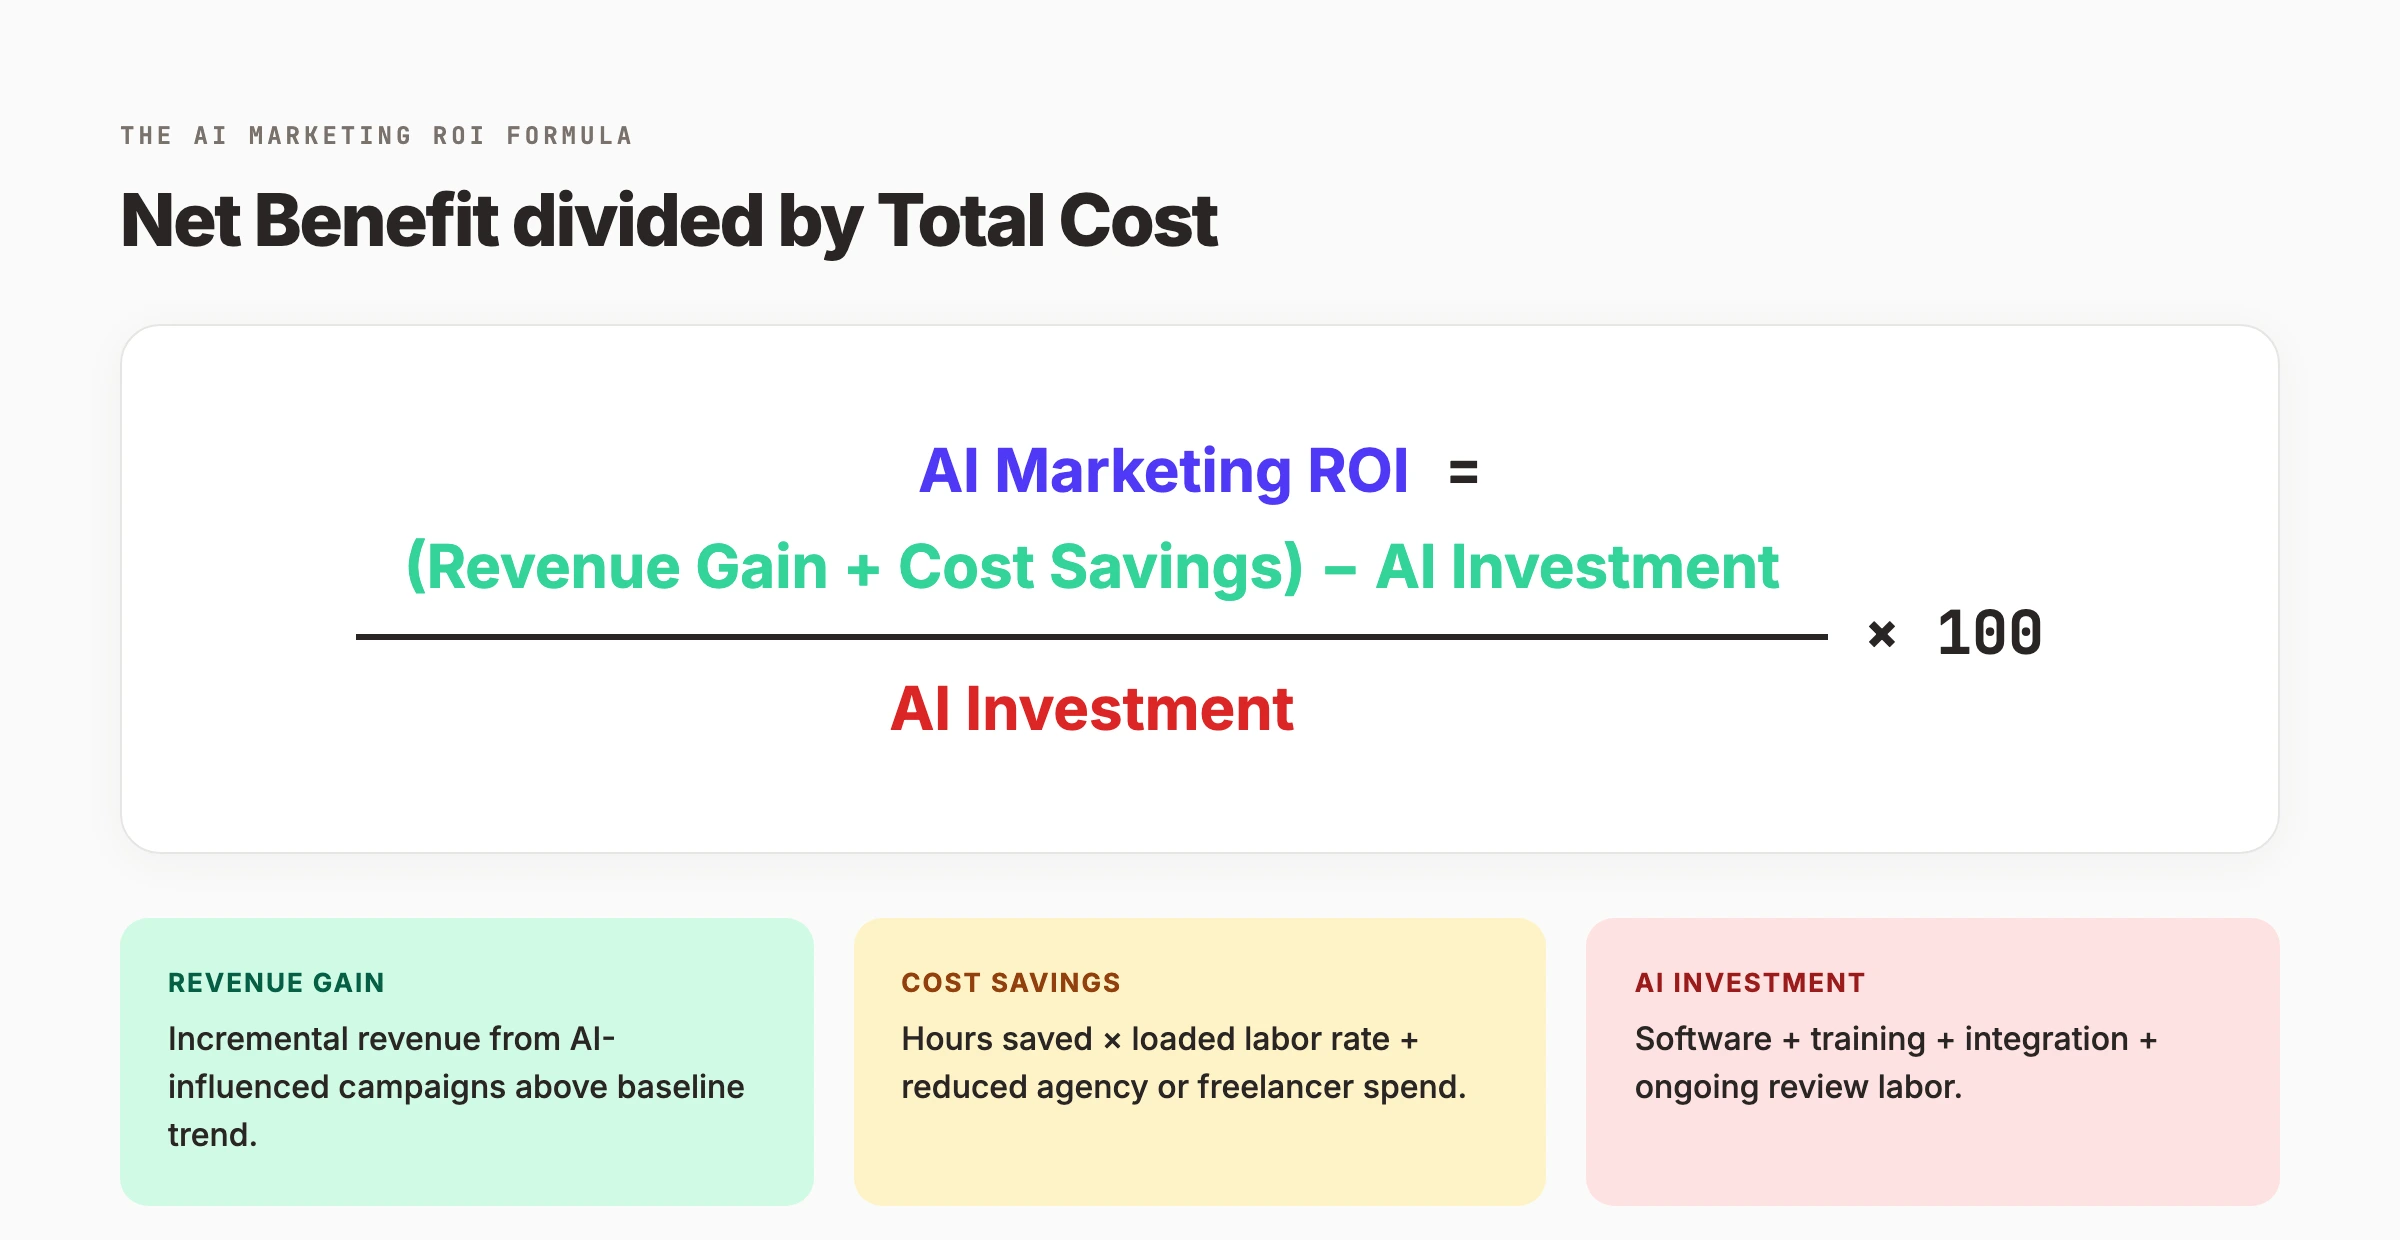
The AI marketing ROI formula:
AI Marketing ROI = [(Revenue Gain + Cost Savings) − AI Investment] ÷ AI Investment × 100Revenue gain is incremental revenue from AI-influenced campaigns above your baseline trend. Not total revenue. Not revenue from campaigns that happen to use AI. Incremental revenue above what you would have earned without AI.
Cost savings is the dollar value of hours saved, multiplied by your loaded labor rate, plus any reduced spend on agencies, freelancers, or contractors. A marketer earning $75,000 per year costs approximately $50 per hour when you include benefits, overhead, and software. If AI saves them 10 hours per week, that is $26,000 per year in recoverable labor cost.
AI investment includes every dollar spent on AI tools, implementation, training, integration, and ongoing human review labor. Most teams underestimate this by 200% to 300%. We cover the full cost breakdown in Step 4.
Here is a worked example. A mid-market company invests $24,000 per year in AI content tools. The tools produce content that drives $96,000 in attributed revenue above baseline. The tools also save 400 hours of marketing labor per year at $55 per hour, worth $22,000. Total benefit is $118,000. Net benefit is $94,000. Return on investment is 392%.
That is a defensible number. It accounts for revenue, efficiency, and total cost. It is also a number your chief financial officer can verify.
Why this step matters: Using the standard formula (revenue minus cost, divided by cost) overstates AI return on investment by 40% to 60% because it ignores efficiency gains and hidden costs. The expanded formula is the only version that survives scrutiny.
Step 4: Account for Every Hidden Cost
Most teams calculate AI cost as the monthly subscription fee. That captures 20% to 30% of the true investment. The rest is hidden in labor, integration, and opportunity cost.
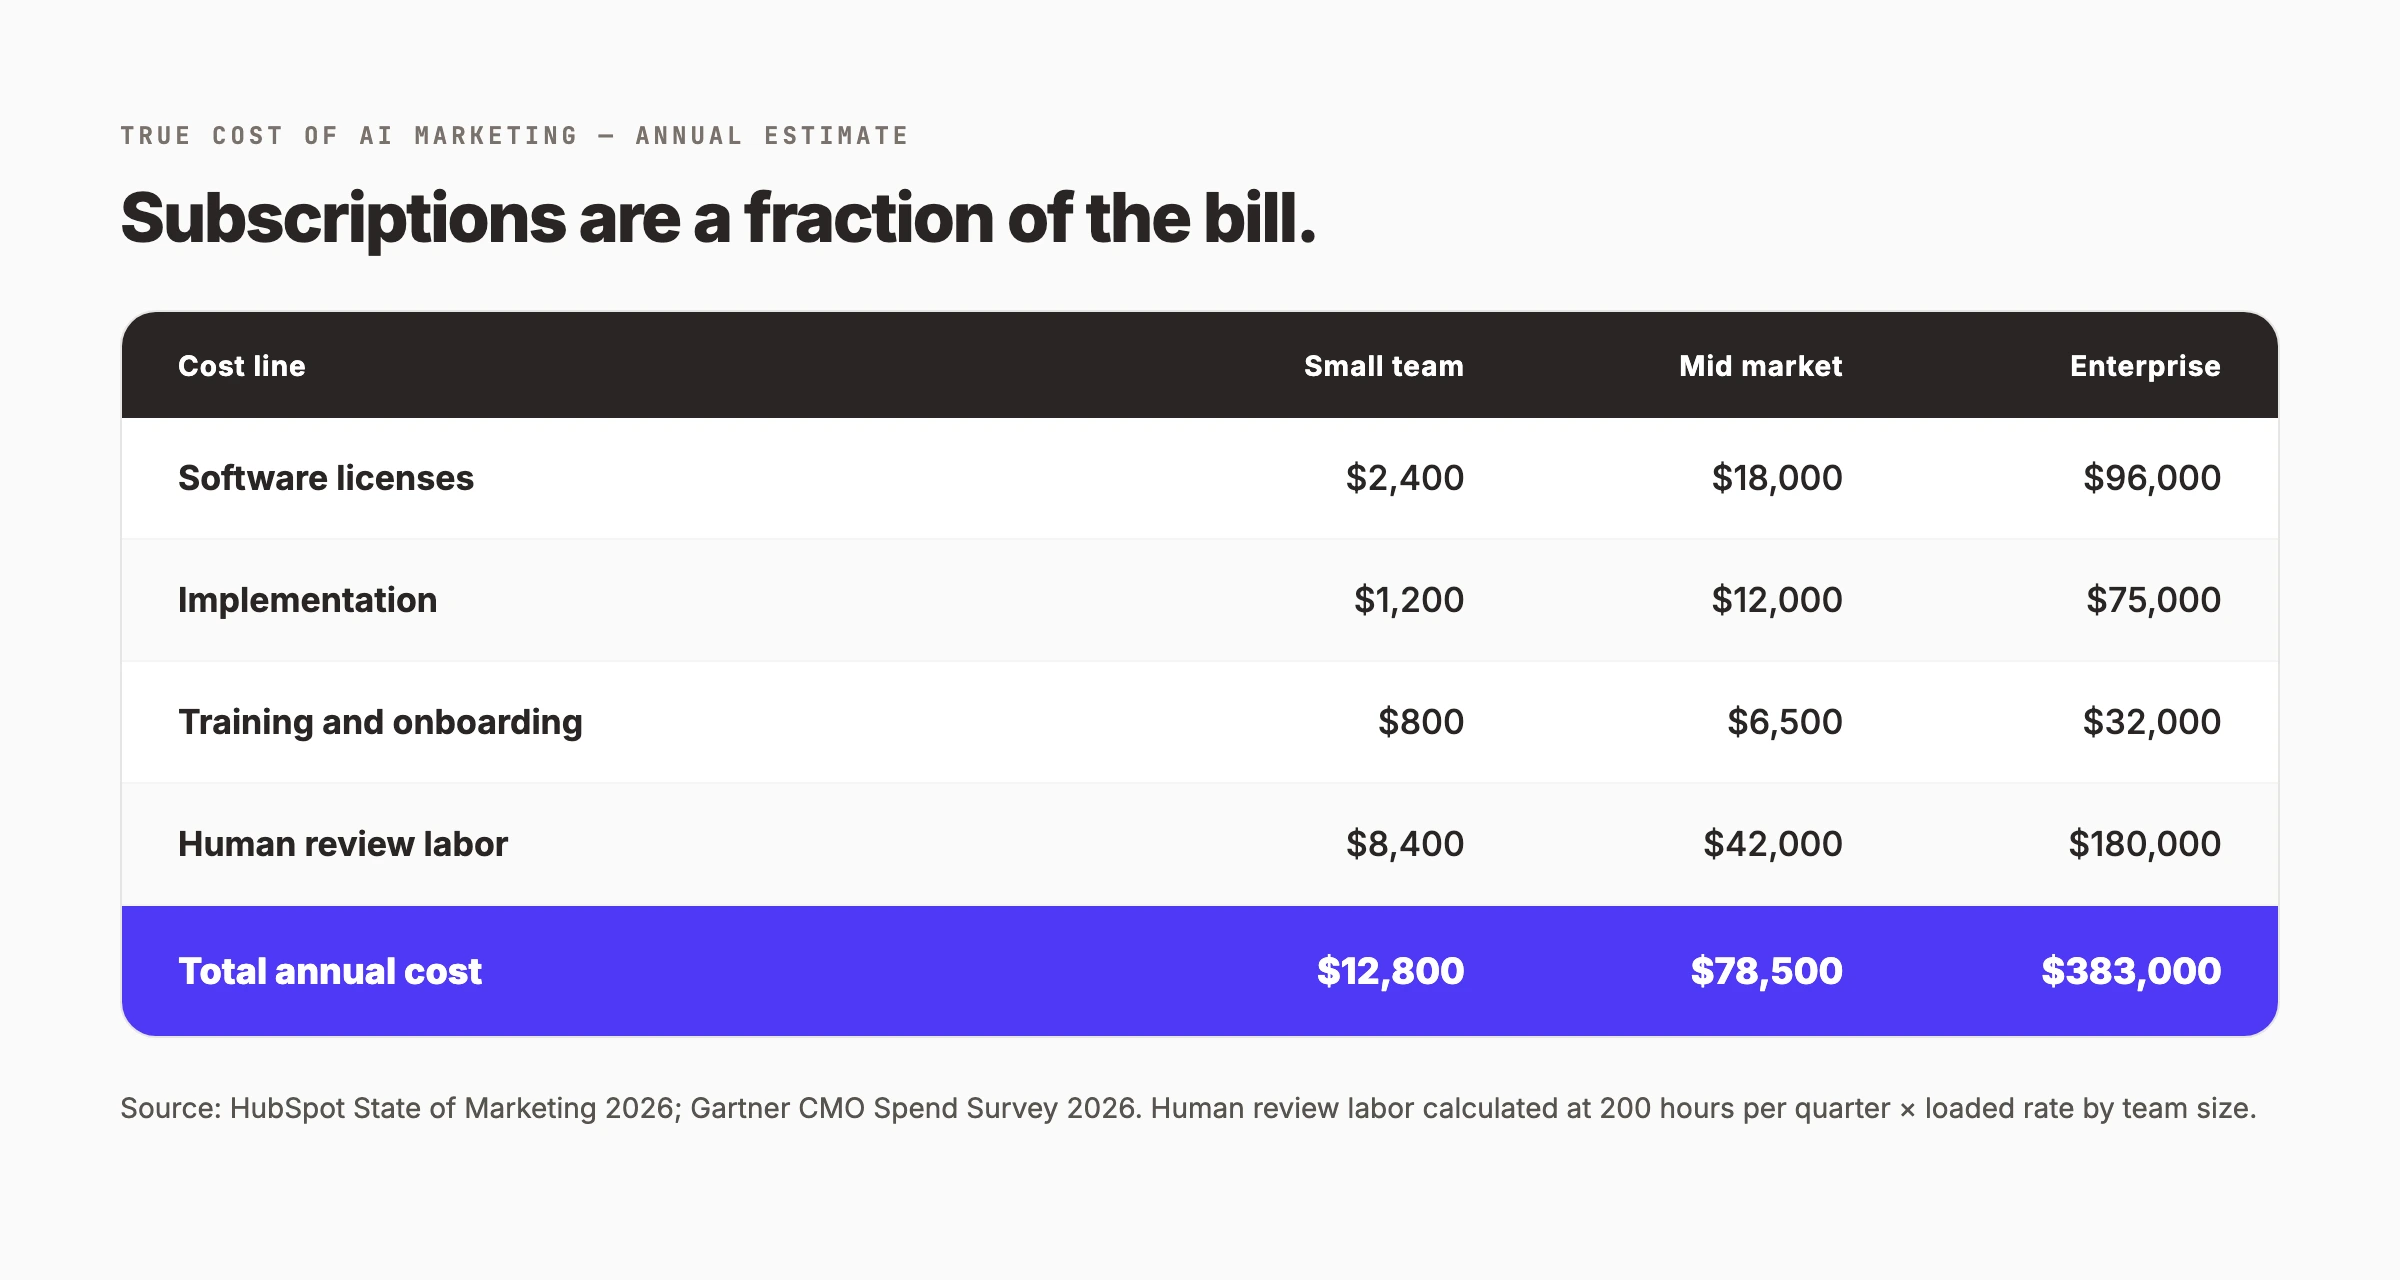
The four cost categories every calculation must include:
1. Software licenses. The subscription fees for every AI tool in your stack. Include annual plans, seat upgrades, and API overage charges. Do not forget tools you stopped using but are still paying for.
2. Implementation and integration. The cost of connecting AI tools to your existing systems. This includes engineering time, data pipeline setup, and any middleware or custom development. A typical HubSpot to AI content tool integration costs $3,000 to $8,000 in developer hours.
3. Training and onboarding. The hours your team spends learning the tool, attending webinars, reading documentation, and experimenting with prompts. At $50 per hour, 40 hours of training is $2,000 per person.
4. Human review and oversight. The time spent editing AI output, checking facts, refining prompts, and managing quality. This is the largest hidden cost. A 2026 Gartner CMO Spend Survey found that marketing teams spend an average of 2.5 hours reviewing AI output for every 1 hour the AI produces.
| Cost Category | Small Team (1–3 marketers) | Mid-Market (4–10) | Enterprise (11–50) |
|---|---|---|---|
| Software licenses | $2,400/year | $18,000/year | $96,000/year |
| Implementation | $1,200/year | $12,000/year | $75,000/year |
| Training and onboarding | $800/year | $6,500/year | $32,000/year |
| Human review labor | $8,400/year | $42,000/year | $180,000/year |
| Total annual cost | $12,800 | $78,500 | $383,000 |
Source: HubSpot State of Marketing 2026; Gartner CMO Spend Survey 2026. Human review labor calculated at 200 hours per quarter multiplied by loaded labor rate by team size.
Why this step matters: If you report AI cost as $2,400 when the true cost is $12,800, your return on investment looks five times better than it is. That number will not survive a budget review.
Step 5: Build a Three-Layer Attribution Model
Attribution is where most AI marketing ROI calculations fail. Last-touch attribution gives 100% credit to the final click. First-touch gives 100% credit to the first click. Both are wrong for AI, which influences every stage of the customer journey.
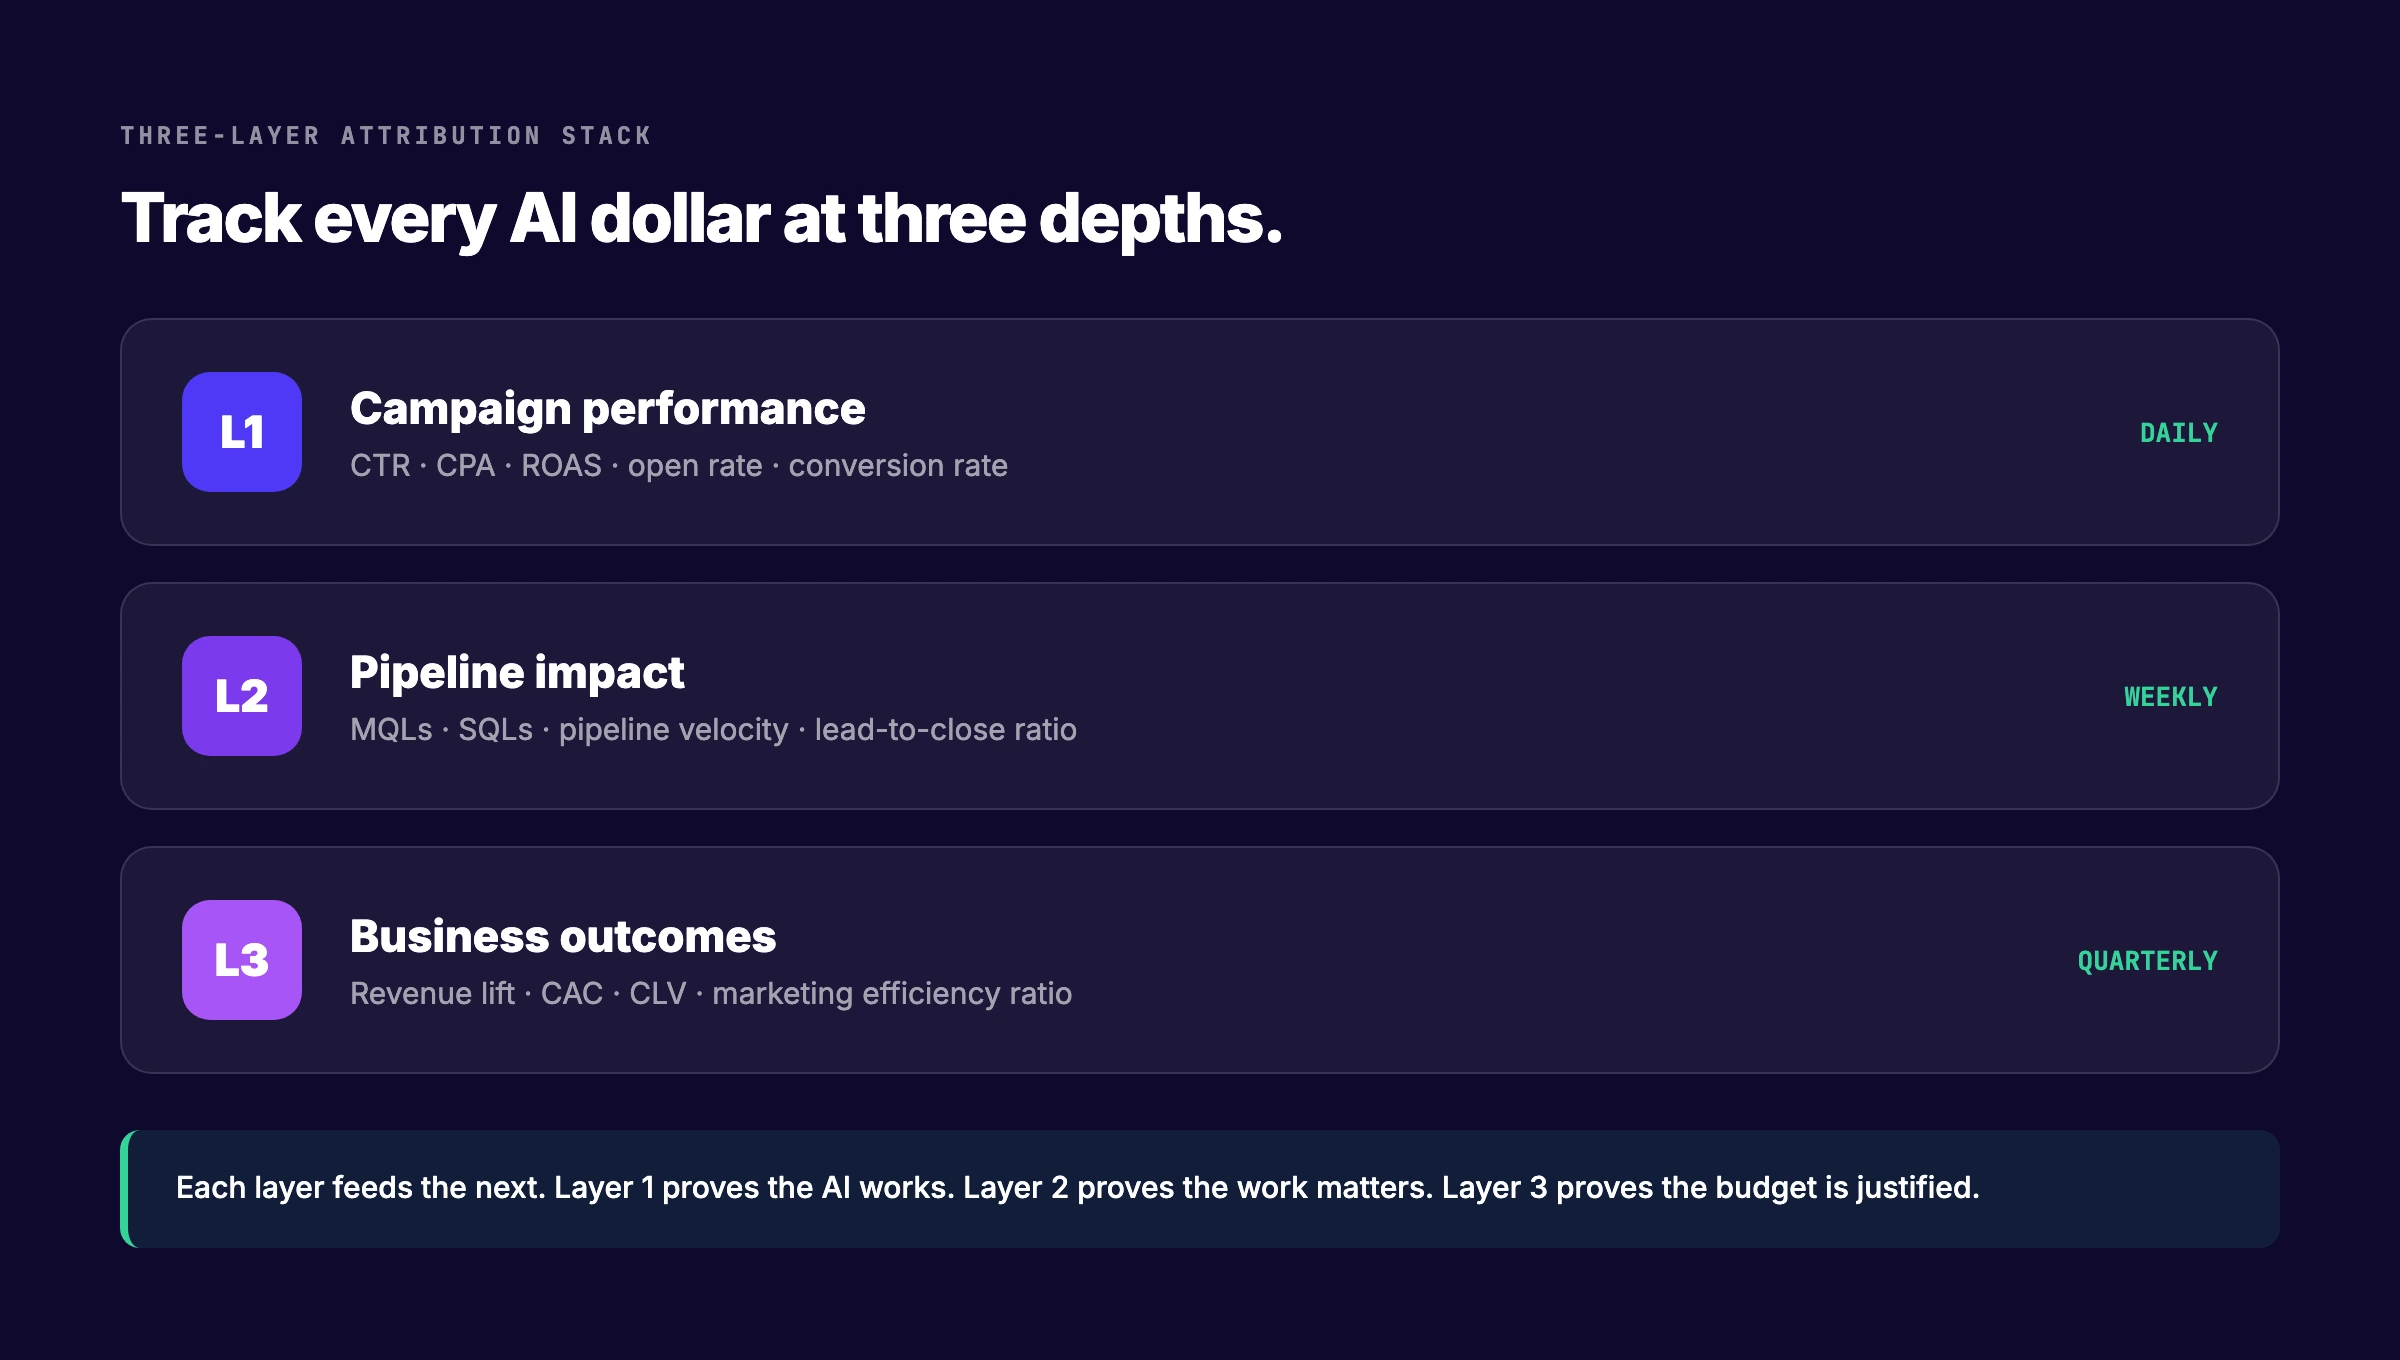
Layer 1: Campaign performance. Track the direct output of AI-influenced campaigns. Click-through rate, cost per acquisition, return on ad spend, open rate, and conversion rate. Measure these daily. They tell you whether the AI is working at the tactical level.
Layer 2: Pipeline impact. Track how AI-influenced campaigns move prospects through your funnel. Marketing qualified leads, sales qualified leads, pipeline velocity, and lead-to-close ratio. Measure these weekly. They tell you whether the tactical improvements translate into pipeline.
Layer 3: Business outcomes. Track the financial impact on your business. Revenue lift, customer acquisition cost, customer lifetime value, and marketing efficiency ratio. Measure these quarterly. They tell you whether the pipeline improvements justify the investment.
Each layer feeds the next. Layer 1 proves the AI works. Layer 2 proves the work matters. Layer 3 proves the budget is justified.
Use these three attribution methodologies together:
- Multi-touch attribution: Distributes credit across every touchpoint in the customer journey. AI excels at this because it can process thousands of data points that traditional models miss.
- Incrementality testing: Runs controlled experiments with an AI group and a non-AI group to isolate causal impact. This is the only method that proves AI caused the improvement, not just that it correlated with it.
- Marketing mix modelling: Uses historical data to estimate the contribution of each marketing channel, including AI-driven ones, to overall revenue. Best for quarterly business outcome measurement.
According to a 2024 McKinsey report, companies using AI in marketing see 20% to 30% higher campaign return on investment compared to traditional methods. But that number only holds when measured through multi-touch attribution or incrementality testing. Last-touch attribution understates AI impact by 35% to 50% because it misses upstream influence.
Why this step matters: Without a multi-layer attribution model, you cannot separate AI contribution from everything else your marketing team does. That makes your ROI number unverifiable and your budget vulnerable.
Track AI marketing ROI without spreadsheets. theStacc's analytics layer connects every article to traffic, leads, and revenue. Try the SEO ROI calculator to see your potential return.
Step 6: Run Incrementality Tests to Prove Causation
Correlation is not causation. Your conversion rate might have improved because of a seasonal trend, a competitor going quiet, or a new landing page you launched the same week as your AI tool. Incrementality testing isolates AI's true contribution.
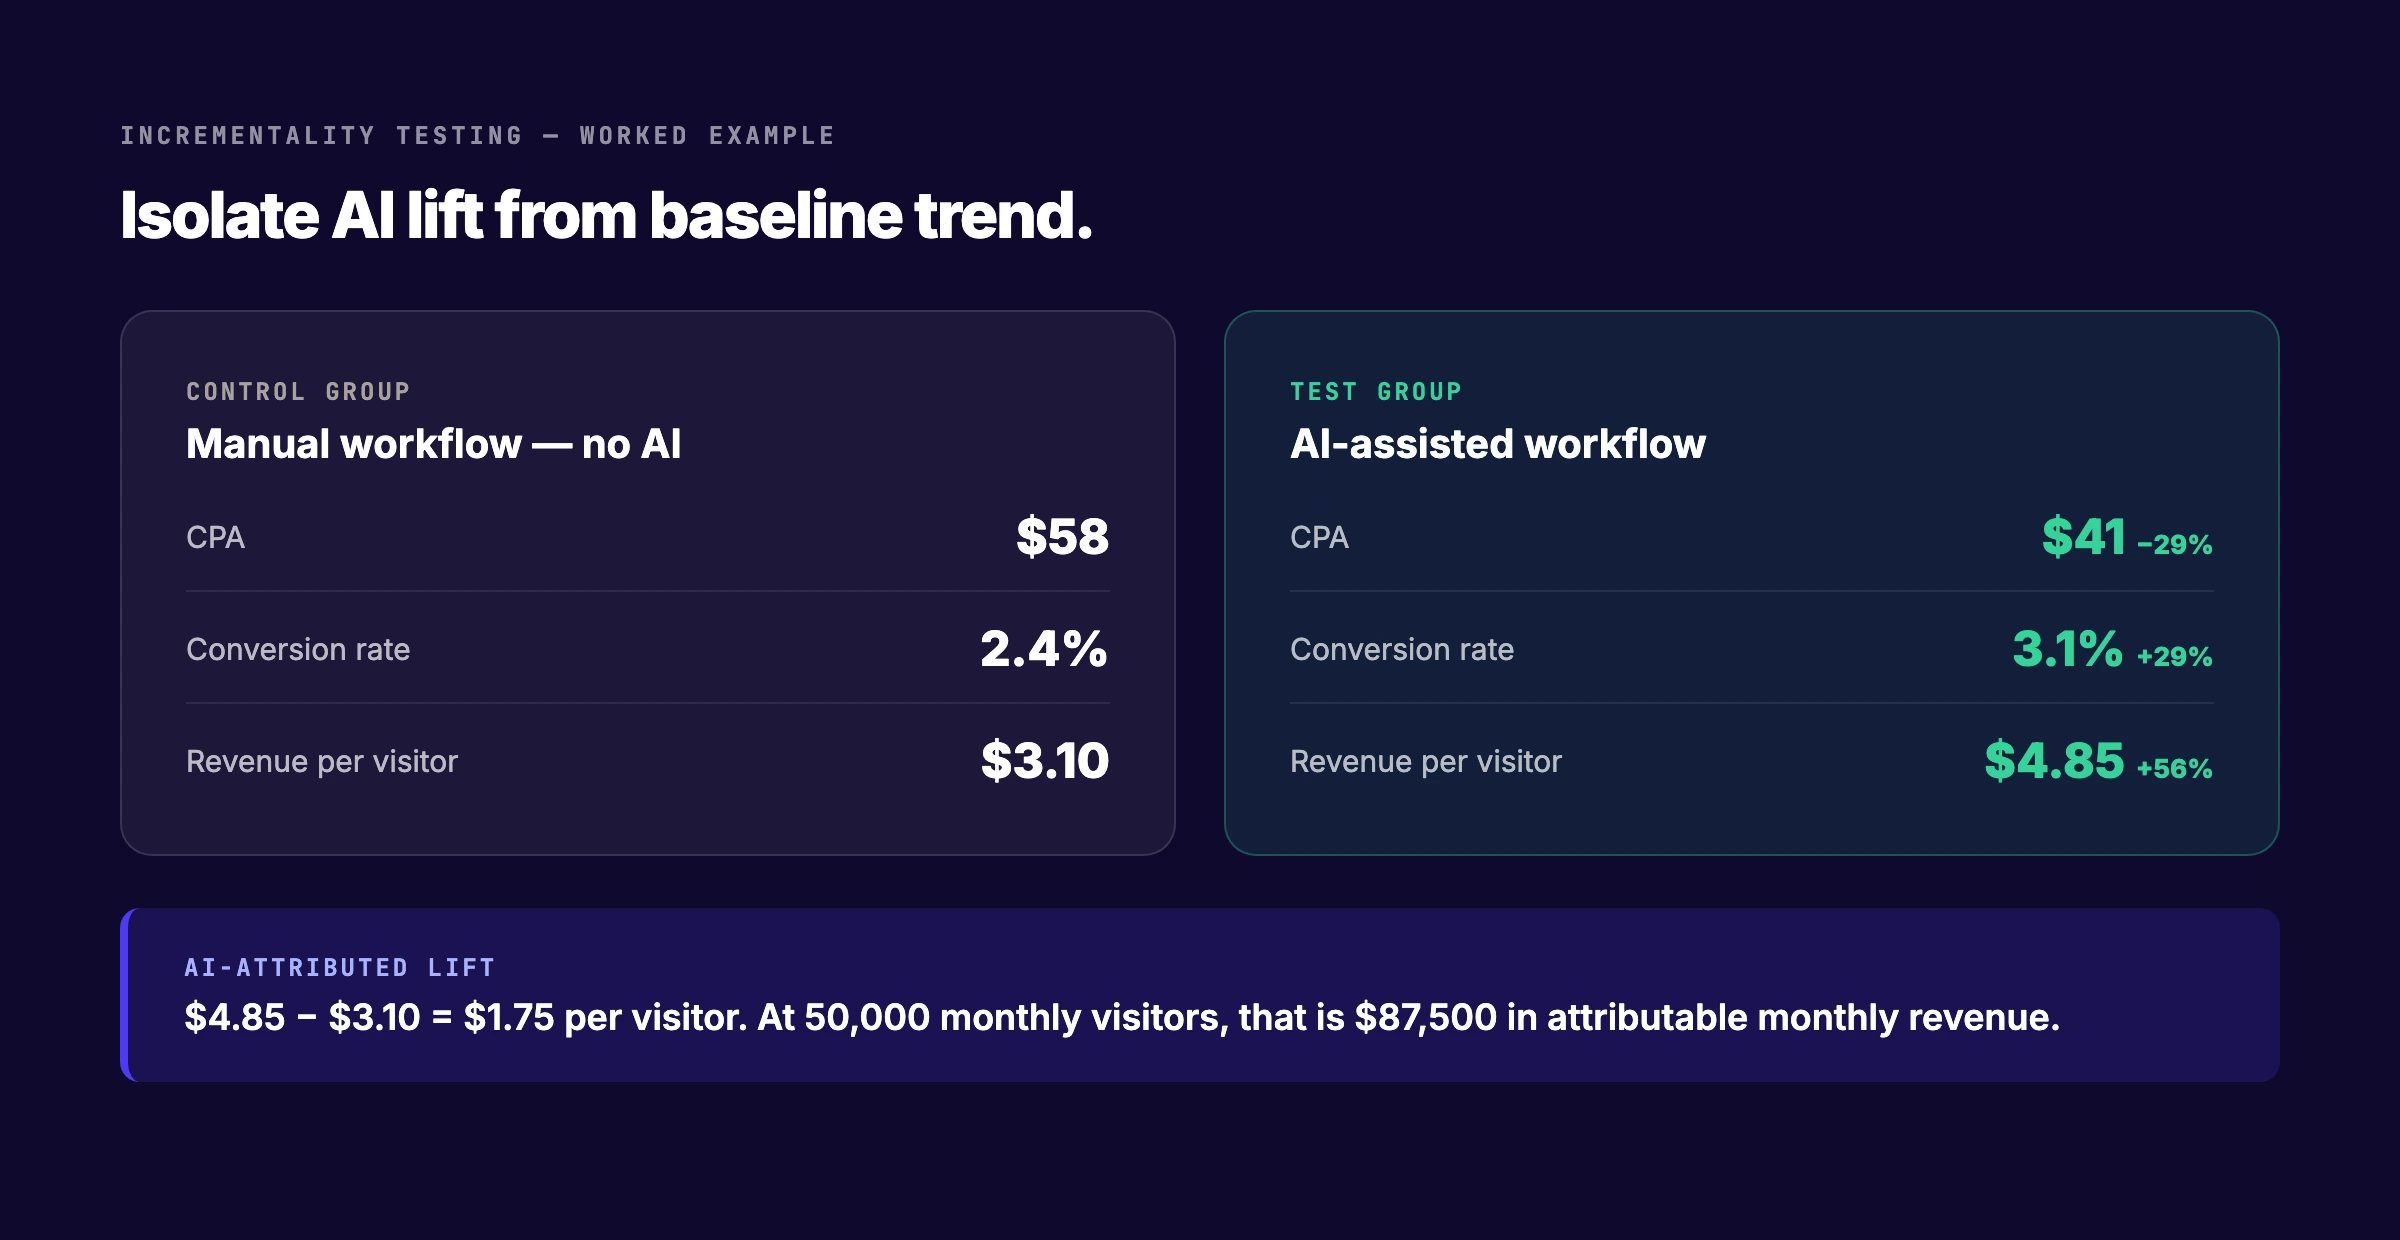
The incrementality test protocol:
- Split your audience. Divide your traffic, leads, or campaigns into two statistically equivalent groups. The control group continues with your current workflow. The test group uses the AI tool.
- Run for a minimum of 14 days. 30 days is better. Shorter periods produce noisy data. Longer periods capture compounding effects.
- Measure the same metrics on both groups. Cost per acquisition, conversion rate, revenue per visitor, or whatever your key performance indicator is.
- Calculate the delta. The difference between test and control is your AI-attributed lift. Not the absolute number. The delta.
Here is a worked example. A company runs an AI-assisted email campaign against a manually written control. The control group converts at 2.4%. The AI group converts at 3.1%. The delta is 0.7 percentage points, or a 29% relative lift. At 50,000 recipients and an average order value of $85, that delta is worth $29,750 in incremental revenue per campaign.
That is a causation number. It is not "we used AI and revenue went up." It is "the group that received AI-optimised content produced 29% more revenue than the identical group that did not."
Run incrementality tests quarterly for each major AI use case. AI performance drifts. A tool that produced a 40% lift in January might produce 15% by September as algorithms adapt, competition increases, or your audience fatigues.
Why this step matters: Without incrementality testing, your ROI claim is a correlation at best. Your chief financial officer will ask "how do you know AI caused this?" If you cannot run a controlled experiment, you cannot answer that question.
Step 7: Build a CFO-Ready Dashboard
Your chief financial officer does not care about click-through rates. They care about three numbers: how much you spent, how much you made, and whether the ratio is improving. Build a dashboard that answers those questions in 30 seconds.
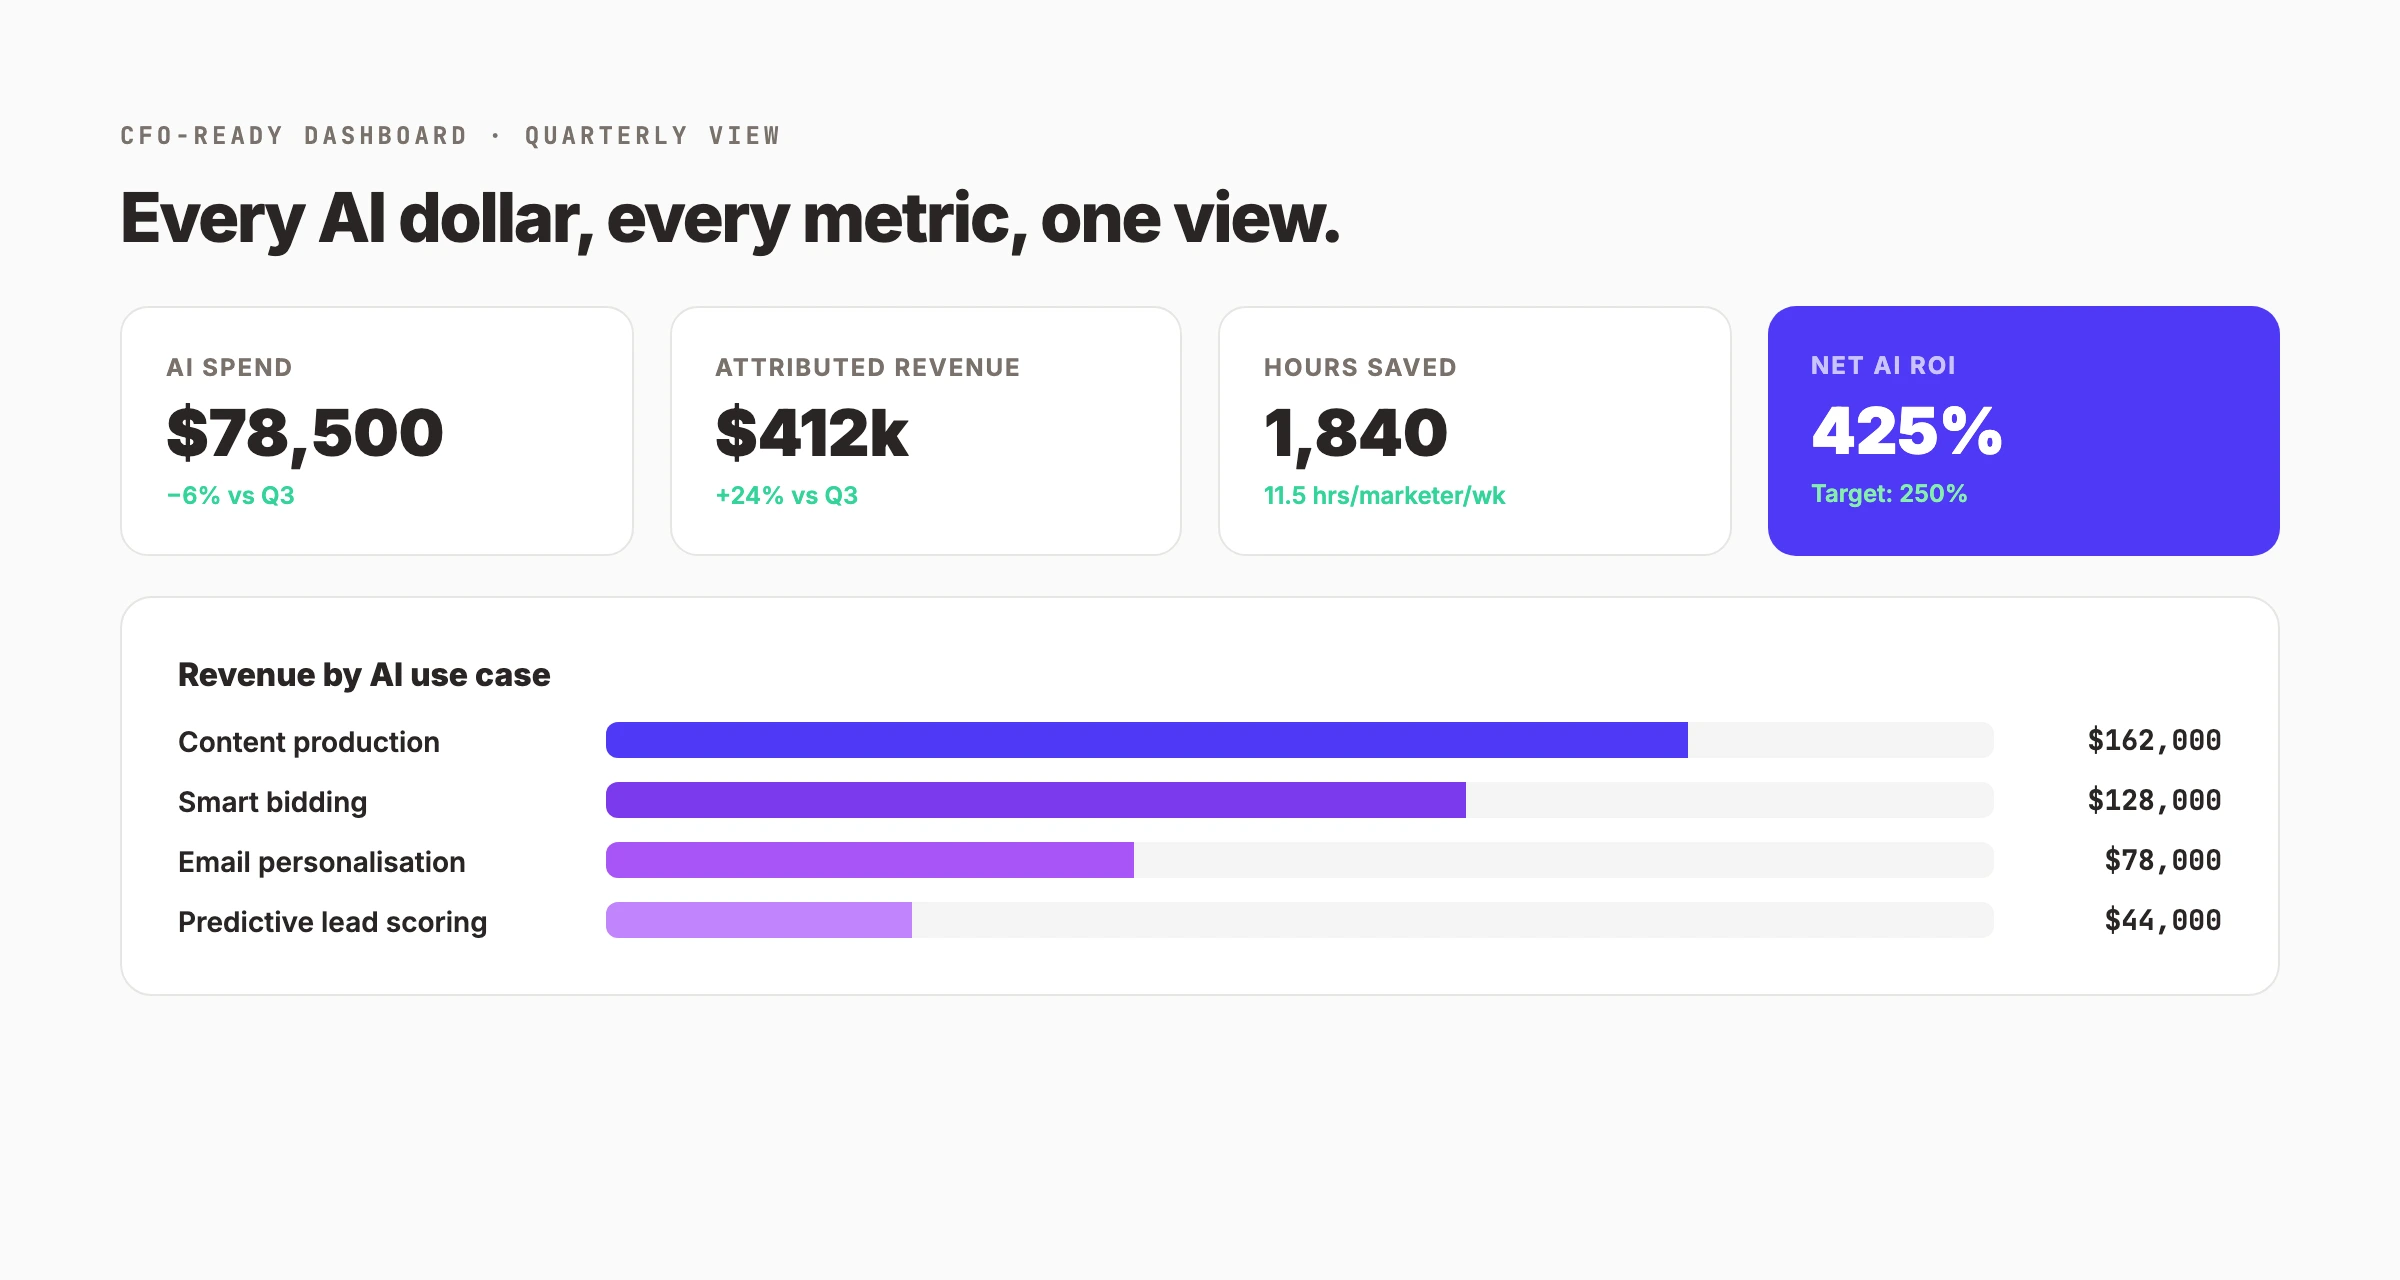
The CFO-ready dashboard has four sections:
Section 1: Investment summary. Total AI spend by category (software, implementation, training, review labor). Month-over-month and quarter-over-quarter trends. A red flag if spend is growing faster than return.
Section 2: Attributed revenue. Revenue from AI-influenced campaigns, measured through your three-layer attribution model. Broken down by AI use case (content, ads, email, lead scoring). A green flag if attributed revenue exceeds target.
Section 3: Efficiency metrics. Hours saved per week, cost per output (article, email, ad creative), and campaign launch speed. These prove the operational value of AI even when revenue attribution is unclear.
Section 4: Net AI ROI. The single number that matters. Calculated using the expanded formula from Step 3. Updated monthly. Compared against your target (250% to 400% is a realistic range for mature AI use).
Tools to build this dashboard:
- Google Looker Studio: Free. Connects to Google Analytics 4, Google Ads, and spreadsheet data. Best for teams already in the Google ecosystem.
- Tableau: Paid. More powerful visualisation. Best for enterprise teams with complex data pipelines.
- HubSpot Marketing Analytics: Built-in if you use HubSpot. Tracks campaign performance and pipeline impact natively.
- theStacc Analytics: Tracks organic traffic, lead attribution, and content ROI for every article published. Best for content-heavy teams.
Update the dashboard weekly for campaign metrics, monthly for pipeline metrics, and quarterly for business outcome metrics. Share it with your chief financial officer before they ask for it.
Why this step matters: A dashboard that lives in your marketing tools is invisible to leadership. A dashboard that lives in a shared report, updated automatically, turns AI ROI from a quarterly defence into a monthly celebration.
Common Mistakes That Invalidate AI Marketing ROI
Most AI marketing ROI claims fail for predictable reasons. Avoid these six traps and your numbers will hold up under scrutiny.
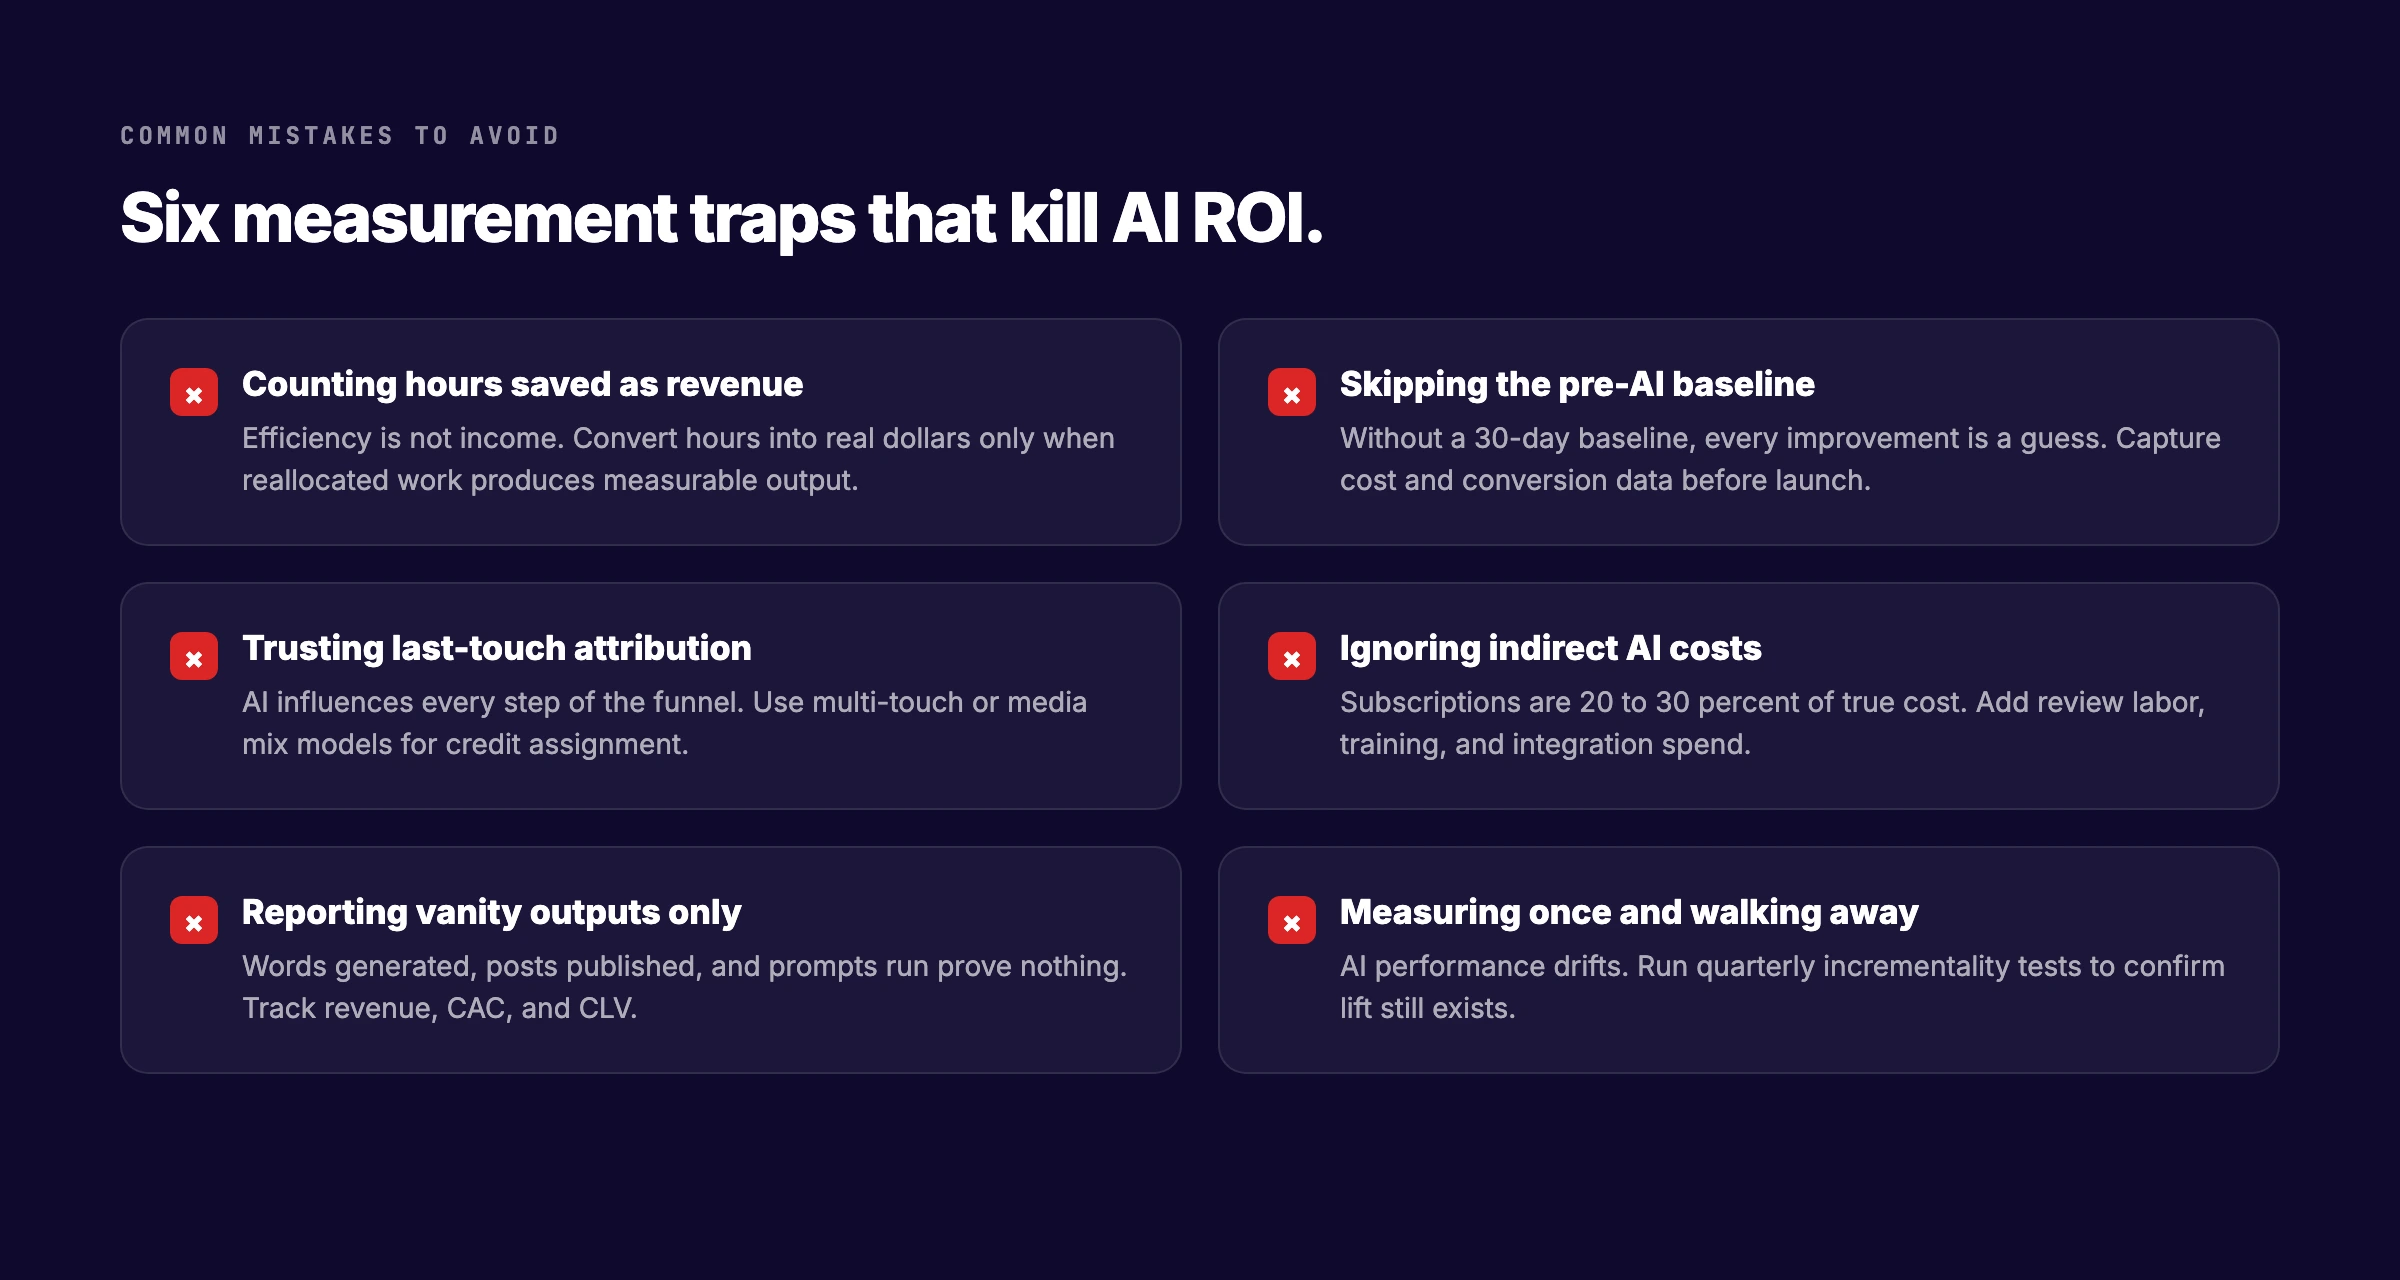
1. Counting hours saved as revenue. Efficiency is not income. If AI saves 10 hours per week but those hours are spent on low-value tasks, the saving is $0. Convert hours into real dollars only when reallocated work produces measurable output.
2. Skipping the pre-AI baseline. Without a 30-day baseline, every improvement is a guess. Capture cost and conversion data before launch. Compare against trend, not just the previous month.
3. Trusting last-touch attribution. AI influences every step of the funnel. A prospect might read an AI-optimised blog post, click an AI-bid ad, and convert through an AI-personalised email. Last-touch gives 100% credit to the email. Use multi-touch or media mix models for credit assignment.
4. Ignoring indirect AI costs. Subscriptions are 20% to 30% of true cost. Add review labor, training, integration spend, and opportunity cost. The team member managing AI prompts is not doing something else. That something else has value.
5. Reporting vanity outputs only. Words generated, posts published, and prompts run prove nothing. Track revenue, customer acquisition cost, and customer lifetime value. Output volume without outcome measurement is theatre.
6. Measuring once and walking away. AI performance drifts. Algorithms adapt. Competition increases. Audience fatigue sets in. Run quarterly incrementality tests to confirm lift still exists. A tool that produced 40% return on investment in January might produce 10% by December.
What Good AI Marketing ROI Looks Like: Benchmarks by Use Case
Return on investment varies by industry, team size, and AI use case. Use these benchmarks to set realistic targets and calibrate your expectations.
| AI Use Case | Typical ROI Range | Time to Positive ROI | Key Metric |
|---|---|---|---|
| Content production | 250% to 400% | 2 to 4 months | Cost per article, organic traffic lift |
| Smart bidding (Google/Meta) | 300% to 600% | 2 to 6 weeks | Return on ad spend improvement |
| Email personalisation | 200% to 350% | 1 to 3 months | Open rate, revenue per email |
| Predictive lead scoring | 150% to 300% | 3 to 6 months | SQL rate, pipeline velocity |
| Chatbot customer support | 100% to 250% | 3 to 6 months | Cost per ticket, resolution rate |
| Media mix modelling | 120% to 200% | 6 to 12 months | Budget efficiency, forecast accuracy |
Source: McKinsey Global Survey 2026; HubSpot State of Marketing 2026; Gartner CMO Spend Survey 2026.
Companies using AI for marketing report an average return on investment improvement of 35%, according to McKinsey Digital. The biggest gains come from content production (63% efficiency improvement), followed by ad optimisation (41% lower cost per acquisition) and email marketing (28% higher open rates).
A 2026 Meta and LinkedIn co-published advertising effectiveness study analysing over 41,000 ad campaigns found that generative AI-produced ad creatives achieved an average click-through rate 1.8 times higher than human-only creatives. AI-human collaborative ads performed best at 2.1 times the baseline.
The measurement gap is the real story. 94% of content marketing teams use AI. 88% use it daily. But 81% have no measurement framework for whether AI is actually producing results or just producing content. The teams that measure win the budget fight. The teams that do not measure lose their tools.
What practitioners are saying on X
AI search advice ages quickly. Here is high-signal public discussion from SEO and growth operators — context for your roadmap, not a substitute for primary data.
- @jakezward (Feb 2026): 2026 SEO predictions emphasize AI Overview share-of-SERP, schema for LLM token efficiency, brand mentions in AI answers as a KPI, proprietary data as a moat, and content refresh beating net-new AI slop. See the post on X.
- @e_tartakovsky (Jul 2026): When an AI summary appears, organic CTR can fall (cited ~8% vs ~15% traditional), but remaining clicks may convert higher because AI pre-qualifies intent — measure quality not only volume. See the post on X.
- @hridoyreh (Mar 2026): Widely shared SEO skill tree: foundations, research, technical, on-page, content, links, AI SEO/GEO, analytics, UX, brand, programmatic — useful map for stats and how-to posts. See the post on X.
Grok, AI Overviews, and multi-engine visibility
Statistics pages on “measure ai marketing roi” earn AI citations when every major number has a year, source, and definition. Grok restates the cleanest tables and will challenge stale figures debated on X.
- Google AI Overviews: Use passage-ready answers, tables, and FAQ schema where relevant.
- ChatGPT / Perplexity: Cite named sources next to key claims.
- Grok: Maintain accurate entity facts on-site and in high-signal X posts.
Publish content built for Google and AI citations. theStacc’s Content SEO module ships SEO-scored articles structured for rankings and generative engines — including clearer entity pages models like Grok can quote.
Frequently Asked Questions
Start with one AI tool, one metric, and one time period. Pick the tool with the clearest revenue connection (usually smart bidding or content production). Establish a 30-day baseline. Run the tool for 30 days. Compare the metric. That is your first ROI data point. Expand from there.
Campaign-level metrics (click-through rate, cost per acquisition) can be measured in 2 to 4 weeks. Pipeline metrics (marketing qualified leads, sales qualified leads) need 1 to 3 months. Business outcome metrics (revenue, customer acquisition cost) need 3 to 6 months. Do not wait for perfect data. Measure what you have and refine.
Yes. A spreadsheet, Google Analytics 4, and a simple incrementality test are enough to start. Split your audience into two groups. Run AI with one group. Do not run AI with the other. Measure the delta. That is incrementality testing, and it costs nothing beyond the tool you are already paying for.
250% to 400% is a realistic target for mature AI use cases like content production and smart bidding. 150% to 250% is realistic for newer use cases like predictive lead scoring and chatbots. Anything below 150% should trigger a review of the tool, the workflow, or the measurement method.
Map them to efficiency metrics first, then convert those metrics to dollars. If an AI tool saves 10 hours per week, multiply by your loaded labor rate. If the saved hours are reallocated to revenue-generating work, count that work toward revenue gain. If the saved hours are not reallocated, the efficiency gain is a cost saving, not revenue.
Measure both. Per-tool measurement tells you which tools to keep, scale, or cancel. Stack-wide measurement tells you whether your overall AI investment is justified. Start per-tool. Add stack-wide measurement once you have three or more AI tools in production.
Conclusion
Measuring AI marketing ROI is not a finance exercise. It is a survival exercise. 94% of teams use AI. Only 19% track it. The 81% who do not measure are one budget review away from losing their tools.
The seven-step framework in this guide fixes that:
- Define your AI stack so you know what you are measuring
- Establish baselines so you know where you started
- Use the expanded ROI formula so your numbers are defensible
- Account for every hidden cost so your chief financial officer trusts the math
- Build a three-layer attribution model so you capture AI's full impact
- Run incrementality tests so you prove causation, not correlation
- Build a CFO-ready dashboard so leadership sees the value before they ask
Which step will you start with: the baseline audit, the attribution model, or the incrementality test? Start with one. Measure for 30 days. Share the number. That is how AI marketing budgets get protected, expanded, and justified.
See your AI content ROI before you spend a dollar. theStacc publishes 30 SEO-optimised articles per month, tracked against traffic, leads, and revenue. Calculate your SEO ROI in 60 seconds.
Related Tools & Resources
Free SEO Tools:
Best Lists:
Sources & references
- [1] Princeton / Georgia Tech et al. — GEO research (arXiv:2311.09735)
- [2] @jakezward on X — 2026 SEO predictions emphasize AI Overview share-of-SERP, schema for LLM token efficiency, brand mentions in AI answers
- [3] @e_tartakovsky on X — When an AI summary appears, organic CTR can fall (cited ~8% vs ~15% traditional), but remaining clicks may convert highe
- [4] @hridoyreh on X — Widely shared SEO skill tree: foundations, research, technical, on-page, content, links, AI SEO/GEO, analytics, UX, bran

Researched, written, and published articles that compound organic traffic.
Weekly local SEO teardowns
One practical email a week. Map Pack, GBP, AI Overviews — no fluff. Unsubscribe anytime.