A step-by-step guide to SEO client reporting that builds trust and reduces churn. 7 steps to create reports clients actually read and renew for.
SEO agencies lose 38% of their clients every year. And the leading cause is not poor rankings. It is poor reporting. According to agency retention research from HubSpot, clients cancel because they do not understand what is happening to their campaigns or whether the work is worth the investment. A report that confuses more than it clarifies is a cancellation waiting to happen.
July 2026 operator note: Keep this page citation-ready: dated stats, question-style H2s, FAQ answers, and clear entities so Google AI Overviews, ChatGPT, Perplexity, and Grok can reuse it.
Today I am going to show you how to build an SEO client reporting system that retains clients. This is the same process agencies use to cut churn by 22% and increase contract renewals to 92%. By the end of this guide, you will have a complete reporting framework. Even if you have never built a client report before.
Here is what you will learn:
- How to choose metrics that connect to client revenue, not SEO vanity numbers
- How to structure reports for CEOs, marketing managers, and specialists
- How to write narrative sections that prevent panic calls
- How to set delivery cadence that builds trust
- How to scale reporting from 5 clients to 50 without losing quality
- How to justify SEO budgets using competitor and paid search comparisons
- How to automate data collection while keeping the human insight that retains clients
Let us get started.
Overview: What You Need
Time required: 4-6 hours to set up the initial framework; 30-60 minutes per client per month after that Difficulty: Intermediate What you will need:
- Google Analytics 4 access for each client
- Google Search Console access for each client
- A reporting tool (Google Looker Studio, AgencyAnalytics, or Semrush)
- A CRM or form tracking system for lead data
- A standardized template document
Step 1: Choose 5 KPIs That Connect to Revenue
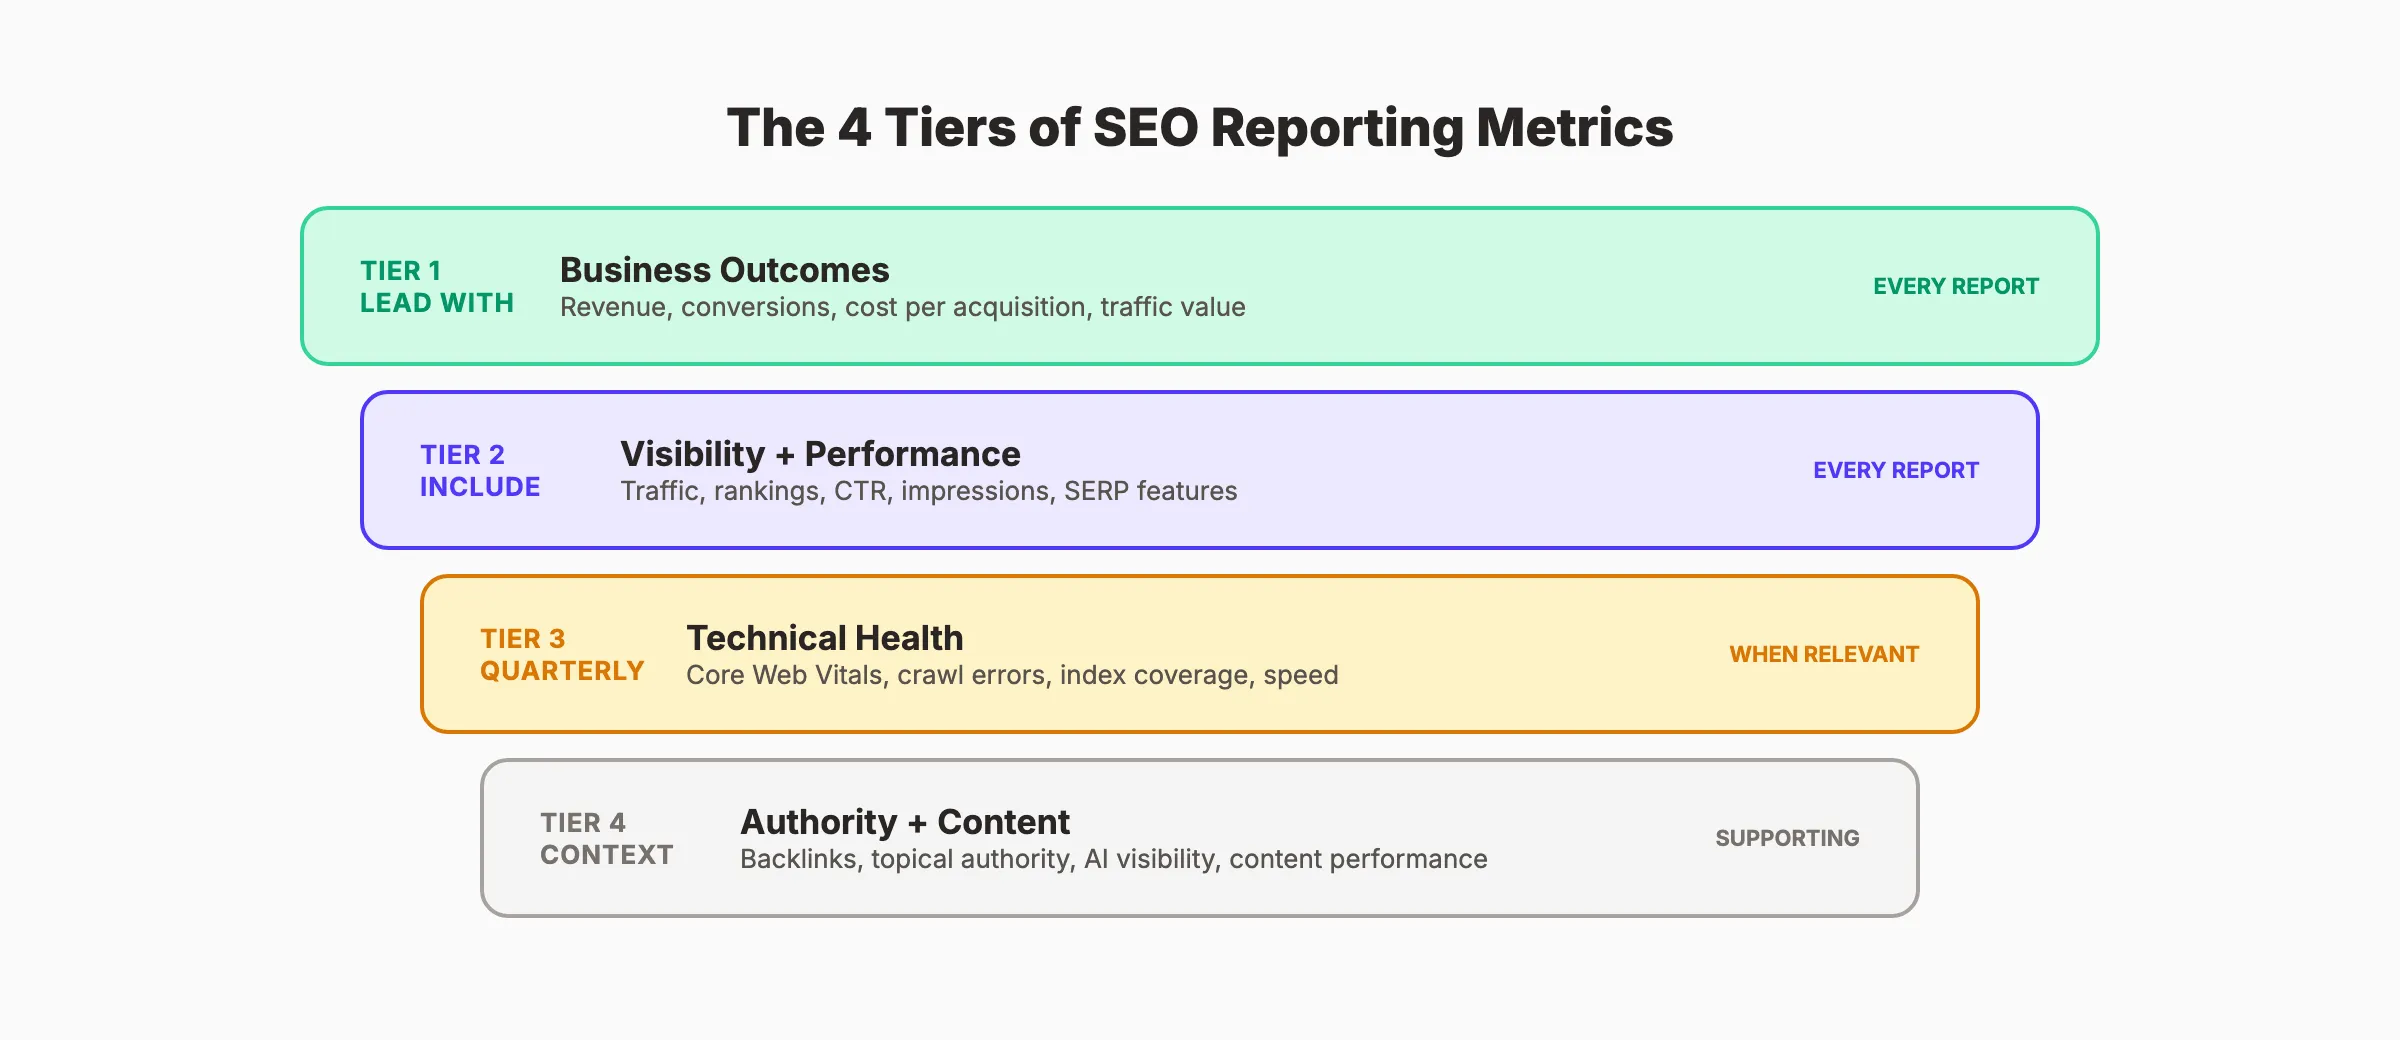
The fastest way to lose a client is to send a report they cannot connect to their own business. Clients do not run their operations on Domain Authority or crawl error counts. They run on leads, revenue, and cost per acquisition. Every section of every SEO report should answer one question: what does this mean for our business?
Most agencies include every available metric in their reports. Impressions, clicks, CTR, keyword positions, backlink count, crawl errors, page speed scores, engagement rate, bounce rate, and 20 more. Clients skim to the number they recognize and ignore everything else. This creates confusion, not clarity.
Pick 5 KPIs that connect directly to the client's business goals and report those consistently every month.
| Business Type | KPI 1 | KPI 2 | KPI 3 | KPI 4 | KPI 5 |
|---|---|---|---|---|---|
| Ecommerce | Organic revenue | Conversion rate | Organic sessions | Top product page rankings | Cart abandonment from organic |
| B2B SaaS | Demo requests from organic | Organic sessions | Target keyword positions | Content download conversions | Cost per organic lead |
| Local service | Organic calls | Form submissions | GBP views | Service keyword rankings | Map pack position |
| Healthcare | Appointment requests | Organic sessions | Provider page rankings | Local keyword positions | Review growth rate |
The specific KPIs matter less than the principle behind them. Each metric must connect to a business outcome the client already tracks. If the client measures success in appointments booked, report appointments booked from organic. If they measure success in ecommerce revenue, report organic revenue. Never lead with a metric the client does not use internally.
Limiting KPIs to 5 forces discipline. It prevents the common mistake of data-dumping every available metric into a report and hoping the client finds something useful. Clients who see 5 clear numbers that map to their goals understand exactly what they are paying for. Clients who see 25 metrics understand nothing.
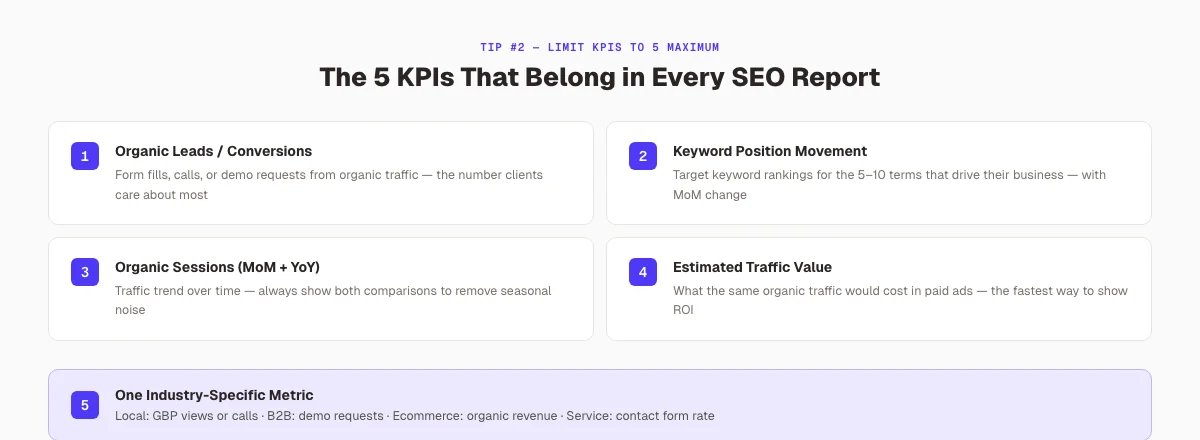
Why this step matters: Reports with more than 7 KPIs see 40% lower engagement from executive readers. When clients stop reading reports, they stop understanding value. When they stop understanding value, they cancel.
Pro tip: If you cannot calculate exact revenue attribution, use the SEO ROI calculator to estimate based on traffic volume and conversion rate. "We drove 28 organic leads at an estimated value of $14,000 this month, up from 21 leads last month" is a lede. "Organic traffic increased 18%" is not.
Step 2: Build Two Report Versions for Two Audiences
A report built for an SEO specialist confuses a business owner. A report built for a CEO frustrates an in-house marketing team managing the campaign day-to-day. The same underlying data needs entirely different framing depending on who reads it. Most agencies send one report to all stakeholders. This is a mistake.
Create two versions of every monthly report.
Version A: Executive Summary (1 page)
This version is for CEOs, business owners, and non-marketing stakeholders. It contains zero technical language. The executive summary includes:
- Revenue or lead impact from organic channels this month
- Month-over-month and year-over-year change percentages
- The 5 most important keyword position trends
- One sentence on what changed and why
- 3 specific actions planned for next month
The executive summary should take 30 seconds to read. Busy executives often read only this page. Make it count.
Version B: Specialist Report (4-8 pages)
This version is for in-house marketing teams, SEO specialists, and anyone who needs tactical detail. It includes:
- Full traffic breakdown by channel, device, and landing page
- Complete keyword ranking table with position changes and search volume
- Technical SEO health score with issue prioritization
- Backlink profile changes with quality assessment
- Content performance by page and cluster
- Conversion funnel analysis from session to close
- Detailed recommendations with expected impact
Most agencies skip the executive summary because it feels like extra work. It takes 15 extra minutes per month. Those 15 minutes dramatically increase how relevant the report feels to each recipient. The CEO gets clarity. The marketing manager gets detail. Both feel the report was built for them.
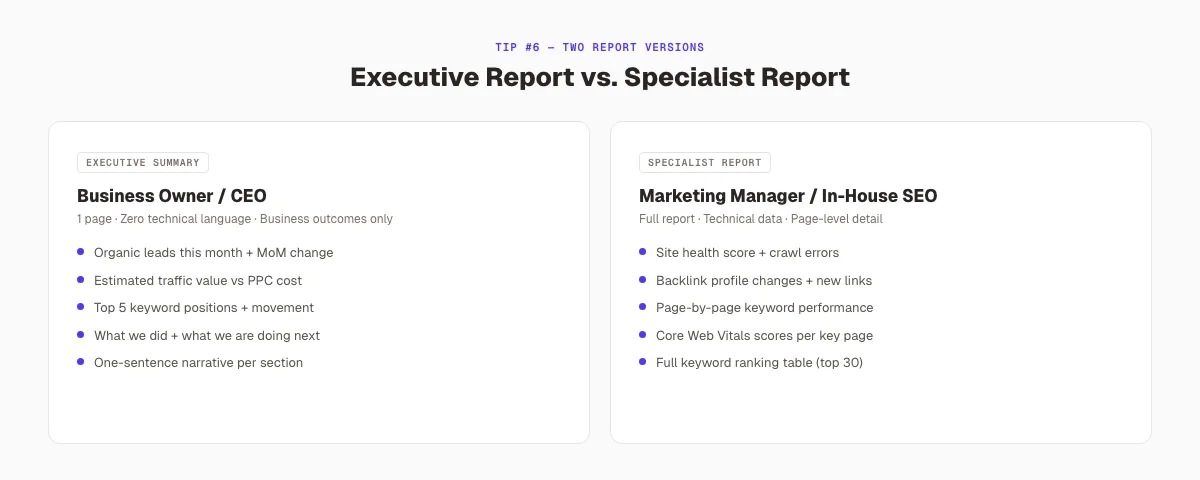
Why this step matters: CEOs who receive technical reports stop reading them. Marketing managers who receive high-level summaries feel unsupported. Splitting the audience prevents both problems and increases perceived value for every stakeholder.
Pro tip: Send the executive summary in the email body with the specialist report attached as a PDF. Executives read email. Specialists open attachments. This simple delivery choice increases readership significantly.
Step 3: Structure Every Report With 8 Core Sections
Every monthly report should follow the same section order. Consistent structure trains clients to find what they need quickly. It also reduces the time you spend deciding what to include each month.
Section 1: Executive Summary
Open with 3-4 bullet points covering the biggest win, the biggest challenge, and the primary focus for next month. Write this for an intelligent colleague outside your field. No jargon. No acronyms.
Section 2: Traffic and Engagement
Show organic sessions with both month-over-month and year-over-year comparisons. Include device breakdown. Add a brief narrative explaining any significant change.
Section 3: Keyword Rankings
Group keywords by funnel stage: awareness, consideration, and conversion. Show position changes with traffic opportunity estimates. A keyword moving from position 8 to position 3 for a term with 800 monthly searches represents a 56-visit-per-month increase. Show that math.
Section 4: Conversions and ROI
This is the section clients care about most. Show goal completions, revenue, and assisted conversions from organic. Compare the retainer cost to the equivalent Google Ads spend for the same traffic. "Your $1,500/month SEO retainer is generating traffic equivalent to $6,800/month in Google Ads spend." That comparison is more persuasive than any ranking table.
Section 5: Technical SEO Health
Present a site health score in plain language. Celebrate resolved issues. Flag new problems with priority levels. Include Core Web Vitals data. The exception is early-stage campaigns where technical fixes are the primary work product. In months 1-3, expand this section and explain each fix in business terms.
Section 6: Backlinks and Authority
Show new links earned, lost links, and quality trends. Connect link acquisition to specific campaigns or content pieces. Raw backlink counts without context are vanity metrics. Quality and relevance matter more than quantity.
Section 7: Content Performance
Show which pages drove the most organic traffic, which new content pieces are indexing, and which existing pages need updates. Include a content calendar for the next 30 days.
Section 8: Actions Taken and Next Steps
List work completed this month. Then list 3-5 specific actions planned for next month with expected impact. This signals ongoing work, creates accountability, and gives the client a reason to anticipate the next update.
| Section | Audience | Length |
|---|---|---|
| Executive Summary | CEOs, owners | 1 page |
| Traffic and Engagement | All | 1 page |
| Keyword Rankings | Marketing teams | 1-2 pages |
| Conversions and ROI | CEOs, owners | 1 page |
| Technical SEO Health | Specialists | 1 page |
| Backlinks and Authority | Marketing teams | 0.5 page |
| Content Performance | Marketing teams | 0.5 page |
| Actions and Next Steps | All | 0.5 page |
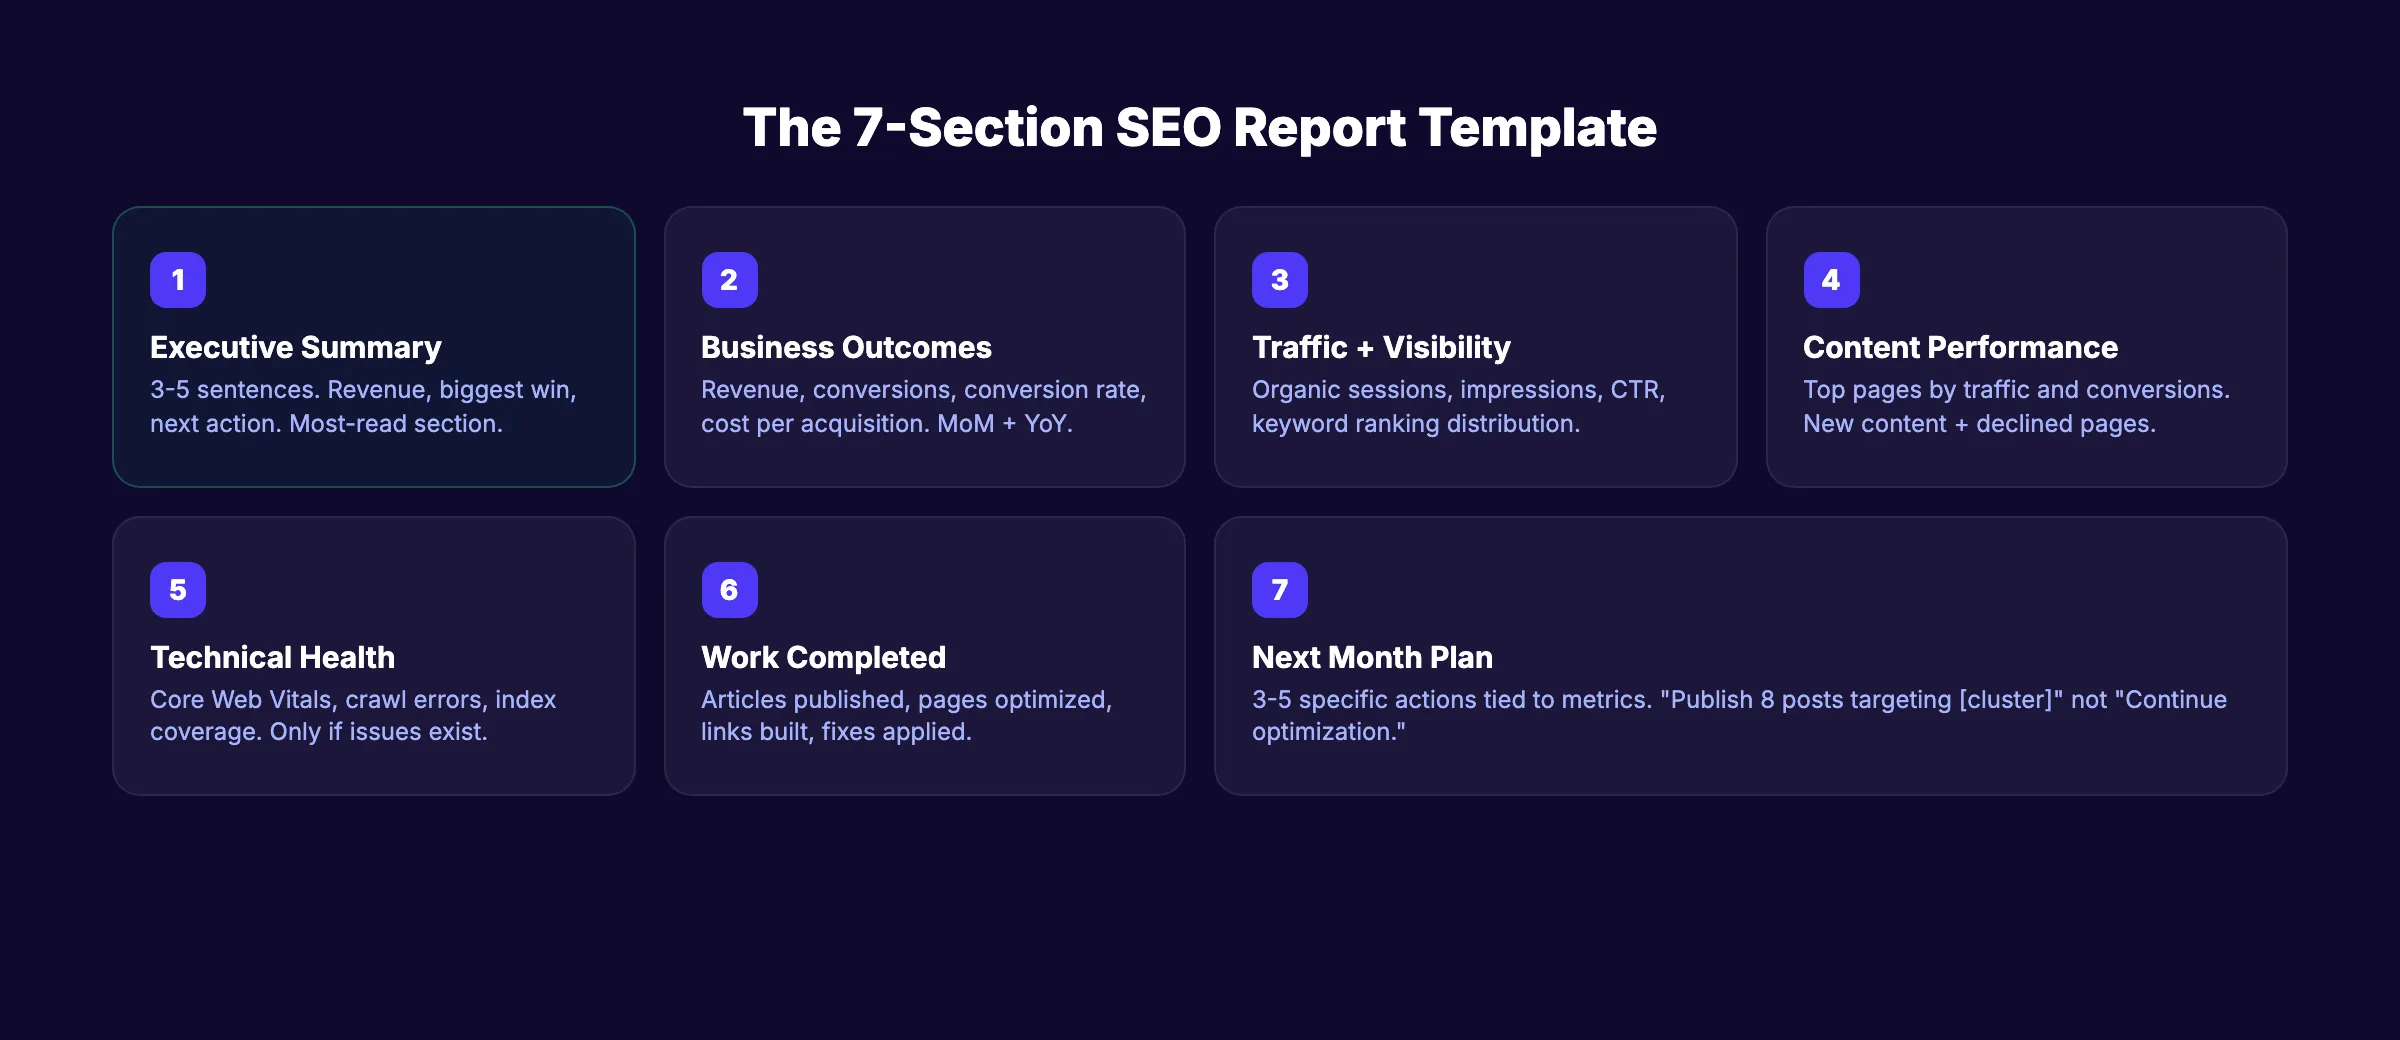
Why this step matters: Inconsistent report structure forces clients to relearn where information lives every month. Consistent structure builds familiarity. Familiarity builds confidence. Confidence builds retention.
Pro tip: Match report depth to campaign phase. Early-stage clients need education-heavy reports. Established clients need ROI-focused reports. The section order stays the same. The depth and emphasis shift.
Your SEO team. $99/month. Stacc publishes 30 SEO-optimized articles per month for your clients, automatically. No writers, no briefs, no missed deadlines. See what Stacc publishes →
Step 4: Write a "What Changed and Why" Narrative for Every Major Metric
Numbers without context are noise. If organic traffic drops 12% this month, the client needs to know whether that is because of a Google algorithm update, a seasonal pattern, a technical error, or the loss of one high-traffic page. Without context, clients assume the worst.
Write a 2-3 paragraph narrative after every major metric section. Label it clearly: "What Changed and Why." This converts the report from a data export into a management briefing.
The narrative does not need to be long. Three sentences per section is enough:
- What happened
- Why it happened
- What changes as a result
Here is an example:
"Organic traffic fell 12% this month. Google released a broad core update on March 15 that affected informational content across most industries. Not just your site. We are monitoring your top 10 pages and will update the 3 that show the largest impression drop before the next report."
That is a complete narrative. It demonstrates expertise, prevents panic, and eliminates the follow-up call. Clients who understand what is driving their numbers are far less likely to cancel because of a temporary dip they interpret as failure.
A clear narrative also distinguishes your agency from every other vendor sending a raw dashboard screenshot. Clients pay for interpretation, not data retrieval. A fully automated report without human analysis is something clients learn to recognize within 2-3 months. And it signals that nobody is actually managing their campaign.
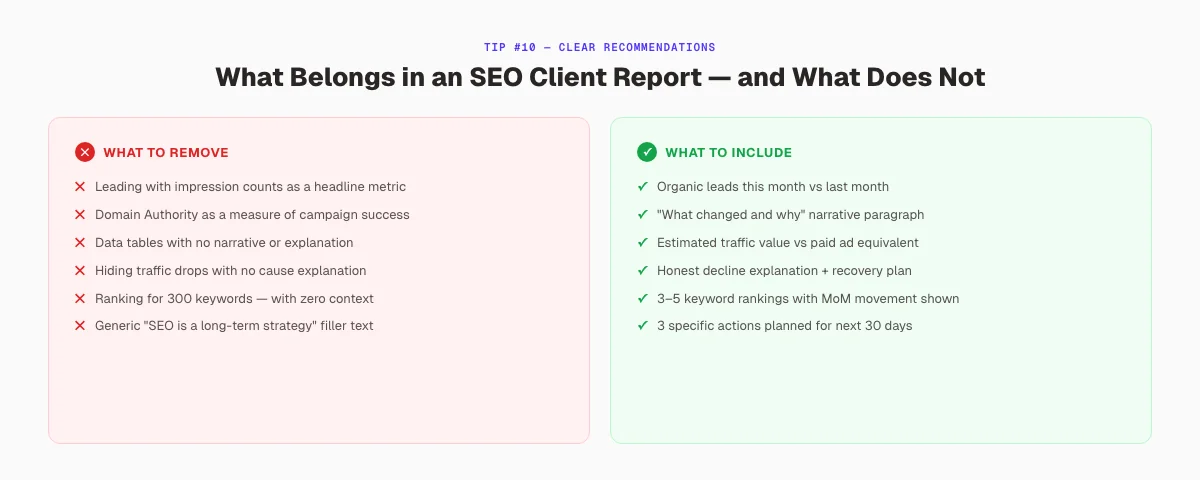
Why this step matters: Proactive, clear communication cuts agency churn by approximately 22%. The narrative section is where that communication lives. Skip it and you leave 22% of retention on the table.
Pro tip: Write the narrative section last, after all data is collected. Context requires knowing the full picture. Writing narratives while data is still being pulled leads to incomplete explanations and corrections later.
Step 5: Show Month-Over-Month and Year-Over-Year Comparisons Together
MoM comparisons show momentum. YoY comparisons remove seasonal bias. A 20% traffic drop in January looks alarming in a month-over-month view. In a year-over-year view, it is often completely normal for January across most industries. Show both comparisons in every traffic and conversion section.
Label clearly which comparison is displayed in each chart. Clients who only see MoM data panic at seasonal dips that are entirely normal. Clients who only see YoY data miss short-term changes that need immediate action. Both views together eliminate unnecessary follow-up questions and build confidence in the data.
This takes two extra minutes to set up in any reporting tool. The return on those two minutes is significant. Clients who understand seasonality do not cancel in slow months. Clients who see only MoM data often do.

Why this step matters: Seasonal panic is one of the most common causes of mid-contract cancellations. A client who sees a 25% January drop without YoY context assumes the campaign is failing. The same client who sees that January is historically 22% below December every year understands the pattern.
Pro tip: Add a small seasonal note in the narrative section during known slow periods. "January is historically 20-25% below December for [industry] due to post-holiday budget cycles." This single sentence prevents dozens of concerned emails.
Step 6: Set Reporting Cadence in the Contract and Deliver Religiously
Do not let reporting frequency be an afterthought or a client request. Define it in the service agreement before work begins. Agencies that establish realistic KPIs and explicit reporting schedules during onboarding achieve 15-20 percentage points better retention than the industry average.
According to research from the Forbes Agency Council, agencies that establish realistic KPIs and explicit reporting schedules during onboarding achieve 15-20 percentage points better retention than the industry average.
The contract should specify three things:
- The exact day reports arrive (not just the week)
- The format (PDF, live dashboard, or email summary)
- What meeting time is reserved for questions
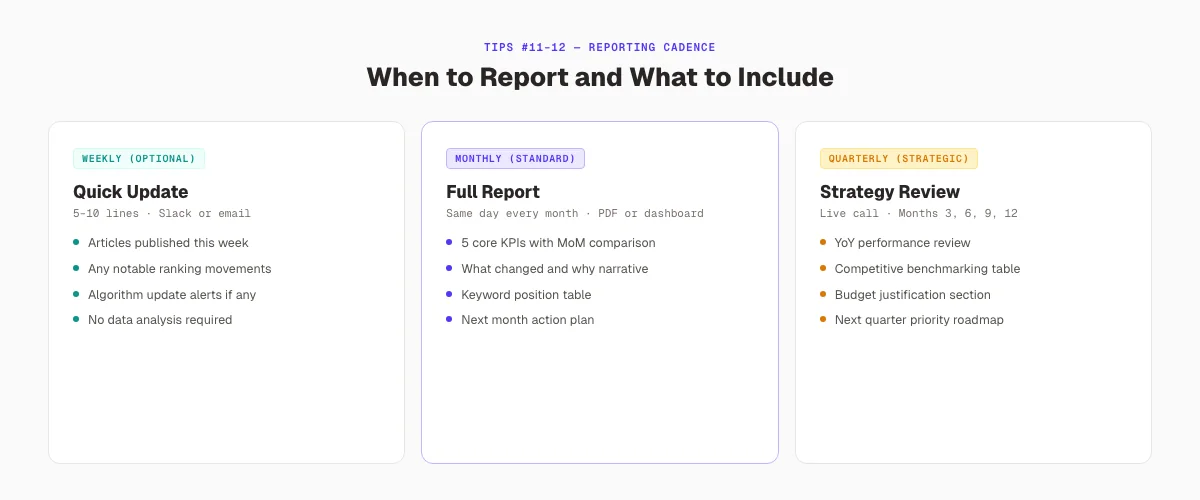
Monthly reporting is the standard for the majority of marketing agencies. Over 50% of agencies report monthly. But consistency means more than frequency. Send the report on the same day, at the same time of day, every single month.
A report arriving on the first Friday at 10 AM every month becomes expected and trusted. A report that sometimes arrives on the 7th, sometimes on the 14th, and once on the 23rd creates a perception of organizational disorder. Even if the content is excellent.
Use automation to schedule delivery so that human delays never affect the reporting rhythm. Predictable delivery is a trust signal. Erratic delivery is a churn signal.
| Frequency | Best For | Notes |
|---|---|---|
| Monthly | 80% of client relationships | Standard cadence; aligns with business planning |
| Bi-weekly | New client onboarding, major launches | Transition to monthly after 4-8 weeks |
| Weekly | Crisis recovery, algorithm response | Must have defined end date; premium pricing |
| Quarterly | Enterprise clients, executive stakeholders | Strategic focus; supplement with dashboard |
Why this step matters: Inconsistent delivery creates anxiety. Anxious clients send "any update?" emails. Those emails signal declining confidence. Declining confidence predicts cancellation. Reliable delivery eliminates the anxiety that drives mid-month check-ins.
Pro tip: Explain algorithm updates proactively. When Google releases a major update, email clients before they see their data change in the next report. A brief 2-sentence note prevents panic calls. "Google released a core update on [date]. We are monitoring your site closely and will include a full impact assessment in your report this month."
Stop writing. Start ranking. Stacc publishes 30 SEO-optimized articles per month automatically. No writers, no briefs, no delays. Give clients consistent content that compounds.
Step 7: Scale Reporting Without Losing the Human Touch
Manual reporting for 15-20 clients consumes 20-30 hours per month in data pulling alone. That is time that should go into analysis, strategy, and account management. Automation solves the data collection problem. But it introduces a new risk: generic, uncustomized reports that clients recognize and distrust.
There is a critical distinction between automating data collection and automating the narrative.
| Automate This | Never Automate This |
|---|---|
| Data collection from APIs | "What changed and why" narrative |
| Chart generation | Client-specific recommendations |
| Report assembly and scheduling | Competitor analysis interpretation |
| Quality checks and error detection | Budget justification reasoning |
Platforms like Semrush, Ahrefs, and SEO automation tools can pull keyword rankings, traffic data, backlink changes, and site health scores on a fixed schedule without manual work. They should handle all data aggregation and report assembly.
But the narrative section, the recommendations, the competitor context, and the budget justification require human judgment. Clients pay for interpretation, not data retrieval.
Scaling by client volume:
| Client Count | Approach | Time per Client per Month |
|---|---|---|
| 5-10 | Manual with standardized templates | 2-3 hours |
| 10-25 | Hybrid: automate data, keep analysis manual | 1-2 hours |
| 25+ | Full automation with human strategic oversight | 0.5-1 hour |
The break-even point for automation investment is typically 10-15 clients. Below that, manual reporting with good templates is faster than setting up automation. Above that, automation becomes essential for scalability.
Why this step matters: Agencies that try to scale manual reporting past 15 clients see report quality decline. Declining quality increases churn. The automation framework preserves quality while reducing time. But only if the narrative layer stays human.
Pro tip: Create a reporting quality checklist that every report passes before delivery. Check for data accuracy, narrative completeness, correct client name in the file, and branded formatting. One error in a client report erodes more trust than 10 accurate reports build.
Results: What to Expect
After completing these 7 steps, you should expect:
- Week 1: Baseline report delivered with documented starting metrics for every client
- Month 1-2: Clients begin commenting on report clarity and relevance; mid-month check-in emails decrease
- Month 3-6: Retention improvement becomes measurable; clients reference report data in strategy calls
- Month 6-12: Reporting becomes a competitive advantage; clients cite clear communication as a reason for renewal
The timeline varies by client maturity. Early-stage clients need more education in months 1-3. Established clients see faster engagement improvements because they have historical data to compare.
Be honest about what reporting cannot fix. A well-structured report does not compensate for a campaign with no strategy. But clear reporting does retain clients through the difficult early months when SEO results are still building. The compound effect of 6-12 months of consistent, well-communicated SEO work is where the real results appear. The report is what keeps clients in the room long enough to see them.
Troubleshooting: Common Reporting Problems
Problem: Clients still do not read the reports after switching to the 5-KPI format.
Solution: Deliver the executive summary in the email body, not as an attachment. Most executives never open PDFs. They read email. Put the most important number in the subject line: "March SEO Report: 34 organic leads (+21% MoM)."
Problem: One client wants weekly reports; the rest want monthly.
Solution: Define weekly reporting as a premium add-on with a defined end date. "Weekly reporting for the first 8 weeks of the campaign, then transitioning to monthly." This prevents scope creep and sets proper expectations.
Problem: A client panics over a traffic drop that is actually normal seasonality.
Solution: Add a seasonal context section to every report in known variable months. Show 3-year historical data if available. The narrative section should explicitly address seasonality before the client has a chance to misinterpret the data.
What practitioners are saying on X
AI search advice ages quickly. Here is high-signal public discussion from SEO and growth operators — context for your roadmap, not a substitute for primary data.
- @hridoyreh (Mar 2026): Widely shared SEO skill tree: foundations, research, technical, on-page, content, links, AI SEO/GEO, analytics, UX, brand, programmatic — useful map for stats and how-to posts. See the post on X.
- @jakezward (Feb 2026): 2026 SEO predictions emphasize AI Overview share-of-SERP, schema for LLM token efficiency, brand mentions in AI answers as a KPI, proprietary data as a moat, and content refresh beating net-new AI slop. See the post on X.
Grok, AI Overviews, and multi-engine visibility
For “seo client reporting”, multi-engine visibility still starts with clear definitions, sourced numbers, and extractable section answers. Grok additionally factors live X discussion — keep public claims consistent with this page.
- Google AI Overviews: Use passage-ready answers, tables, and FAQ schema where relevant.
- ChatGPT / Perplexity: Cite named sources next to key claims.
- Grok: Maintain accurate entity facts on-site and in high-signal X posts.
Frequently Asked Questions
Every SEO client report should include 5 core elements: organic traffic data with MoM and YoY comparison, keyword position movement for target terms, conversion and lead data from organic channels, a plain-language narrative explaining what changed and why, and 3-5 specific actions planned for the next reporting period. Avoid more than 5-7 primary KPIs in the main report body. Additional metrics belong in an appendix or a separate technical audit document.
Monthly is the industry standard. Over 50% of marketing agencies report monthly. For clients in active build phases or with high content velocity, add a brief weekly update covering rankings and content published. Reserve quarterly reports for strategic reviews covering year-over-year performance, competitive benchmarking, and budget justification. Define the exact cadence in the service contract before work begins.
Leading with vanity metrics. Impressions, total keywords ranked, and Domain Authority instead of business outcomes. A report showing 820,000 impressions and rankings for 340 keywords tells the client almost nothing about whether SEO is generating leads or revenue. The second-most common mistake is sending the same report format in month 1 as in month 18. The questions, benchmarks, and comparisons that matter change entirely as a campaign matures.
Focus on leading indicators: crawl health improvements, indexation growth, page speed gains, and keyword position movement within positions 10-30. Pages that are close to page 1 but not yet there. These demonstrate momentum before traffic results arrive. Add a section explaining the compounding nature of content: articles published in month 2 regularly begin ranking in month 5 or 6, as Google assesses authority over time. Show the client the asset being built, not only the short-term traffic number.
Every quarterly report should include competitive keyword data showing client position versus top 2 competitors across primary target terms. Monthly reports can include a simplified version. Did the client gain or lose ground relative to competitors on their top 5 terms? Competitive context helps clients evaluate their own progress accurately. A client who moved from 6th to 4th might feel disappointed seeing only their own data. But feels different about the same movement knowing that the competitor who was 2nd dropped to 5th in the same period.
Compare the monthly retainer cost to the estimated value of organic traffic using Google Ads CPC data. Show what the same keywords would cost if purchased through paid search. Include organic lead volume versus what PPC would cost to generate the same number of leads. According to Ahrefs SEO ROI research, the median return on SEO investment is 748%. Show clients their specific ROI calculation, not just the industry benchmark.
SEO reports are not data deliverables. They are relationship management tools. The agencies with the lowest churn rates are not necessarily the ones with the strongest results. They are the ones whose clients understand and trust what is happening to their campaigns month after month.
These 7 steps close the gap between what the data shows and what the client believes is happening. Vanity metrics create confusion. Inconsistent delivery creates doubt. Hidden declines destroy trust. Agencies that fix these reporting habits retain clients through the difficult early months when results are still building.
The report is what keeps clients in the room long enough to see the compound effect of consistent SEO work. Build your reporting system once. Refine it monthly. The retention improvement will compound just like the SEO results do.
For a complete SEO monitoring framework to pair with these reporting practices, the guide covers the tracking cadence and alert setup that catches problems before they show up in client reports.
3,500+ blogs published. Every article is SEO-scored before publish. Give your clients consistent, optimized content every month. Automatically. No writers to manage. No briefs to write. Try Stacc for free →
Related Tools and Resources
Free SEO Tools:
Best Lists:
Sources & references
- [1] Princeton / Georgia Tech et al. — GEO research (arXiv:2311.09735)
- [2] @hridoyreh on X — Widely shared SEO skill tree: foundations, research, technical, on-page, content, links, AI SEO/GEO, analytics, UX, bran
- [3] @jakezward on X — 2026 SEO predictions emphasize AI Overview share-of-SERP, schema for LLM token efficiency, brand mentions in AI answers
- [4] Referenced source — www.hubspot.com
Researched, written, and published articles that compound organic traffic.