Organic CTR by Position: 2026 Data (6 Studies)
Organic click-through rates by Google position from 6 major studies. Position 1-10 CTR data plus AI Overview impact. Updated March 2026.
Siddharth Gangal • 2026-03-28 • SEO Tips
In This Article
Last updated: March 2026
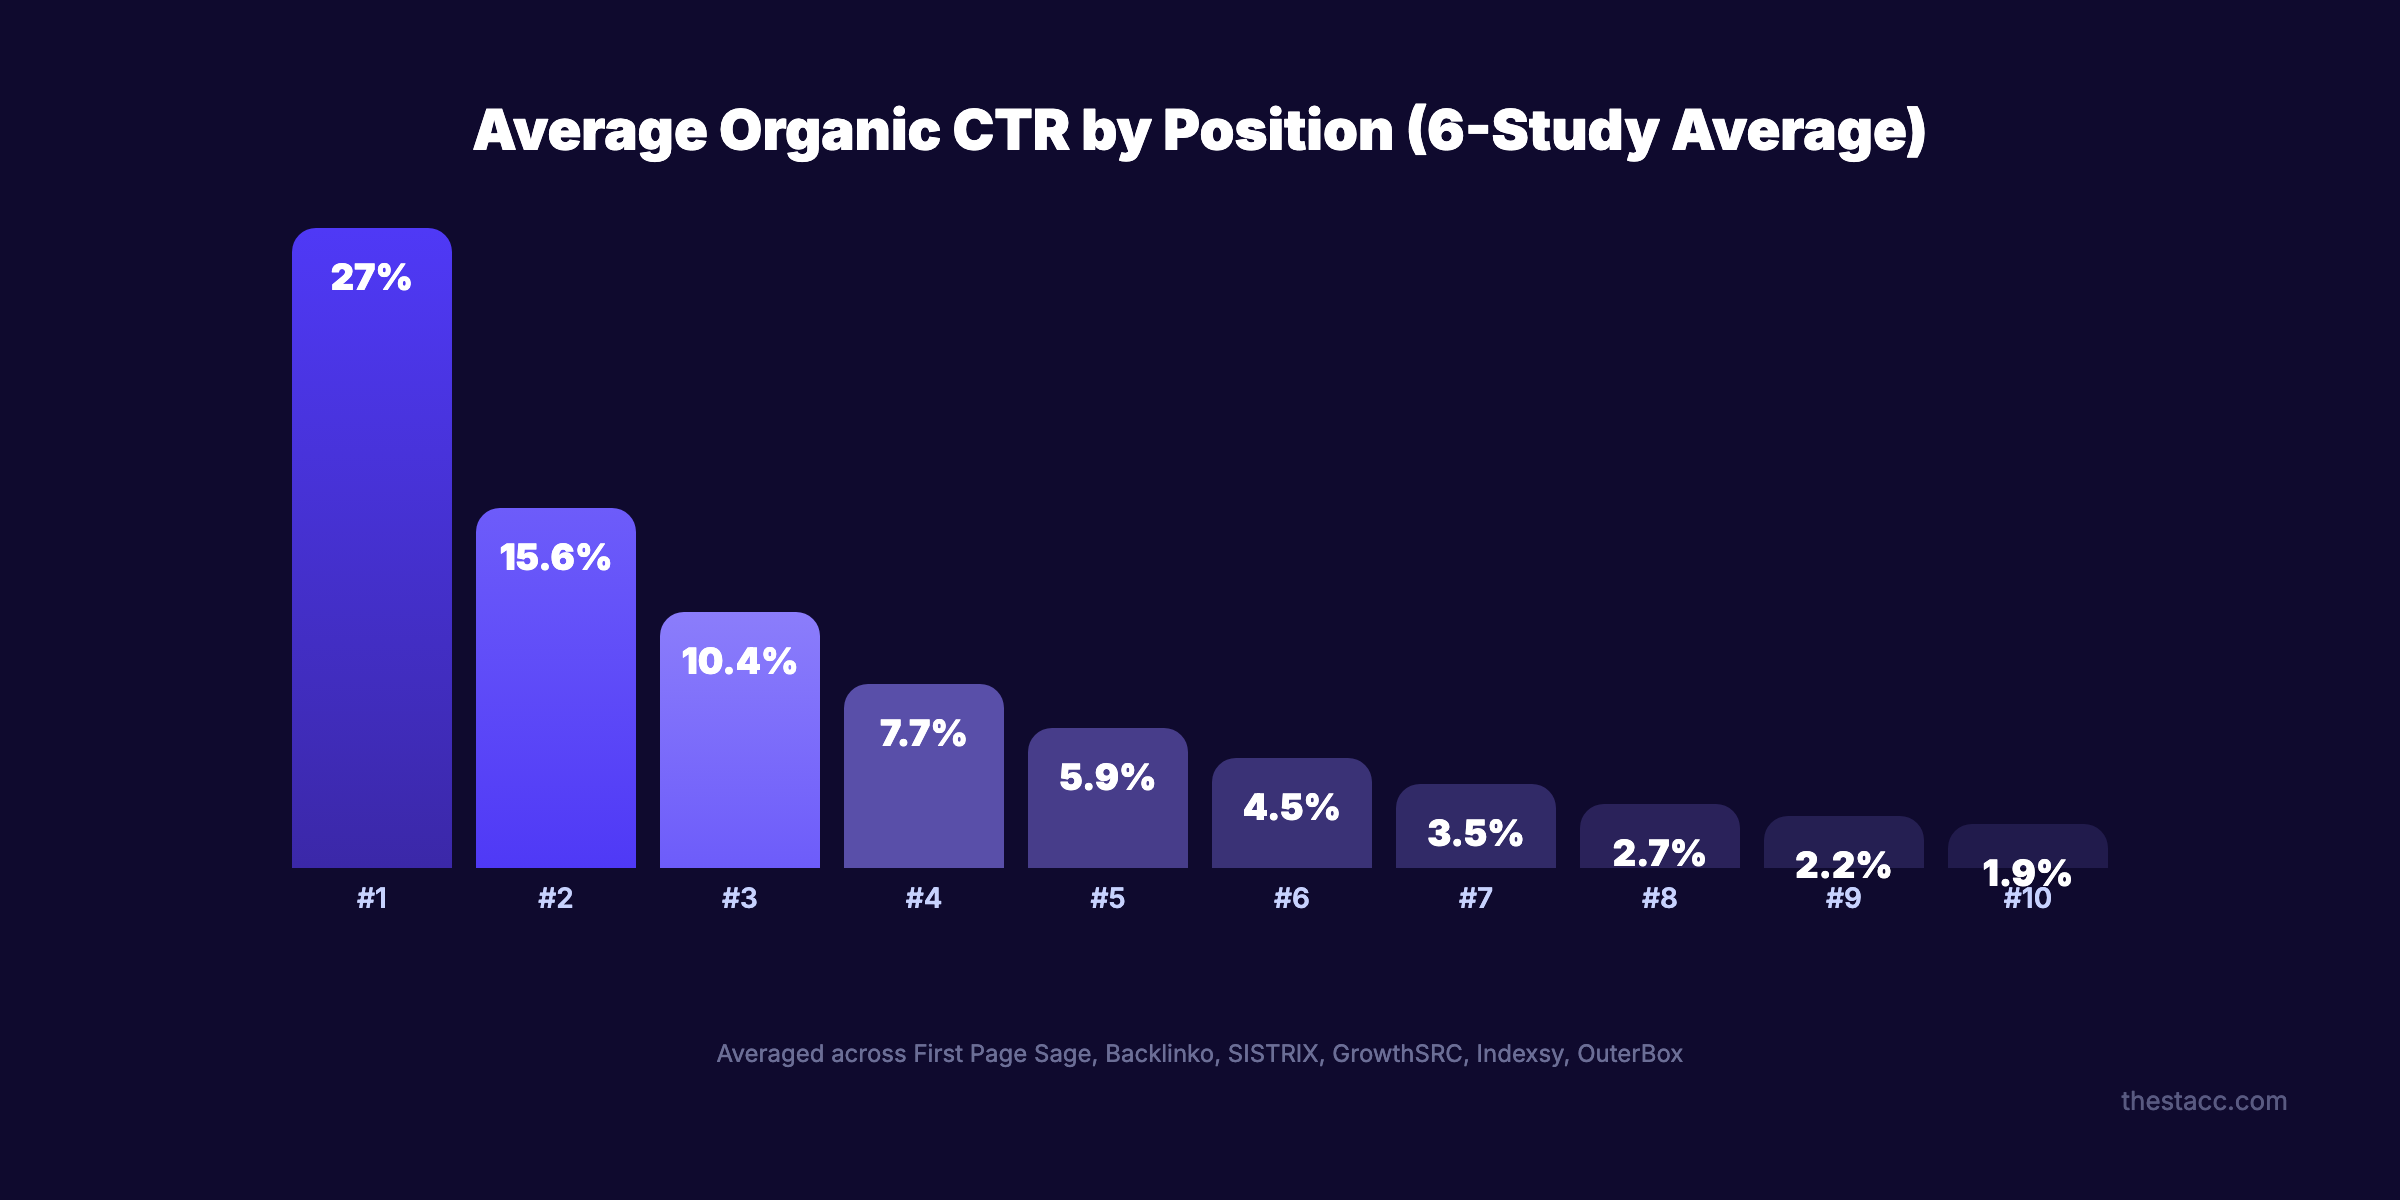
Position 1 on Google gets between 19% and 39.8% of all clicks, depending on the study, device, and whether AI Overviews appear. The average across 6 major studies is roughly 27%. Position 2 drops to 15%. By position 10, you are under 2%.
Understanding organic CTR by position is critical for SEO planning. It determines how much traffic a ranking is actually worth, how to set realistic traffic goals, and where to focus your optimization efforts.
The problem is that most CTR data floating around is outdated. Studies from 2019 and 2020 do not account for AI Overviews, expanded People Also Ask boxes, and the zero-click search features that now dominate Google results. CTR curves have shifted dramatically.
We compiled organic CTR data from 6 major studies published between 2024 and 2026, covering millions of keywords and search results. This page gives you every number you need, organized by position, device, query type, and SERP feature impact.
Here is what the data shows:
- Position-by-position CTR from 6 independent studies
- How AI Overviews reduce CTR by 58% for position 1
- Mobile vs. desktop CTR differences
- Branded vs. non-branded query CTR
- Industry-specific CTR data
- How to audit your own CTR in Google Search Console
Organic CTR by Position: The Complete Data
Here is the CTR for positions 1-10 from 6 major studies. Each uses a different dataset and methodology, which explains the variation.
Position 1-10 CTR Across 6 Studies
| Position | First Page Sage (2025) | Backlinko (4M results) | SISTRIX (80M keywords) | GrowthSRC (200K keywords) | Indexsy (Meta-analysis) | OuterBox (2025) |
|---|---|---|---|---|---|---|
| 1 | 39.8% | 27.6% | 28.5% | 19.0% | 26.4% | 20.5% |
| 2 | 18.7% | 15.8% | 15.7% | 13.1% | 15.4% | 13.5% |
| 3 | 10.2% | 11.0% | 11.0% | 9.8% | 10.1% | 10.2% |
| 4 | 7.2% | 8.4% | 8.0% | 7.7% | 7.3% | 7.8% |
| 5 | 5.1% | 7.0% | 6.3% | 5.3% | 5.6% | 5.9% |
| 6 | 4.4% | 5.1% | 4.7% | 4.1% | 4.3% | 4.4% |
| 7 | 3.0% | 4.1% | 3.5% | 3.3% | 3.4% | 3.5% |
| 8 | 2.1% | 3.2% | 2.7% | 2.7% | 2.7% | 2.8% |
| 9 | 1.9% | 2.8% | 2.1% | 2.2% | 2.2% | 2.1% |
| 10 | 1.6% | 2.5% | 1.8% | 1.9% | 1.8% | 1.7% |
Sources: First Page Sage, Backlinko, SISTRIX, GrowthSRC, Indexsy, OuterBox
Key Patterns Across All Studies
Three patterns hold true regardless of which study you reference:
1. Position 1 captures disproportionate traffic. The gap between position 1 and position 2 is the largest gap on the page. Position 1 gets 1.7x to 2.1x more clicks than position 2.
2. CTR drops sharply after position 3. Positions 1-3 collectively capture 55-70% of all clicks. Positions 4-10 split the remaining 30-45%.
3. Page 2 is effectively invisible. Position 11+ gets under 1% CTR. 96.55% of all pages get zero organic traffic, and ranking on page 2 is a major reason why.
The practical takeaway: moving from position 4 to position 1 can triple your traffic. Moving from position 11 to position 10 delivers almost nothing. Focus your efforts on queries where you are already on page 1.
How AI Overviews Change CTR
AI Overviews are the biggest CTR disruptor since featured snippets. When Google displays an AI-generated summary at the top of search results, click-through rates for all organic positions drop significantly.
CTR With vs. Without AI Overviews
| Position | Without AI Overview | With AI Overview | CTR Change |
|---|---|---|---|
| 1 | 27.6% | ~11.6% | -58% |
| 2 | 15.8% | ~8.4% | -47% |
| 3 | 11.0% | ~6.3% | -43% |
| 4-10 | 3-8% | 1.5-4% | -40 to -50% |
Source: Ahrefs AI Overviews study (December 2025, 300K keywords)
AI Overviews now appear on 30%+ of all queries, up from 6.49% in January 2025. Queries with AI Overviews have an 83% zero-click rate compared to 60% without.
The silver lining: sites cited within AI Overviews receive 35% more clicks than those not cited. Getting your content into the AI Overview partially offsets the CTR loss. Read our guide on optimizing for Google AI Overviews for specific tactics.
Stop writing. Start ranking. Stacc publishes 30 optimized SEO articles per month for $99. Start for $1 →
Mobile vs. Desktop CTR
Device type significantly affects click-through rates. Mobile screens show fewer results above the fold, which concentrates clicks on the top positions.
CTR by Device
| Position | Desktop CTR | Mobile CTR |
|---|---|---|
| 1 | 32.0% | 26.9% |
| 2 | 17.1% | 14.5% |
| 3 | 12.5% | 9.8% |
| 4 | 8.6% | 6.9% |
| 5 | 6.8% | 5.1% |
Source: seoClarity (12M keywords)
Desktop users click position 1 at a higher rate because they see more of the result. Mobile users face more SERP features, ads, and smaller screen real estate before reaching organic results.
The AI Overview impact also varies by device. AI Overviews reduce desktop CTR by 56.1% but mobile CTR by 48.2%. Desktop users appear to engage more with AI summaries.
Since over 60% of all searches happen on mobile, your effective CTR is closer to the mobile numbers for most queries. Factor this into traffic forecasting.
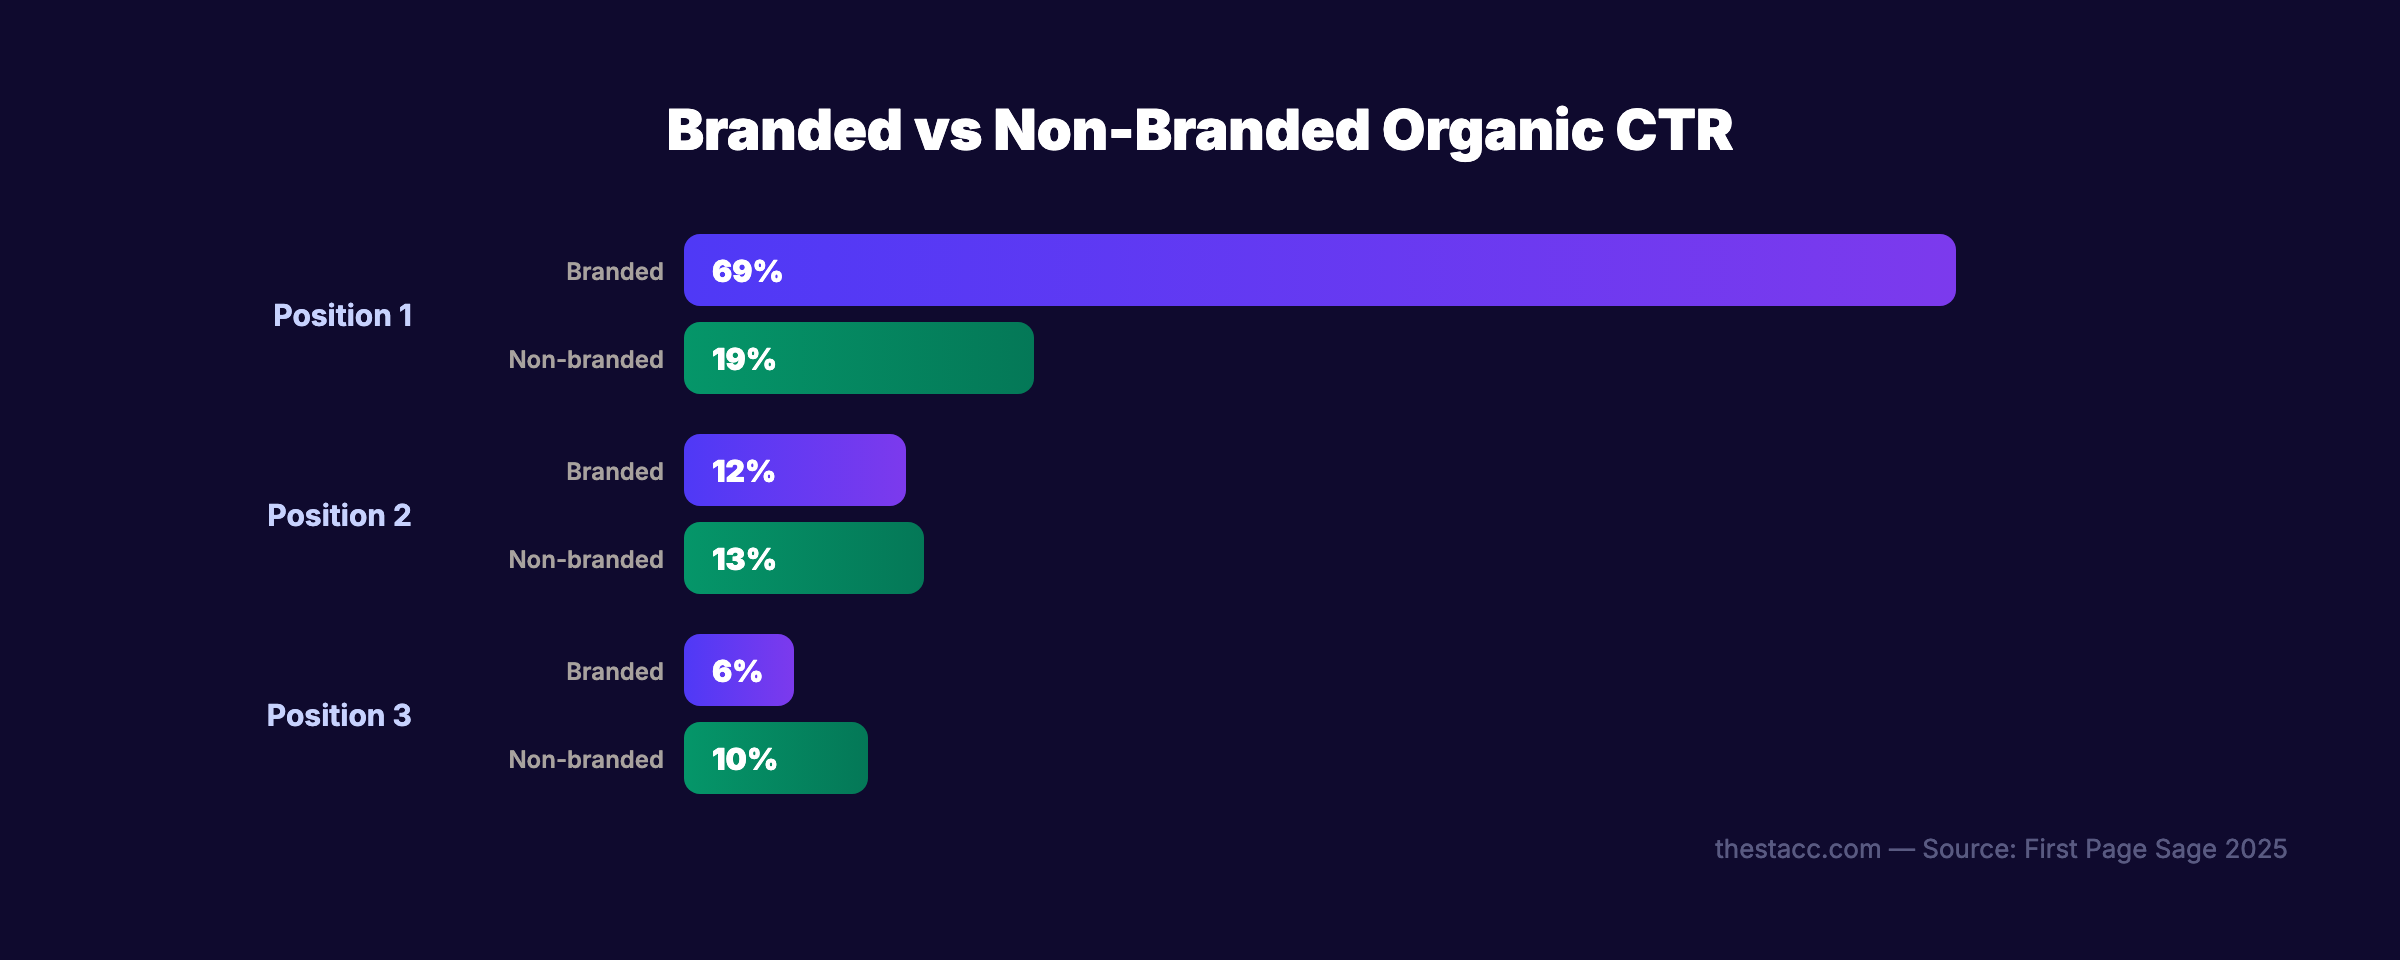
Branded vs. Non-Branded CTR
The difference between branded and non-branded queries is one of the most dramatic CTR splits.
| Query Type | Position 1 CTR | Position 2 CTR | Position 3 CTR |
|---|---|---|---|
| Branded (“Nike shoes”) | 69% | 12% | 6% |
| Non-branded (“running shoes”) | 19% | 13% | 10% |
Source: First Page Sage (2025)
Branded queries show extreme concentration at position 1 because users already know what they want. They search “Nike” to find Nike. The click almost always goes to the brand.
Non-branded queries distribute clicks more evenly across positions because users are comparing options. This is where ranking positions 2-5 still deliver meaningful traffic.
What This Means for Your Strategy
- If you rank #1 for your brand name: Protect this position. Losing it costs you 69% CTR.
- If you rank #3-5 for non-branded keywords: You still capture real traffic. Improve title tags and meta descriptions to maximize CTR at your current position.
- If you chase non-branded keywords: Positions 1-3 are the target. Position 4+ delivers diminishing returns.
For guidance on optimizing your title tags and meta descriptions to increase CTR, see our on-page SEO guide.
Featured Snippet CTR
Featured snippets (position 0) change the CTR curve entirely. When a featured snippet appears, it steals clicks from all other positions.
| SERP Feature | CTR |
|---|---|
| Featured snippet | 42.9% |
| Traditional position 1 (no snippet) | 27.6% |
| Position 1 (with snippet above) | ~19.6% |
| AI Overview citation | +35% vs non-cited |
Source: First Page Sage, Ahrefs, Amsive
If you can win a featured snippet, your CTR exceeds what a standard position 1 earns. The snippet steals roughly 8 percentage points from the position 1 result below it.
People Also Ask boxes appear in 75% of all searches and absorb 15-20% of total search interactions. Each PAA expansion is a micro-impression for your brand even if the user does not click.
For step-by-step instructions on winning featured snippets, read our featured snippet optimization guide. Also see our guide on optimizing for People Also Ask.
CTR by Industry
CTR varies significantly by industry. Users in different sectors behave differently and face different SERP layouts.
| Industry | Position 1 CTR | Position 2 CTR |
|---|---|---|
| Industrial / IoT | 43.0% | 20.1% |
| Arts / Entertainment | 42.2% | 19.8% |
| Real Estate | 41.7% | 19.5% |
| Health | 40.9% | 19.2% |
| Travel / Hospitality | 40.1% | 18.5% |
| Education | 38.6% | 18.1% |
| Finance / Insurance | 37.2% | 17.4% |
| B2B / Technology | 36.8% | 17.0% |
| Restaurants / Food | 36.3% | 16.8% |
| E-commerce / Retail | 35.4% | 16.2% |
Source: First Page Sage (2025)
E-commerce has the lowest position 1 CTR because Google shows shopping ads, product carousels, and image results that divert clicks. Industrial and arts queries have fewer SERP features, so organic results capture more clicks.
Know your industry baseline. If your position 1 CTR is below your industry average, your title tag or meta description needs work. If it exceeds the average, your SEO content is well-optimized.
Your SEO team. $99 per month. 30 optimized articles published automatically. No writers. No agencies. Start for $1 →
CTR by Keyword Type
Short-tail and long-tail keywords produce very different CTR curves.
| Keyword Type | Position 1 CTR | Conversion Rate | Competition |
|---|---|---|---|
| Short-tail (1-2 words) | 15-22% | 1-3% | Very high |
| Medium-tail (3-4 words) | 25-32% | 3-5% | Medium |
| Long-tail (5+ words) | 35-45% | 5-10% | Low |
Long-tail keywords deliver 3-5x higher CTR and 2-3x better conversion rates than short-tail queries. This happens because long-tail queries have more specific intent. A user searching “best CRM for small real estate team” knows exactly what they want.
This is why keyword research that targets long-tail variations is so valuable. You may rank more easily and get more clicks per ranking.
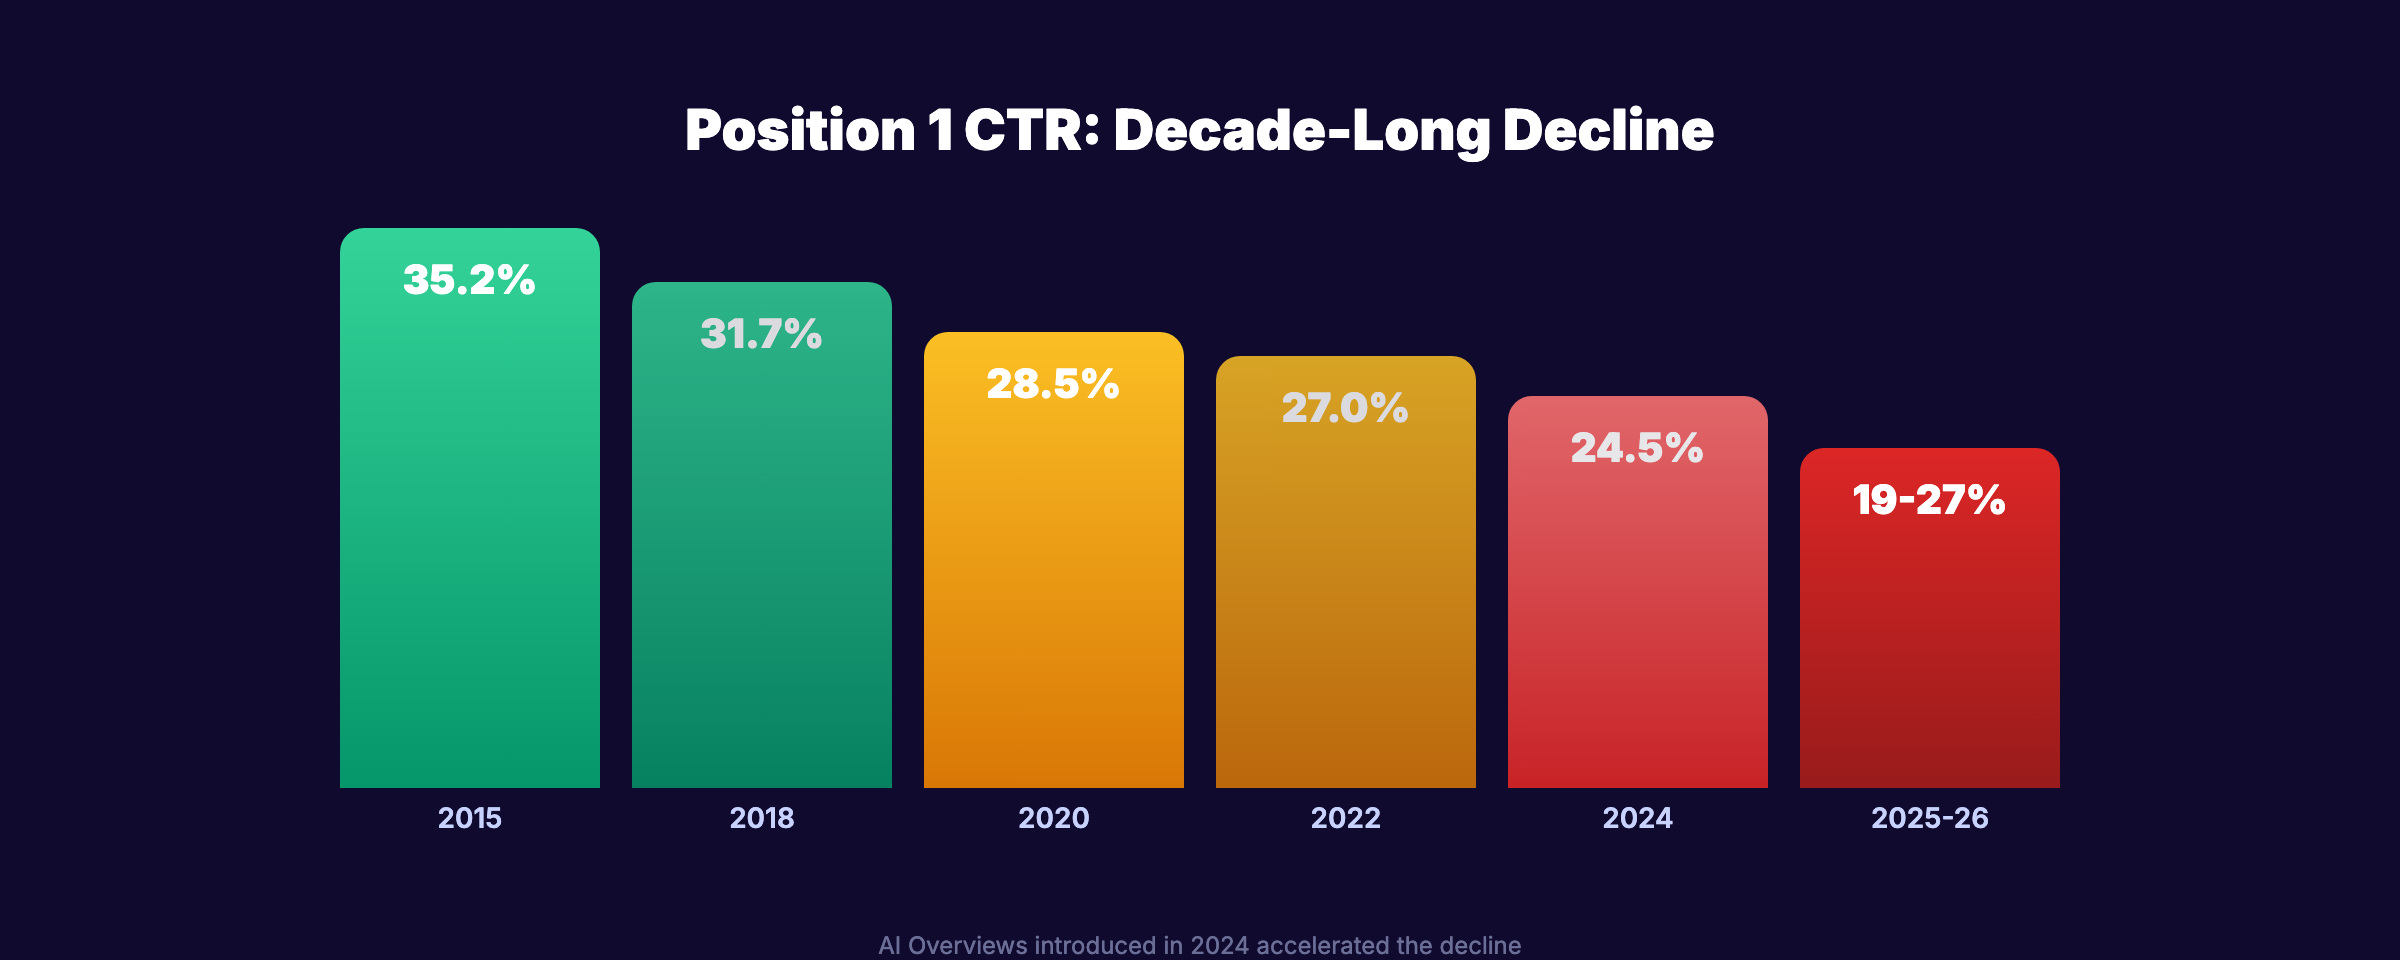
Year-Over-Year CTR Decline
Organic CTR has declined steadily as Google adds more SERP features, ads, and AI-generated content above organic results.
| Year | Position 1 Average CTR |
|---|---|
| 2015 | 35.2% |
| 2018 | 31.7% |
| 2020 | 28.5% |
| 2022 | 27.0% |
| 2024 | 24.5% |
| 2025-2026 | 19-27% (depends on AI Overview presence) |
The trend is clear. Position 1 CTR has dropped roughly 8-16 percentage points over the past decade. The introduction of AI Overviews in 2024-2025 accelerated this decline.
This does not mean ranking #1 is worthless. It means traffic from a #1 ranking is worth less than it used to be. You need more #1 rankings to generate the same traffic volume, or you need to capture visibility through SERP features like snippets and PAA boxes.
How to Audit Your Own CTR
Your actual CTR may differ significantly from industry averages. Here is how to find your real numbers.
Step 1: Open Google Search Console
Go to Google Search Console. Open the Search Results report. Enable the CTR column.
Step 2: Filter by Average Position
Sort queries by average position. Look at queries where you rank in positions 1-5. Note the CTR for each.
Step 3: Compare to Benchmarks
Compare your actual CTR against the data in this article. If your position 1 queries have a 15% CTR while the benchmark is 27%, your title tags and meta descriptions are underperforming.
Step 4: Identify Improvement Opportunities
Look for queries with:
- High impressions, low CTR — Your title or description is not compelling enough. Rewrite it.
- Position 1-3, below-average CTR — A SERP feature (snippet, PAA, AI Overview) may be stealing clicks. Try to win that feature.
- Position 4-10, above-average CTR — Your title is effective. Focus on moving this keyword higher in rankings.
Step 5: Optimize Title Tags and Meta Descriptions
The fastest way to increase CTR without changing rankings:
- Add numbers to titles (“7 Ways to…” or “2026 Guide”)
- Include your primary keyword in the first 30 characters
- Use power words (Complete, Proven, Essential, Updated)
- Write meta descriptions with a clear benefit and CTA
- Add the current year for freshness signals
Use our meta tag analyzer to check your title and description length. Set up Google Analytics 4 to track how CTR changes affect traffic.
3,500+ blogs published. 92% average SEO score. See what Stacc can do for your site. Start for $1 →
Key Takeaways
- Position 1 captures 19-39.8% of clicks depending on the study, device, and SERP features present.
- Positions 1-3 get 55-70% of all clicks. Ranking outside the top 3 means fighting for scraps.
- AI Overviews reduce position 1 CTR by 58%. Getting cited in an AI Overview offsets this with a 35% click boost.
- Mobile CTR is lower than desktop (26.9% vs. 32% for position 1). Most searches happen on mobile.
- Branded queries concentrate 69% of clicks at position 1. Non-branded distribute more evenly.
- Long-tail keywords deliver 3-5x higher CTR and better conversion rates than short-tail.
- Position 1 CTR has dropped 8-16 points over the past decade. You need more rankings to generate the same traffic.
Methodology
Sources: First Page Sage, Backlinko, SISTRIX, GrowthSRC, Indexsy, OuterBox, seoClarity, Ahrefs, Amsive, Seer Interactive, Advanced Web Ranking.
Data coverage: Combined datasets cover millions of keywords and billions of search impressions.
Last updated: March 2026.
Note: We update this page quarterly to ensure all statistics remain current. CTR benchmarks shift as Google modifies SERP layouts. If you notice outdated data, contact us.
FAQ
What is a good organic CTR for position 1?
The benchmark is 20-28% for non-branded queries without AI Overviews. With AI Overviews present, expect 10-12%. If your position 1 CTR falls below these ranges, optimize your title tag and meta description.
Why do different studies show different CTR numbers?
Each study uses a different dataset, time period, industry mix, and methodology. First Page Sage filters for non-branded desktop queries, which inflates position 1 CTR. GrowthSRC includes all query types, which deflates it. Use the range, not a single number.
Does organic CTR affect rankings?
Google has not confirmed CTR as a direct ranking factor. However, higher CTR leads to more traffic, more engagement, and more signals that can indirectly improve rankings. A compelling title tag helps both CTR and rankings.
How has AI Overview affected organic CTR?
AI Overviews reduce position 1 CTR by approximately 58% according to Ahrefs. They now appear on 30%+ of queries. However, sites cited in AI Overviews receive 35% more clicks than non-cited sites. The strategy is to get cited, not to ignore AI Overviews.
What position should I target for traffic?
Positions 1-3 capture the majority of clicks. If you rank position 4-10, your CTR is typically under 8%. Focus on moving position 4-10 keywords into the top 3. For new keywords, target long-tail queries where position 1 is achievable.
How often does CTR data change?
CTR benchmarks shift every time Google changes the SERP layout. Major changes occurred with the introduction of AI Overviews (2024), expanded People Also Ask (2023), and knowledge panels (2020). We update this page quarterly.
Organic CTR determines how much real traffic your rankings actually deliver. The data is clear: position matters, but SERP features, device type, and query intent matter just as much. Use this data to set realistic traffic expectations, identify underperforming pages, and focus your SEO efforts where they will generate the most clicks.
Skip the agency. Keep the results. Stacc starts at $99/mo with a $1 trial. Start for $1 →
Written and published by Stacc. We publish 3,500+ articles per month across 70+ industries. All data verified against public sources as of March 2026.
