Google's March 2026 core update changed rankings for 55% of sites. We analyzed 2,000+ domains to reveal what won, what lost, and what to do next.
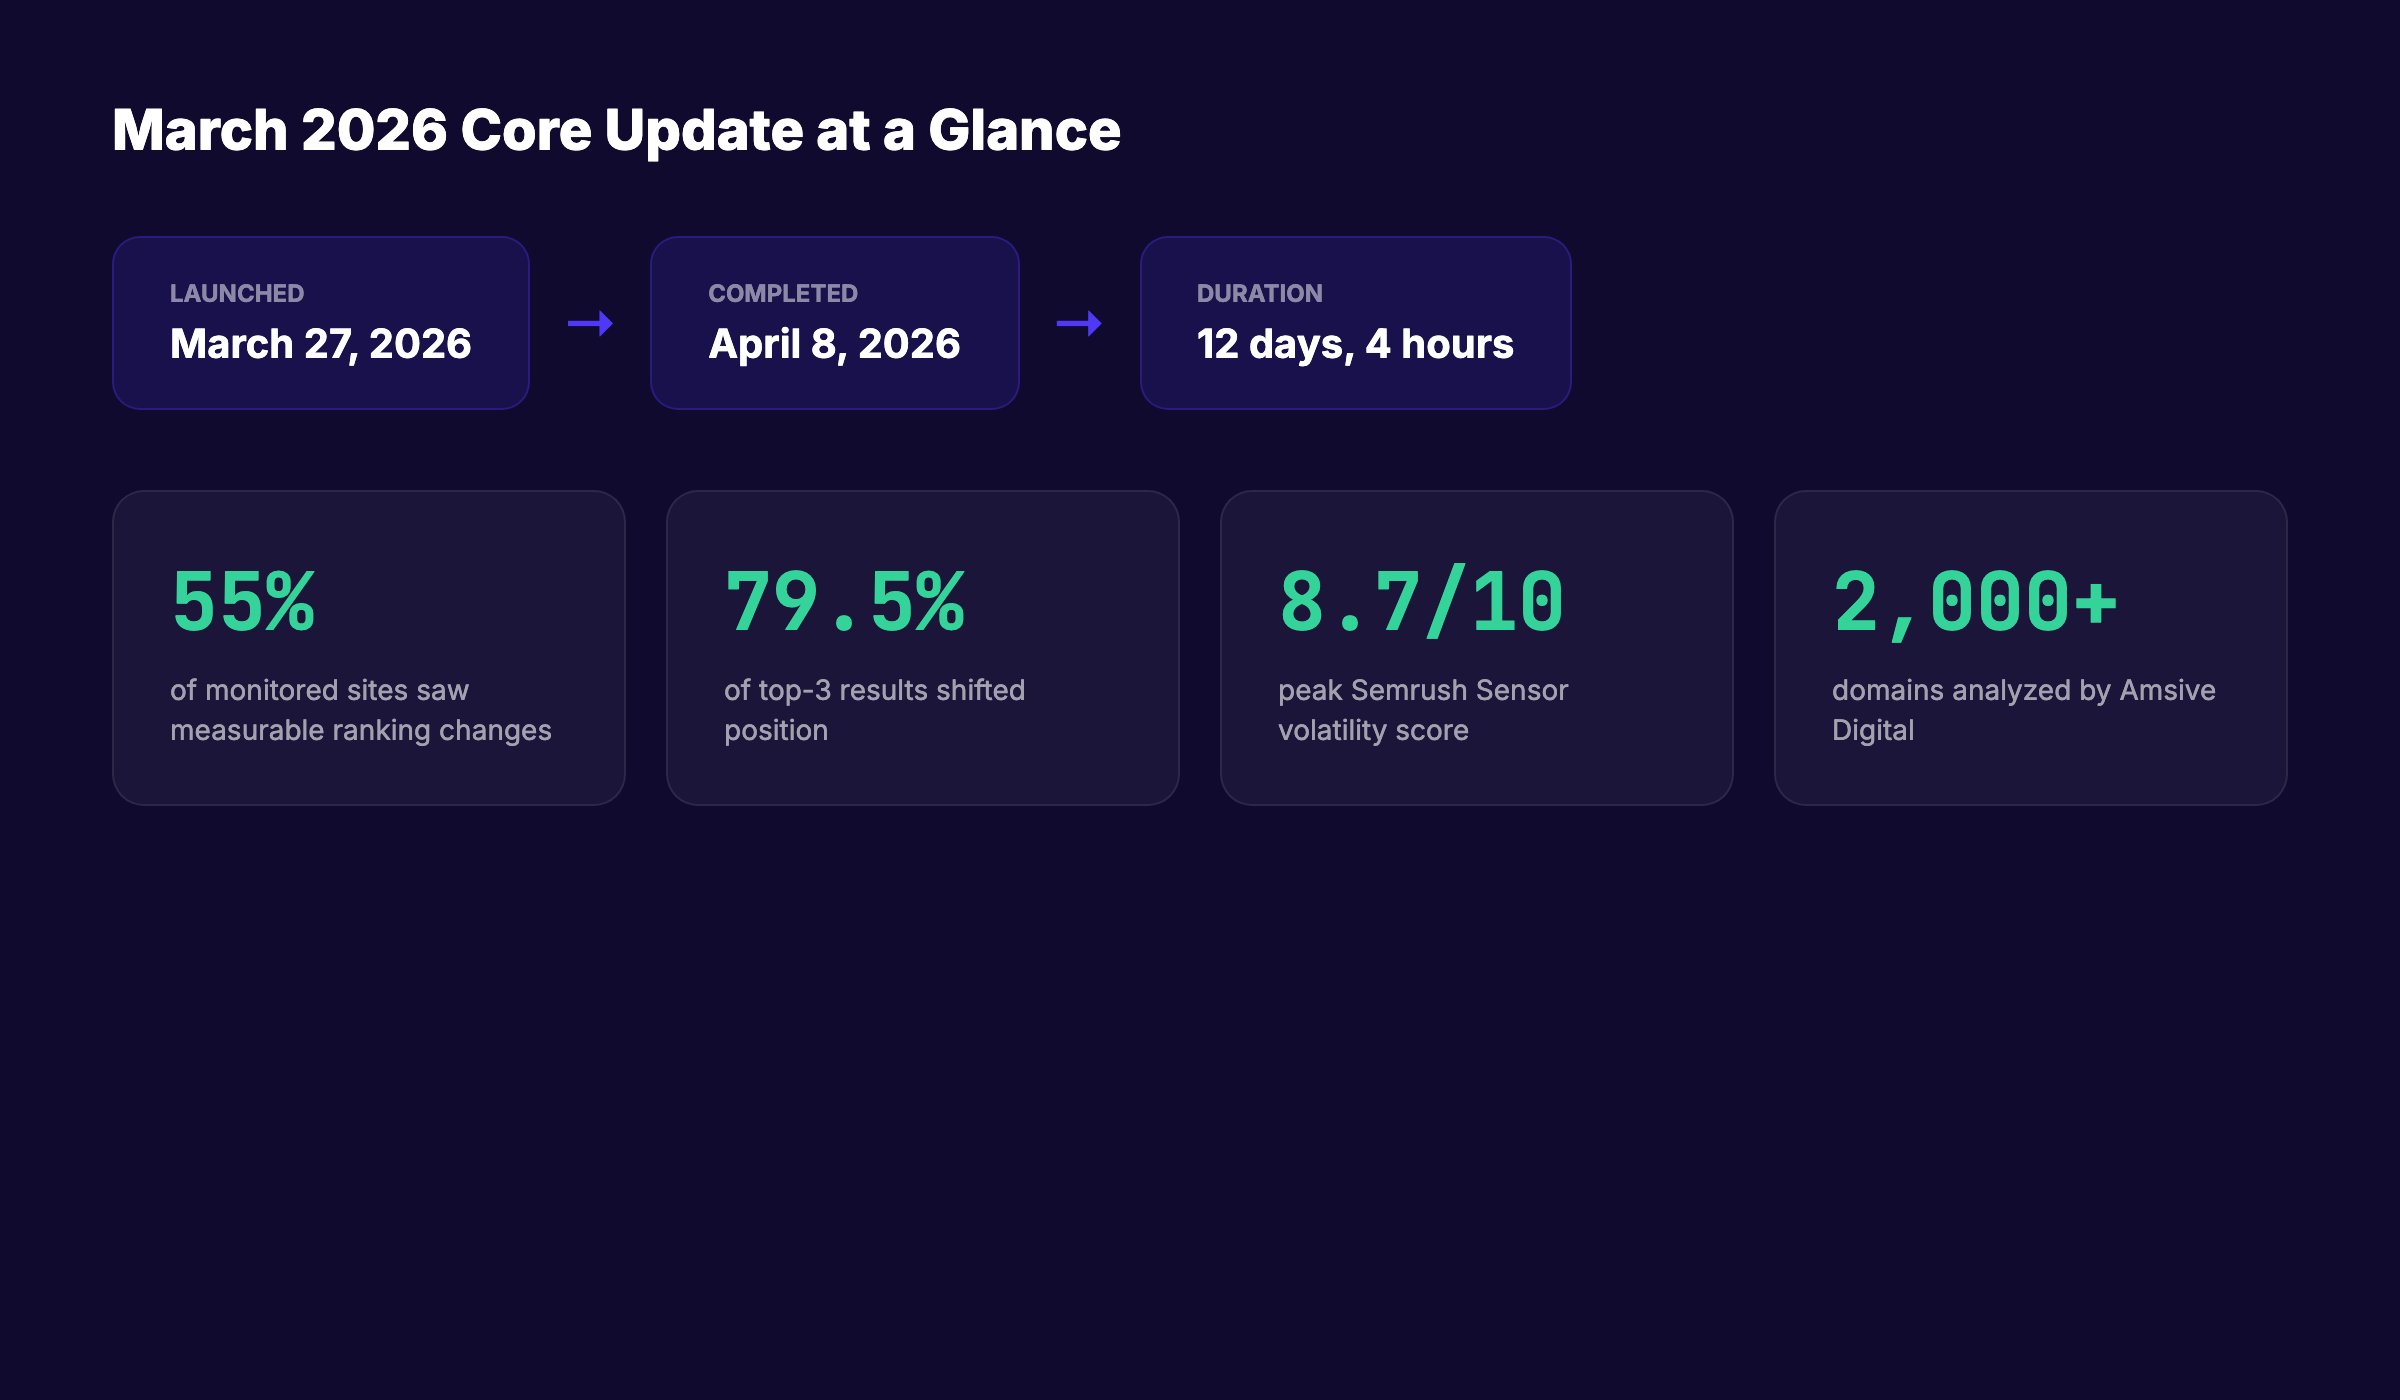
Google's March 2026 core update reshaped search rankings across every major vertical. The update began on March 27, 2026, and completed its rollout on April 8 after 12 days and 4 hours. Amsive Digital analyzed more than 2,000 domains and found that 55% of monitored sites registered measurable ranking changes. Semrush Sensor peaked at 8.7 out of 10, the highest reading of 2026.
July 2026 operator note: Keep this page citation-ready: dated stats, question-style H2s, FAQ answers, and clear entities so Google AI Overviews, ChatGPT, Perplexity, and Grok can reuse it.
If your traffic shifted during that window, you are not alone. Nearly 80% of top-three results moved position. This was not a minor tweak. It was the most volatile core update in recent memory, and the patterns reveal exactly what Google now values.
Stacc tracks algorithm changes and their impact on content performance. Our editorial team reviewed data from Amsive, SISTRIX, Semrush, and Ahrefs to build this analysis. Here is what you will learn: the exact timeline and scope of the update, which sites won and lost with specific numbers, the four content signals that drove the biggest shifts, what the data means for your SEO strategy, and a practical checklist to protect your rankings.
Key Findings at a Glance
| Finding | Data Point | Source |
|---|---|---|
| Rollout duration | 12 days, 4 hours | Google Search Status |
| Sites with measurable changes | 55% | Amsive Digital |
| Top-3 result volatility | 79.5% | SISTRIX |
| Peak Semrush Sensor score | 8.7/10 | Semrush |
| Top-10 pages that disappeared | 24.1% | SISTRIX |
| AI content farm traffic loss | 60-80% | Multiple sources |
| Average winner visibility gain | 22% | Ahrefs |
| Affiliate sites negatively impacted | 71% | Digital Applied |
| Loser-to-winner ratio (Germany) | 4:1 | SISTRIX |
What the March 2026 Core Update Changed
The March 2026 core update was a broad recalibration of Google's ranking systems across all sectors and languages. Google announced it on March 27 through the Google Search Central X account, calling it "a regular update designed to better surface relevant, satisfying content for searchers from all types of sites." The rollout finished on April 8 at 6:12 AM PDT.
This was Google's first broad core update of 2026. It followed the March 2026 spam update, which completed in under 20 hours on March 24-25, and the February 2026 Discover core update. The proximity of these three updates meant sites were evaluated against tightened quality thresholds in rapid succession.
What made this update different from previous core updates was the scale of movement. SISTRIX data showed that 79.5% of top-three results shifted position, making this the most volatile core update on record. The December 2025 core update, by comparison, drove significantly less movement. Google did not announce any new policies or ranking factors. Instead, the update appeared to reweight existing signals, with dramatic consequences for specific site categories.
The dominant pattern SEO analysts identified was a "first-party correction." Google redirected visibility away from platforms that host or discuss content and toward sites that own or create the content. Aggregators, user-generated content platforms, and thin affiliate sites lost ground. Official sources, brand-owned domains, and government sites gained.
Biggest Winners and Losers by the Numbers
Absolute Visibility Changes (SISTRIX Data)
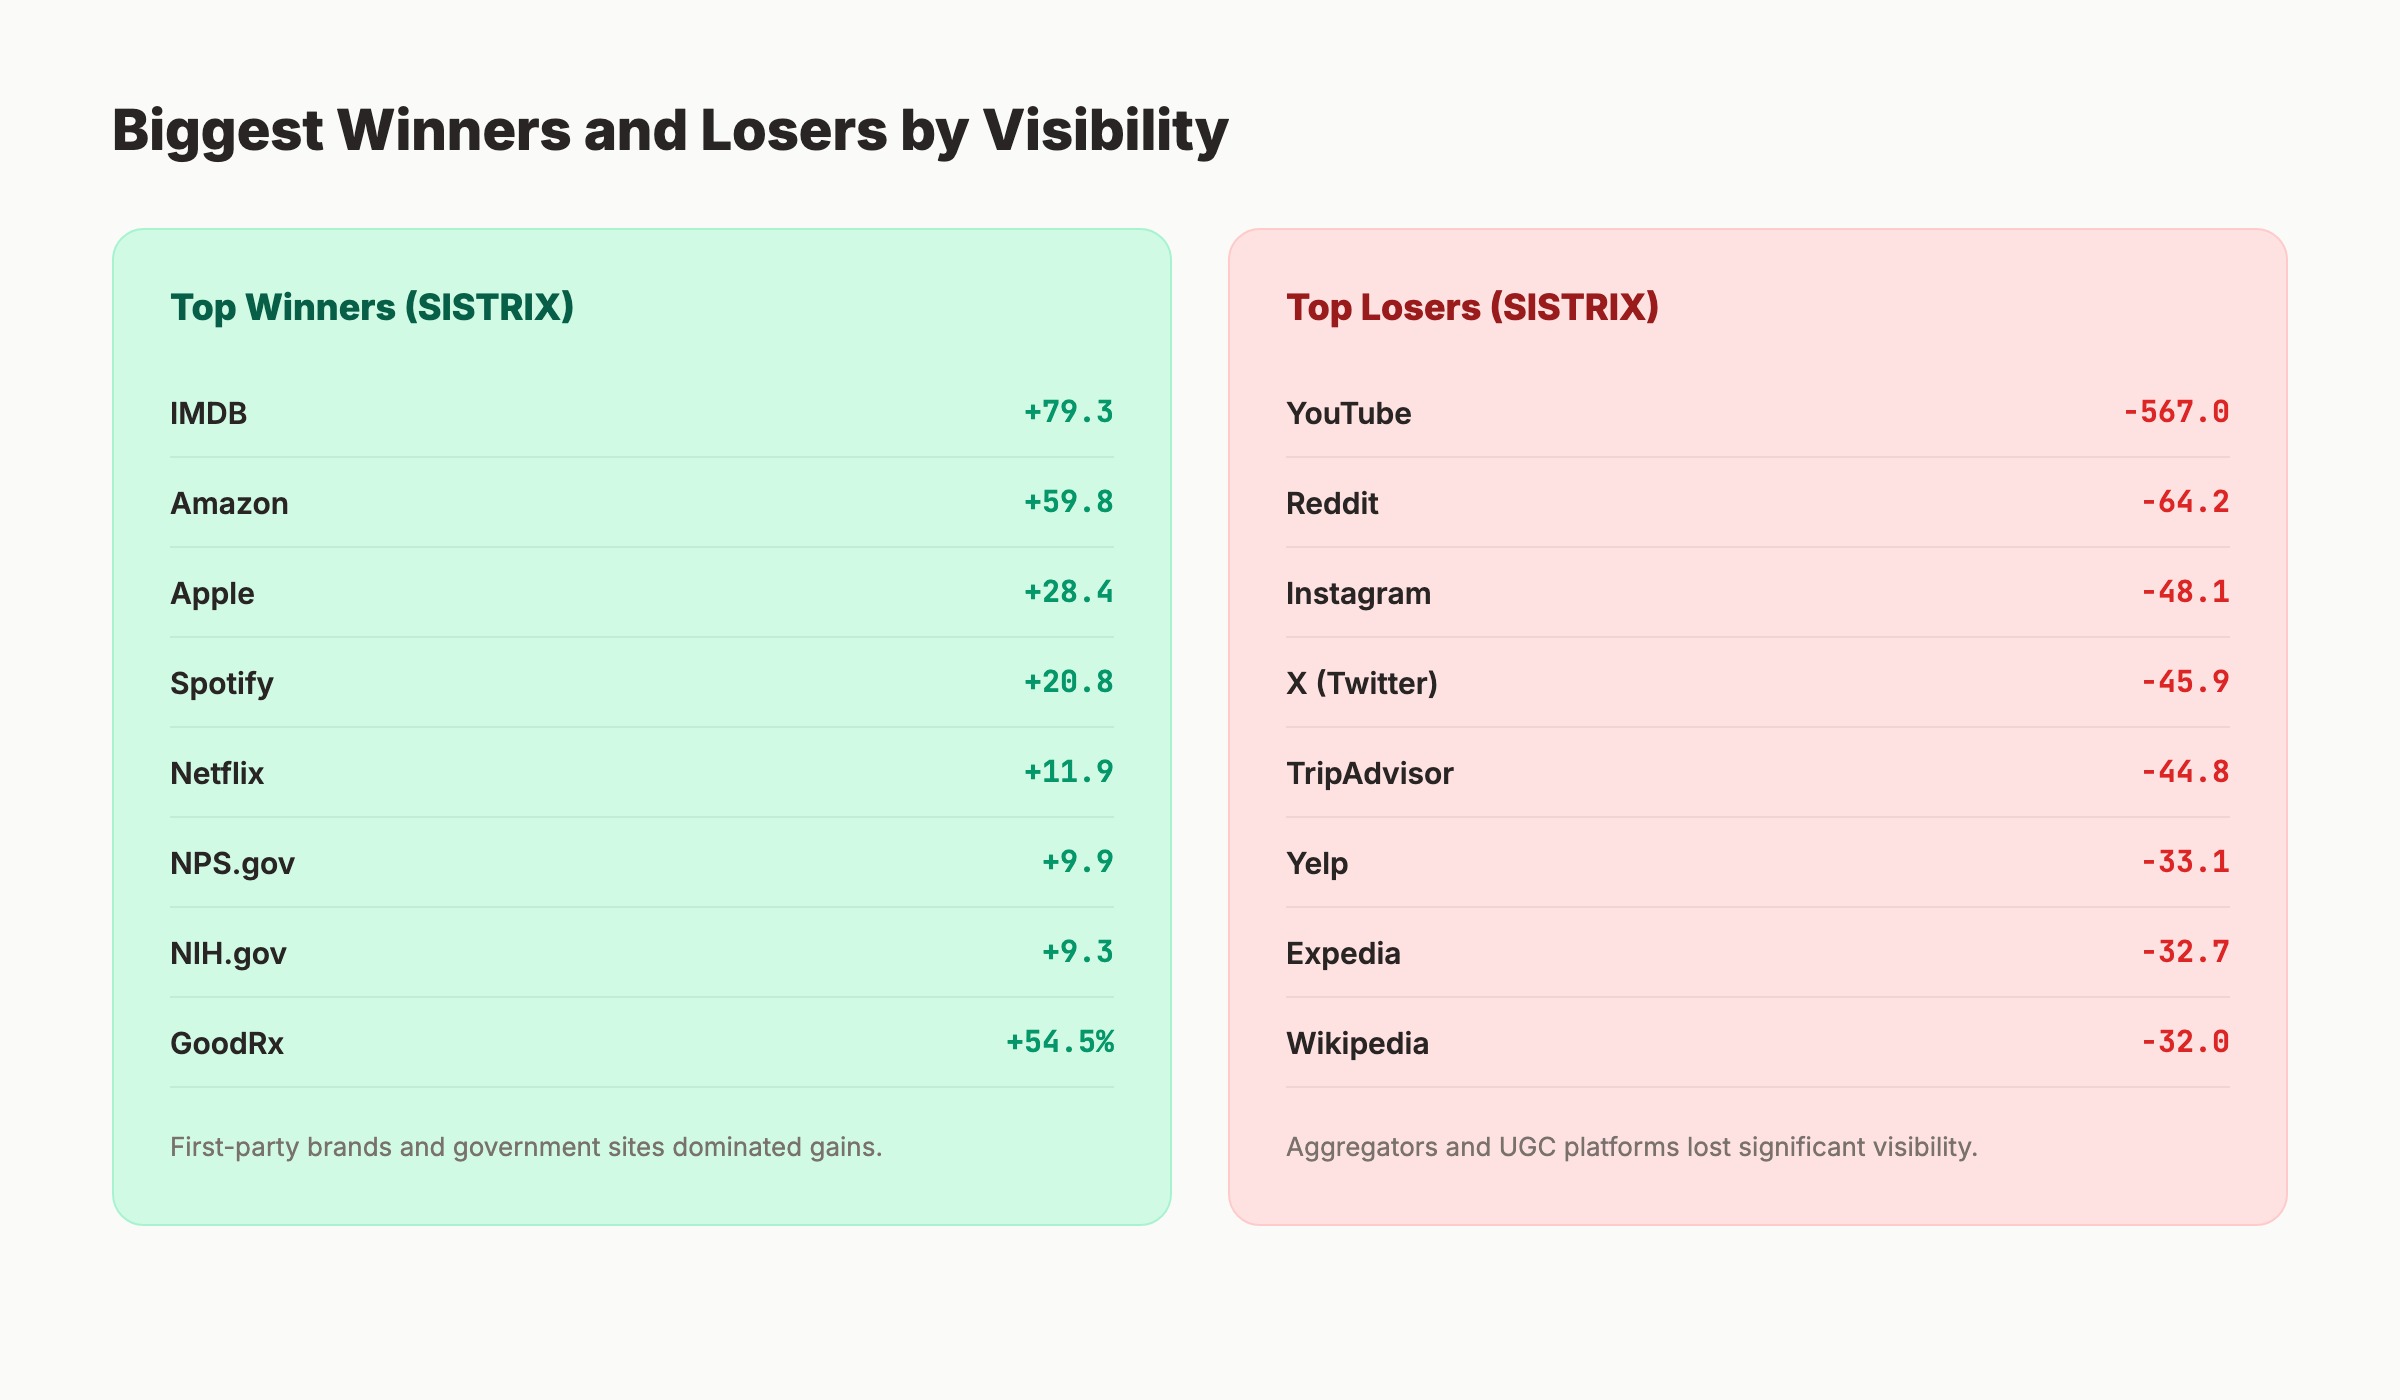
Amsive Digital, led by analyst Lily Ray, examined over 2,000 domains using SISTRIX visibility index data. The comparison window ran from March 27 to April 8. The results show a clear redistribution of search visibility.
Largest Losers:
| Domain | Visibility Change | Category |
|---|---|---|
| youtube.com | -566.97 | Social / UGC |
| reddit.com | -64.24 | Social / UGC |
| instagram.com | -48.13 | Social |
| x.com | -45.93 | Social |
| tripadvisor.com | -44.78 | Travel aggregator |
| vocabulary.com | -33.31 | Education |
| yelp.com | -33.06 | Local / reviews |
| expedia.com | -32.70 | Travel OTA |
| wikipedia.org | -32.04 | Reference |
| ebay.com | -29.12 | Ecommerce |
YouTube's drop was historic. At 567 visibility points, it was roughly 30% larger than Wikipedia's 435-point loss during the December 2025 core update. However, YouTube's decline returned it to the level it held before an early March surge, not a new baseline low.
Largest Winners:
| Domain | Visibility Change | Category |
|---|---|---|
| imdb.com | +79.30 | Entertainment |
| amazon.com | +59.80 | Ecommerce |
| apple.com | +28.40 | Brand / entertainment |
| spotify.com | +20.80 | Entertainment |
| netflix.com | +11.90 | Entertainment |
| nps.gov | +9.90 | Government |
| nih.gov | +9.30 | Government / health |
| goodrx.com | +9.50 (+54.5%) | Health / pharmacy |
| hilton.com | +4.00 | Hotel brand |
| hotels.com | +3.60 | Hotel brand |
Traffic-Based Changes (Ahrefs Data)
Loganix tracked 30 domains across 10 verticals using Ahrefs traffic data, comparing March 26 to April 14. Their findings confirm the aggregator-versus-first-party pattern.
Top Traffic Losers:
| Site | Traffic Change | Vertical |
|---|---|---|
| legalzoom.com | -36.9% | Legal |
| airbnb.com | -29.5% | Travel |
| coursera.org | -15.1% | Education |
| redfin.com | -12.5% | Real estate |
| huffpost.com | -9.6% | News |
| techradar.com | -7.1% | Tech |
| bankrate.com | -4.6% | Finance |
| ebay.com | -4.0% | Ecommerce |
Top Traffic Winners:
| Site | Traffic Change | Vertical |
|---|---|---|
| forbes.com | +14.3% | News / finance |
| udemy.com | +9.4% | Education |
| medicalnewstoday.com | +9.0% | Health |
| amazon.com | +5.6% | Ecommerce |
| zillow.com | +5.3% | Real estate |
| buzzfeed.com | +4.6% | News |
| everydayhealth.com | +4.5% | Health |
| cnet.com | +4.1% | Tech |
Category-Level Breakdown
Arts and Entertainment saw the largest concentration of losers, with 147 domain appearances in the negative column. YouTube, Reddit, Instagram, and X all lost visibility. Winners included IMDB (+79.3), Amazon (+59.8), Apple (+28.4), Spotify (+20.8), Netflix (+11.9), and Grammy.com (+45.8%).
Travel and Tourism showed the first-party correction clearly. TripAdvisor (-44.8), Expedia (-32.7), and Yelp (-33.1) lost ground while Hilton (+4.0), Hotels.com (+3.6), and airport sites like JFK (+46.3%) and LaGuardia (+49.3%) gained. Spirit Airlines saw a 69.8% visibility increase.
Jobs and Education produced 103% more winners than losers. Government and employer sites dominated the positive side: USAJobs.gov (+16.3%), MyWorkdayJobs (+46.2%), HigherEdJobs (+46.3%), SnagAJob (+69.9%), and Disney Careers (+58.5%). Job aggregators suffered: Indeed (-18.1%), ZipRecruiter (-21.6%), Glassdoor (-21.7%), and SimplyHired (-29.1%).
Health showed 82% winners versus 34% losers. Government health sources gained: NIH.gov (+9.3), Cancer.org (+34.3%), and Nature.com (+24.1%). GoodRx surged 54.5%. Established medical publishers lost: Cleveland Clinic (-11.5), WebMD (-9.1), Mayo Clinic (-6.1), and KidsHealth.org (-19.4%).
Finance followed the same pattern. NerdWallet (-15.9%), CreditKarma (-34.2%), MotleyFool (-32.1%), and Zacks (-40.8%) declined. Government and institutional finance sites gained: StudentAid.gov (+28.6%), AmericanExpress.com (+23.2%), and Comenity (+84.8%).
Protect your rankings with content that meets Google's quality bar. Stacc analyzes every article against E-E-A-T signals, readability, and technical performance before publication. Our editorial process catches the issues that core updates punish. Explore Stacc's content quality tools
Four Content Signals That Drove the Biggest Shifts
The March 2026 core update did not introduce new ranking factors. It reweighted existing signals. Four patterns explain the majority of movement.
Signal 1: First-Party Authority Over Aggregation
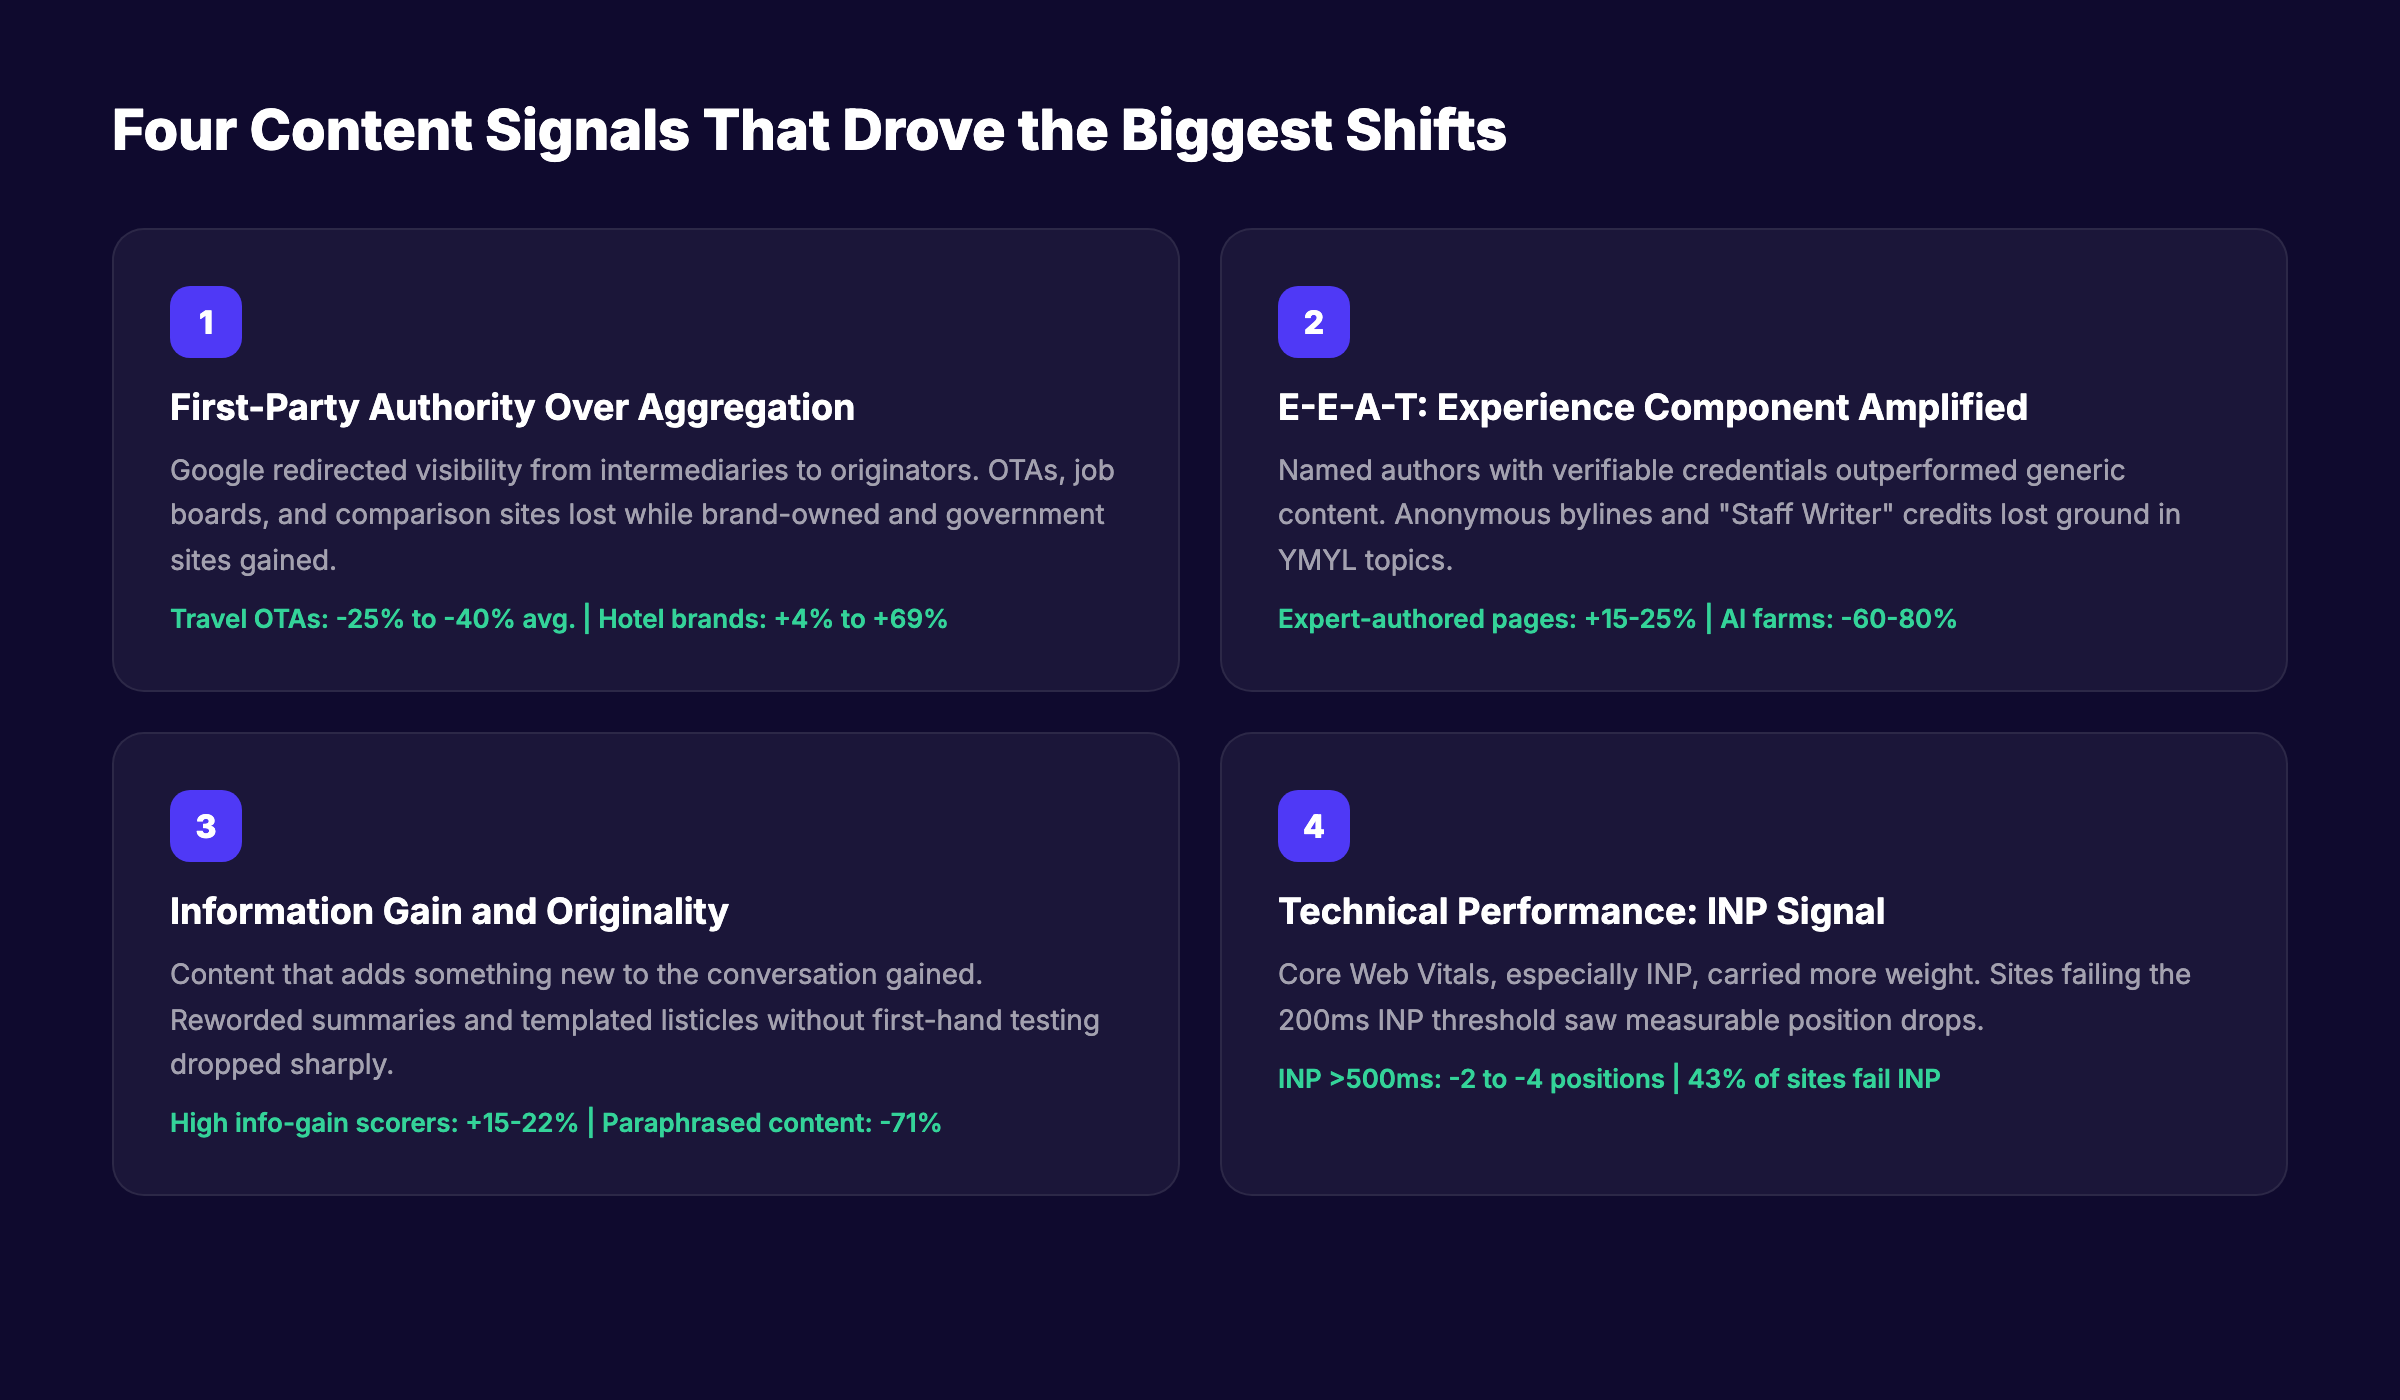
Google redirected visibility from intermediaries to originators. Sites that host, compare, or summarize content lost ground. Sites that create, own, or officially represent content gained.
This pattern appeared across every vertical. In travel, online travel agencies like Expedia and Booking.com lost while hotel chains and airline sites won. In jobs, aggregators like Indeed and ZipRecruiter lost while employer career pages and government job boards won. In health, general medical publishers lost while government health agencies and specific treatment providers won. In finance, comparison sites lost while government financial resources and brand-owned sites won.
The implication is direct. If your site exists primarily to aggregate or compare content that exists elsewhere, your moat is shrinking. Google is sending searchers to the source.
Signal 2: E-E-A-T Weighting, Especially the Experience Component
The Experience component of E-E-A-T became the primary differentiator in competitive rankings. Sites with named authors, verifiable credentials, and first-hand experience outperformed generic broad content.
Data from Digital Applied showed that expert-authored publications gained 15-25% visibility. Original research and case studies gained 10-20%. Niche authority sites gained 10-18%. In contrast, thin content with no editorial review dropped 30-50%. AI content farms without human editing lost 60-80% of organic traffic.
In YMYL verticals, the effect was stronger. Seventy-three percent of top-ranking pages in competitive health, finance, and legal topics now display clear, verifiable author credentials. Anonymous content and generic "Staff Writer" bylines are actively losing ground.
Signal 3: Information Gain and Originality
Google rewarded content that adds something new to the conversation. Sites offering reworded summaries of existing top-ranking content lost visibility. Sites with original data, unique perspectives, and first-hand observations gained.
High "information gain" scorers saw 15-22% visibility improvements according to Digital Applied. This is a democratizing factor. Lower-domain-authority sites with genuinely original insights can outrank established publishers if their content offers something the existing results do not.
The flip side is severe. Paraphrased and reworded content saw 71% traffic drops. Template "best X in Y" pages without hands-on testing dropped 35%. Programmatic city and location pages dropped 32%.
Signal 4: Technical Performance, Specifically INP
Core Web Vitals performance, particularly Interaction to Next Paint (INP), carried more weight in this update. Google had been signaling this shift since INP replaced First Input Delay as a Core Web Vital in March 2024.
Data from FixMyCWV showed that sites with INP between 200-500ms saw an average position drop of 0.8. Sites with INP above 500ms saw position drops of 2-4 places. Forty-three percent of sites fail the 200ms INP threshold. Fifty-three percent fail all three Core Web Vitals metrics simultaneously.
The business impact is measurable. Sites optimizing from poor to good Core Web Vitals see 15-30% conversion rate improvements. Every second of page load delay reduces conversions by 7%. At 2 seconds, bounce rate is 9%. At 5 seconds, it jumps to 38%.
What This Means for Your SEO Strategy
The March 2026 core update sends a clear signal about where Google is heading. The strategies that worked in 2024 and early 2025 are becoming less effective. Here is what to prioritize.
Audit Your Content for First-Party Value
Review your highest-traffic pages and ask a simple question: does this page offer something that cannot be found on the source sites we reference? If your page is a summary of other sources, your risk is elevated.
Shift toward original research, first-hand testing, proprietary data, and expert interviews. If you run a product review site, test the products. If you run a local guide, visit the locations. If you run a finance comparison, analyze the actual terms and fees.
Strengthen Author Credibility
Every YMYL page needs a named author with verifiable credentials. The author bio should include relevant education, professional experience, and links to other published work on the topic. The author's topical consistency matters. An author who writes about health one week and finance the next carries less authority than one who specializes.
Seventy-three percent of top-ranking YMYL pages now have detailed author credentials, up from 58% before the update. This is not a coincidence. It is a signal Google is actively weighting.
Measure Information Gain
Before publishing any piece of content, search the target keyword and read the current top-three results. Ask: what does our article add that these three do not cover? If the answer is nothing, do not publish. Rewrite until you have a genuine addition.
Information gain is not about length. It is about novelty. A 1,000-word article with one original insight outranks a 3,000-word rehash.
Fix Technical Performance
Run a Core Web Vitals audit on your top 50 pages. Prioritize INP fixes, especially on mobile where scores are 60-80% worse than desktop. Common INP culprits include heavy JavaScript execution, third-party scripts, and unoptimized event handlers.
The thresholds are clear. INP must be 200ms or below. LCP must be 2.5 seconds or below. CLS must be 0.1 or below. Fifty-three percent of sites fail all three. Passing all three is now a competitive advantage, not a baseline expectation.
Recovery Checklist for Sites That Lost Traffic
If your site lost traffic during the March 2026 core update, use this checklist to diagnose and fix the issues.
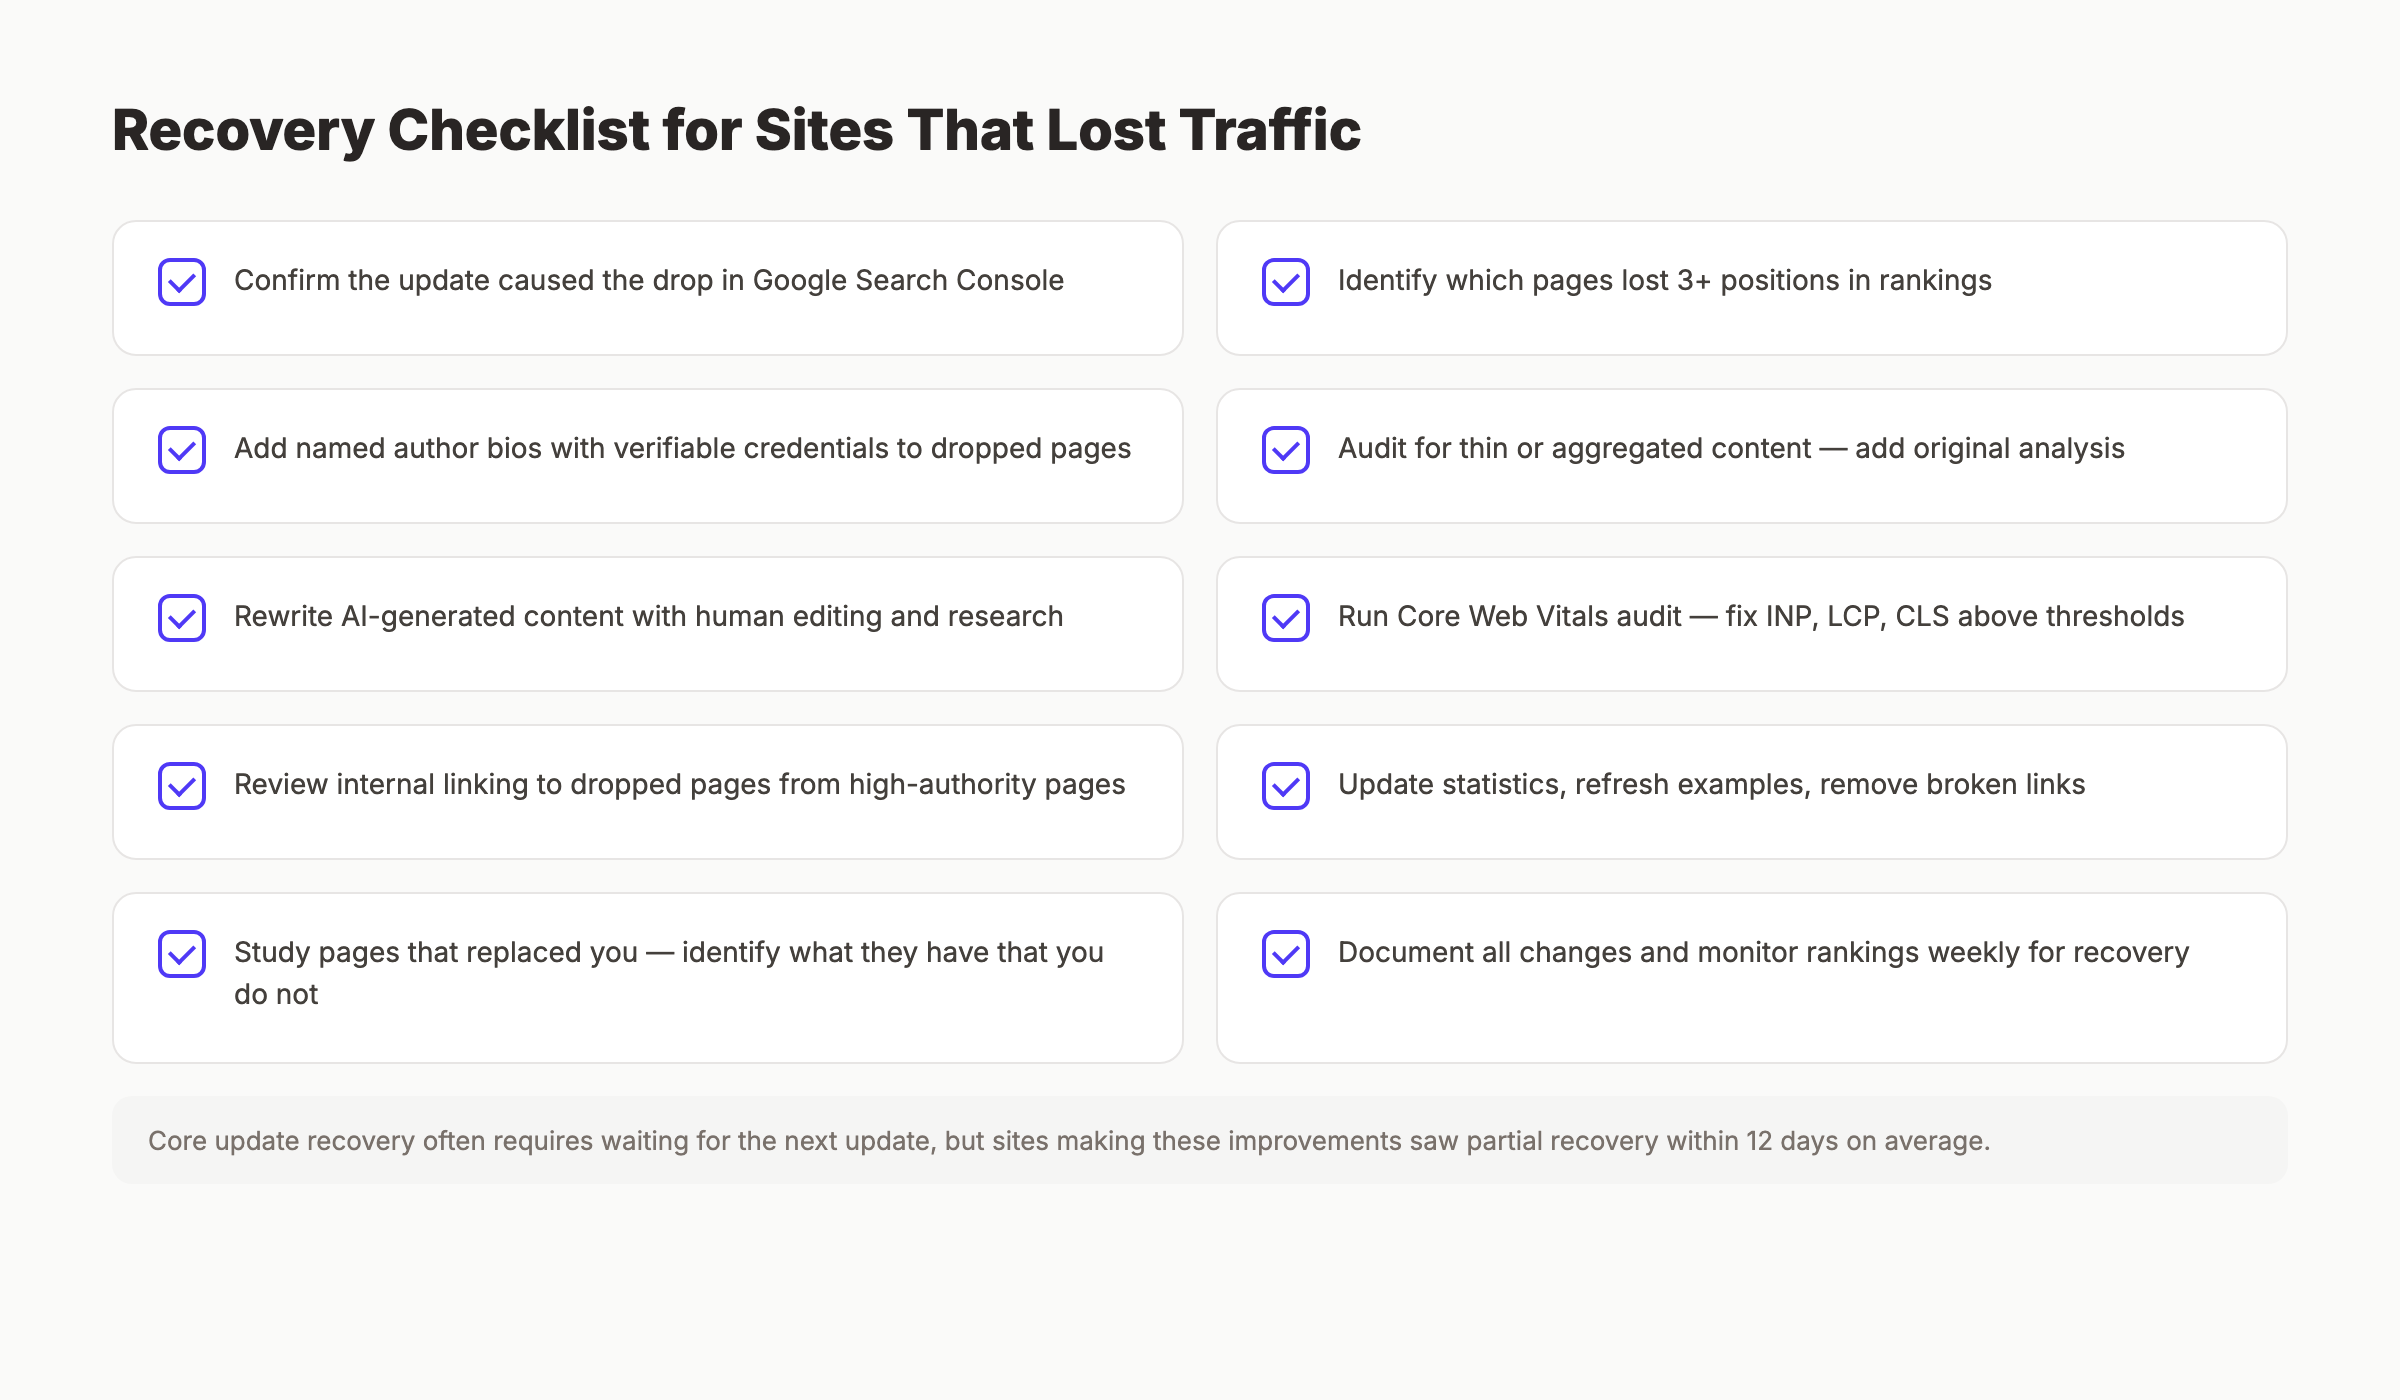
- ✓ Confirm the update caused the drop. Check Google Search Console for traffic changes between March 27 and April 15. Compare to your baseline from the two weeks prior.
- ✓ Identify which pages lost rankings. Export your GSC query data and sort by position change. Focus on pages that dropped 3+ positions.
- ✓ Check author credentials. Do your dropped pages have named authors with relevant expertise? Add author bios with credentials and links to professional profiles.
- ✓ Audit for thin or aggregated content. Does the page primarily summarize other sources? Add original analysis, data, or first-hand observations.
- ✓ Test for AI-generated content. If you used AI writing tools without heavy human editing, rewrite with original research and personal expertise.
- ✓ Run a Core Web Vitals audit. Check INP, LCP, and CLS on your dropped pages. Fix any metric above the "good" threshold.
- ✓ Review internal linking. Ensure your dropped pages receive links from relevant, high-authority pages on your site.
- ✓ Check for outdated content. Update statistics, refresh examples, and remove broken links. Google favors freshness.
- ✓ Compare to winners in your niche. Search your target keywords and study the pages that replaced you. What do they have that you do not?
- ✓ Document everything. Track every change you make and monitor rankings weekly. Core update recovery often requires waiting for the next update, but improvements can show partial recovery sooner.
What practitioners are saying on X
AI search advice ages quickly. Here is high-signal public discussion from SEO and growth operators — context for your roadmap, not a substitute for primary data.
- @hridoyreh (Mar 2026): Widely shared SEO skill tree: foundations, research, technical, on-page, content, links, AI SEO/GEO, analytics, UX, brand, programmatic — useful map for stats and how-to posts. See the post on X.
- @jakezward (Feb 2026): 2026 SEO predictions emphasize AI Overview share-of-SERP, schema for LLM token efficiency, brand mentions in AI answers as a KPI, proprietary data as a moat, and content refresh beating net-new AI slop. See the post on X.
Grok, AI Overviews, and multi-engine visibility
For “google march 2026 core update”, multi-engine visibility still starts with clear definitions, sourced numbers, and extractable section answers. Grok additionally factors live X discussion — keep public claims consistent with this page.
- Google AI Overviews: Use passage-ready answers, tables, and FAQ schema where relevant.
- ChatGPT / Perplexity: Cite named sources next to key claims.
- Grok: Maintain accurate entity facts on-site and in high-signal X posts.
Publish content built for Google and AI citations. theStacc’s Content SEO module ships SEO-scored articles structured for rankings and generative engines — including clearer entity pages models like Grok can quote.
Frequently Asked Questions
The March 2026 core update was a broad recalibration of Google's ranking systems that began March 27 and completed April 8. It reweighted existing signals to favor first-party content creators over aggregators, strengthened E-E-A-T requirements particularly the Experience component, rewarded original research and information gain, and increased the ranking impact of Core Web Vitals especially INP. Fifty-five percent of monitored sites saw measurable ranking changes.
The update rolled out over 12 days and 4 hours, from March 27, 2026, at approximately 2:00 AM PT until April 8, 2026, at 6:12 AM PDT. This was shorter than Google's initial estimate of up to two weeks. Peak volatility occurred between days 3 and 7 of the rollout.
The largest absolute losers by SISTRIX visibility were YouTube (-567 points), Reddit (-64.2), Instagram (-48.1), X (-45.9), TripAdvisor (-44.8), Yelp (-33.1), and Expedia (-32.7). By traffic percentage, LegalZoom (-36.9%), Airbnb (-29.5%), and Coursera (-15.1%) saw the biggest drops. AI content farms lost 60-80% of organic traffic, and 71% of tracked affiliate domains showed negative impact.
The biggest winners were first-party brands and government sites. IMDB gained 79.3 visibility points, Amazon gained 59.8, and Apple gained 28.4. Government sites including NPS.gov (+9.9), NIH.gov (+9.3), and USAJobs.gov (+16.3%) surged. In health, GoodRx gained 54.5%. By traffic, Forbes (+14.3%), Udemy (+9.4%), and Medical News Today (+9.0%) led.
Focus on four areas: add original research or first-hand experience to your content, strengthen author credentials with verifiable expertise, improve Core Web Vitals especially INP, and ensure your content offers information gain over existing top results. Recovery from core updates often requires waiting for the next update, but sites that made these improvements saw partial recovery within 12 days on average.
Google did not announce any specific targeting of AI content. However, sites publishing AI-generated content without human editing, fact-checking, or original research saw significant drops. AI content farms lost 60-80% of traffic. The update targeted low-value content regardless of how it was produced. AI-assisted content with heavy human editing, original research, and expert review performed significantly better.
The first-party correction is the pattern where Google redirected visibility from platforms that host or discuss content toward sites that own or create the content. Aggregators, user-generated content platforms, and comparison sites lost ground while brand-owned domains, government sites, and official sources gained. This appeared across travel, jobs, health, finance, and entertainment verticals.
Conclusion
Google's March 2026 core update was the most volatile in recent memory. It rewarded first-party content creators, punished aggregators and thin affiliates, elevated E-E-A-T signals particularly experience, and made technical performance a sharper differentiator. The data is unambiguous.
The sites that gained share common traits. They create original content. They name their experts. They load fast. They answer questions that existing results do not. The sites that lost share different traits. They summarize. They aggregate. They publish without editorial oversight. They treat search traffic as a right rather than an earned outcome.
The path forward is clear. Audit your content against the four signals outlined in this analysis. Fix what is broken. Build what is missing. And measure everything. The next core update is already in development.
Stay ahead of algorithm changes with Stacc's SEO monitoring tools. Track your rankings, audit your content quality, and get alerts when your pages need attention. Most teams see measurable improvements within 30 days. Start your free site audit
Sources & references
- [1] Princeton / Georgia Tech et al. — GEO research (arXiv:2311.09735)
- [2] @hridoyreh on X — Widely shared SEO skill tree: foundations, research, technical, on-page, content, links, AI SEO/GEO, analytics, UX, bran
- [3] @jakezward on X — 2026 SEO predictions emphasize AI Overview share-of-SERP, schema for LLM token efficiency, brand mentions in AI answers

Researched, written, and published articles that compound organic traffic.