Mobile Search Statistics 2026: 40+ Facts
40+ mobile search statistics for 2026, all sourced and verified. Covers traffic, market share, local search, voice search, and conversions. Updated March 2026.
Siddharth Gangal • 2026-03-30 • SEO Tips
In This Article
Last updated: March 2026
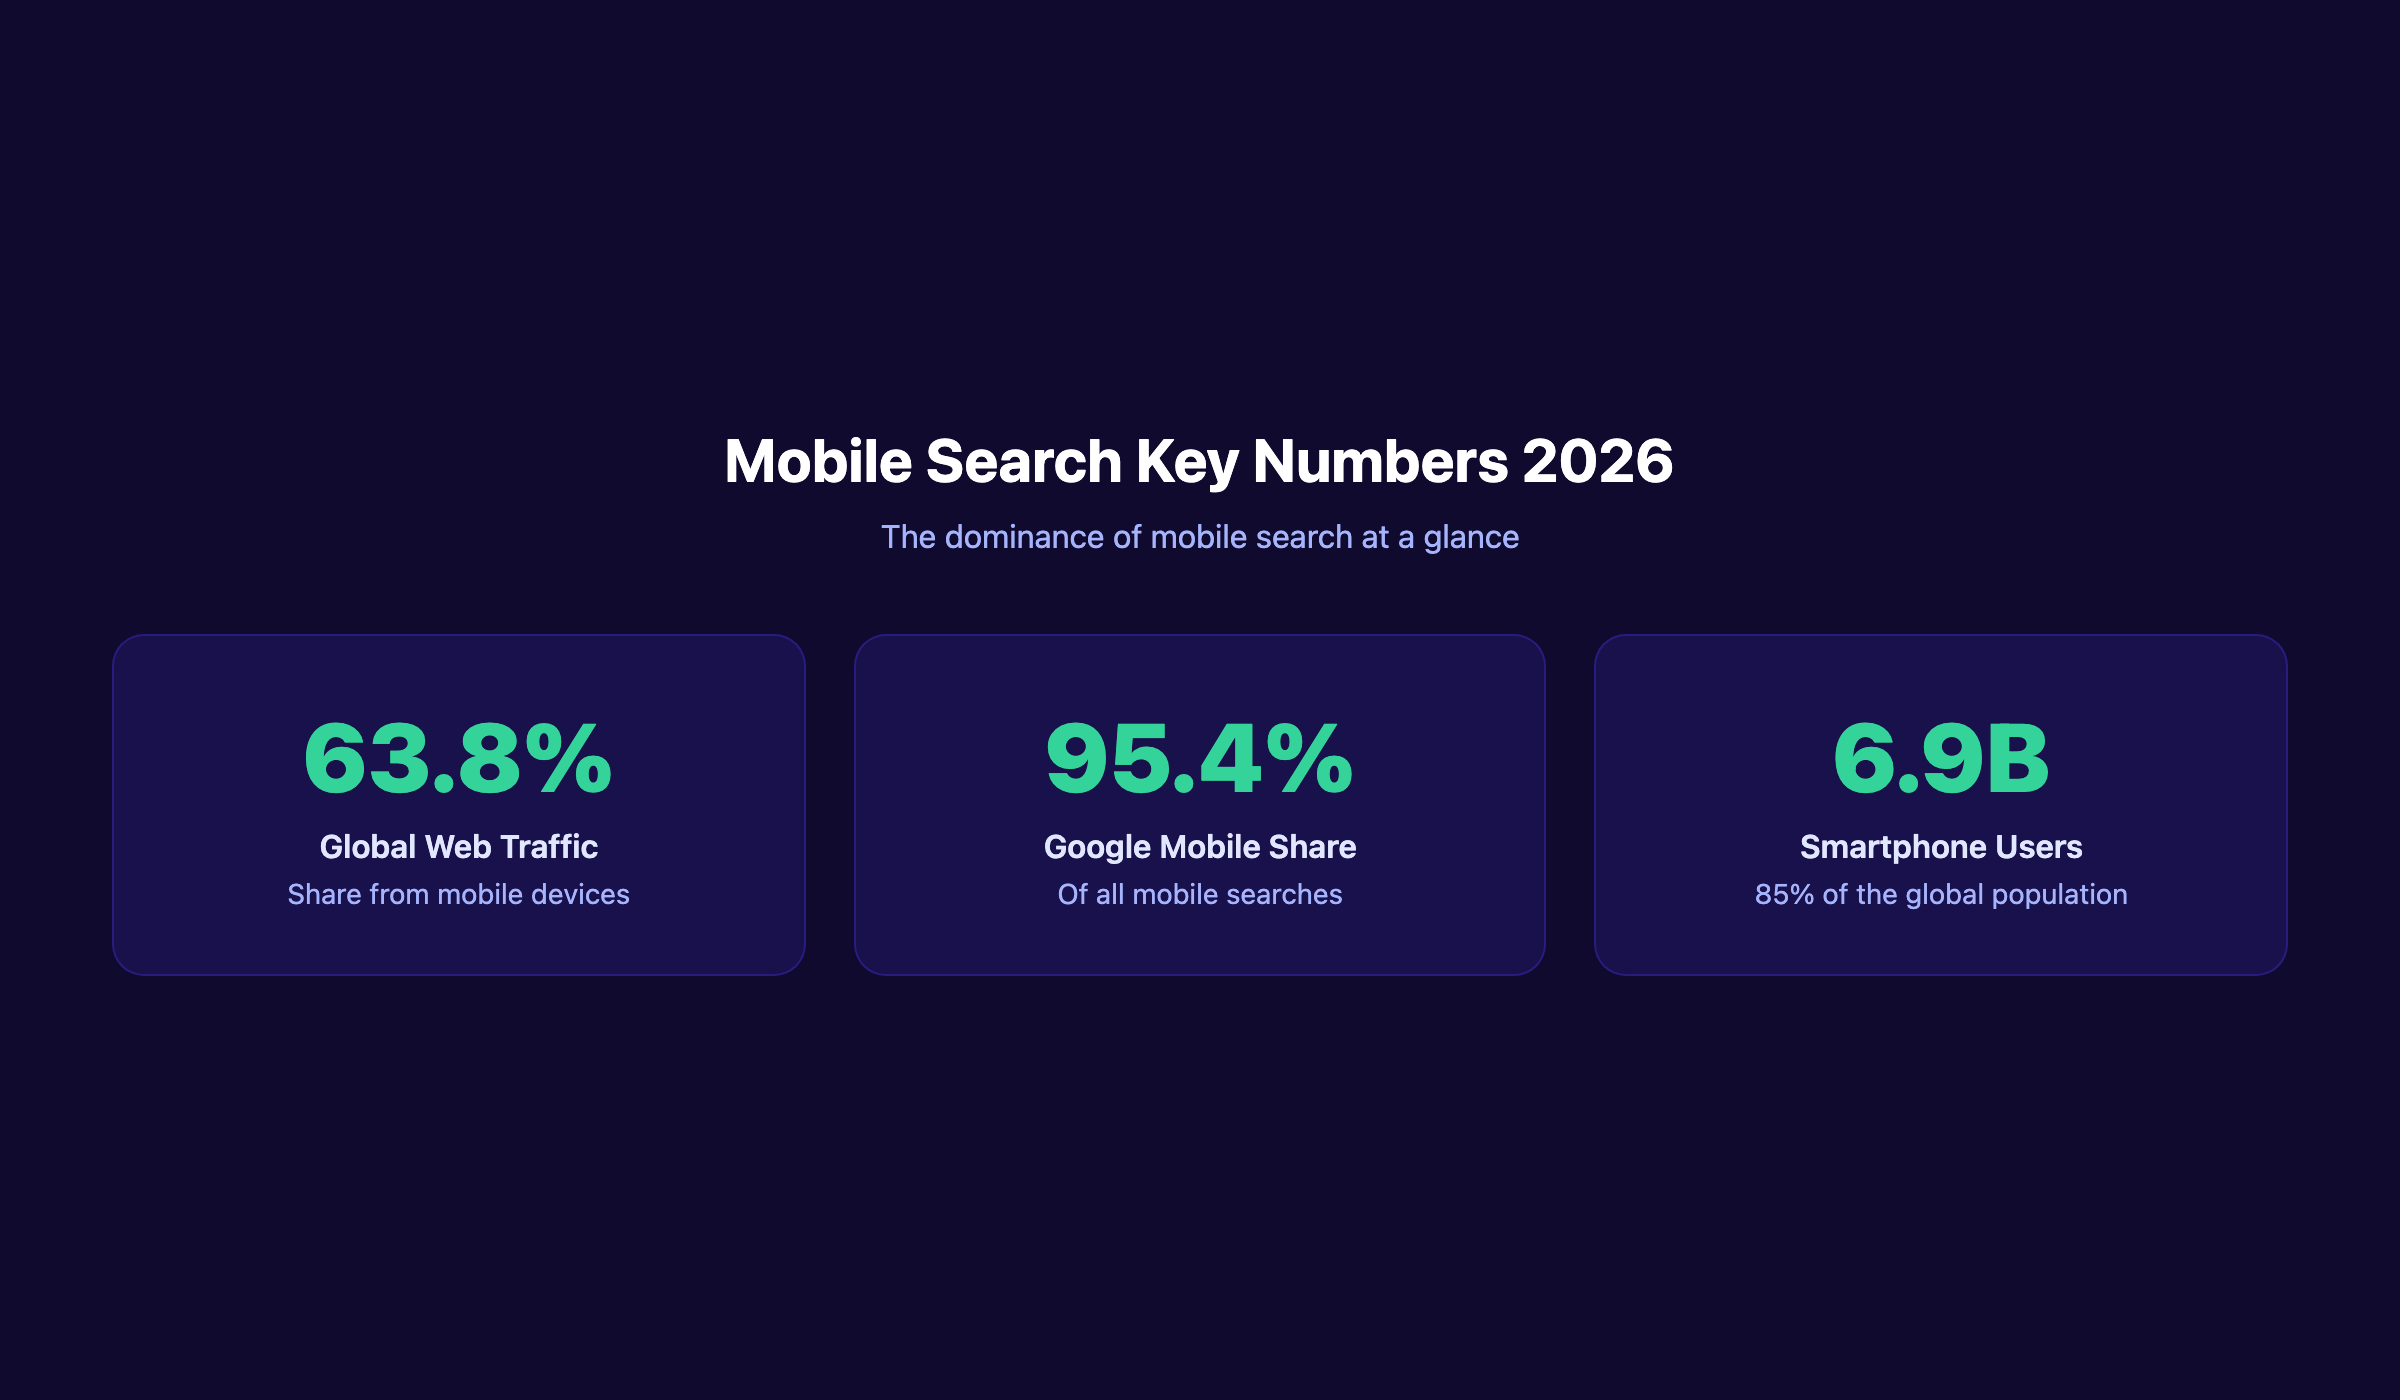
Mobile devices now account for 63.8% of all global web traffic. Desktop holds 38.1%. The shift is not new, but the gap widens every year. If your SEO strategy does not prioritize mobile, you are ignoring where most searches happen.
Businesses that treat mobile search as an afterthought lose traffic, leads, and revenue. The data makes this clear. Mobile users search differently, convert differently, and expect faster experiences than desktop users.
These 40+ mobile search statistics cover every angle. Market share. Traffic splits. Local search behavior. Voice search. Page speed. Mobile commerce. Every stat is sourced, dated, and organized by category.
We publish 3,500+ blogs across 70+ industries. Every content decision we make starts with data like the numbers below. Here is what the research shows about mobile search in 2026.
Mobile Search Market Share Statistics
1. Google controls 95.4% of the global mobile search engine market. Source: StatCounter, 2025
Google dominates mobile even more than desktop. On desktop, Google holds 82.4%. On mobile, competitors barely register.
2. Mobile devices account for 63.8% of all global web traffic. Source: StatCounter, 2025
Nearly two out of every three website visits come from a phone or tablet. Desktop holds 38.1%, and tablets hold 1.9%.
3. 64% of all Google searches happen on mobile devices. Source: TekRevol, 2025
This number has grown steadily from roughly 50% in 2019. Mobile-first indexing is not optional. It is the default.
4. Android handles 72% of mobile web traffic. iOS handles 28%. Source: StatCounter, 2025
Android dominates globally, but iOS users tend to spend more per transaction. Both platforms matter for different reasons.
5. 92% of global internet users access the web via mobile at least once per month. Source: DataReportal, 2025
Only 8% of internet users never touch a mobile device for browsing. Mobile reach is nearly universal.
6. 6.9 billion people own smartphones worldwide. That is 85% of the global population. Source: GSMA Intelligence, 2025
The smartphone user base has plateaued in developed markets but continues to grow across Asia, Africa, and South America.
7. Mobile ads represent 72% of global digital ad spend, exceeding $450 billion in 2025. Source: HubSpot, 2025
Advertisers follow the traffic. When nearly two-thirds of searches are mobile, ad budgets shift to match.
You can see how these numbers connect to broader SEO statistics that shape strategy across every channel.
Mobile vs Desktop Usage Statistics
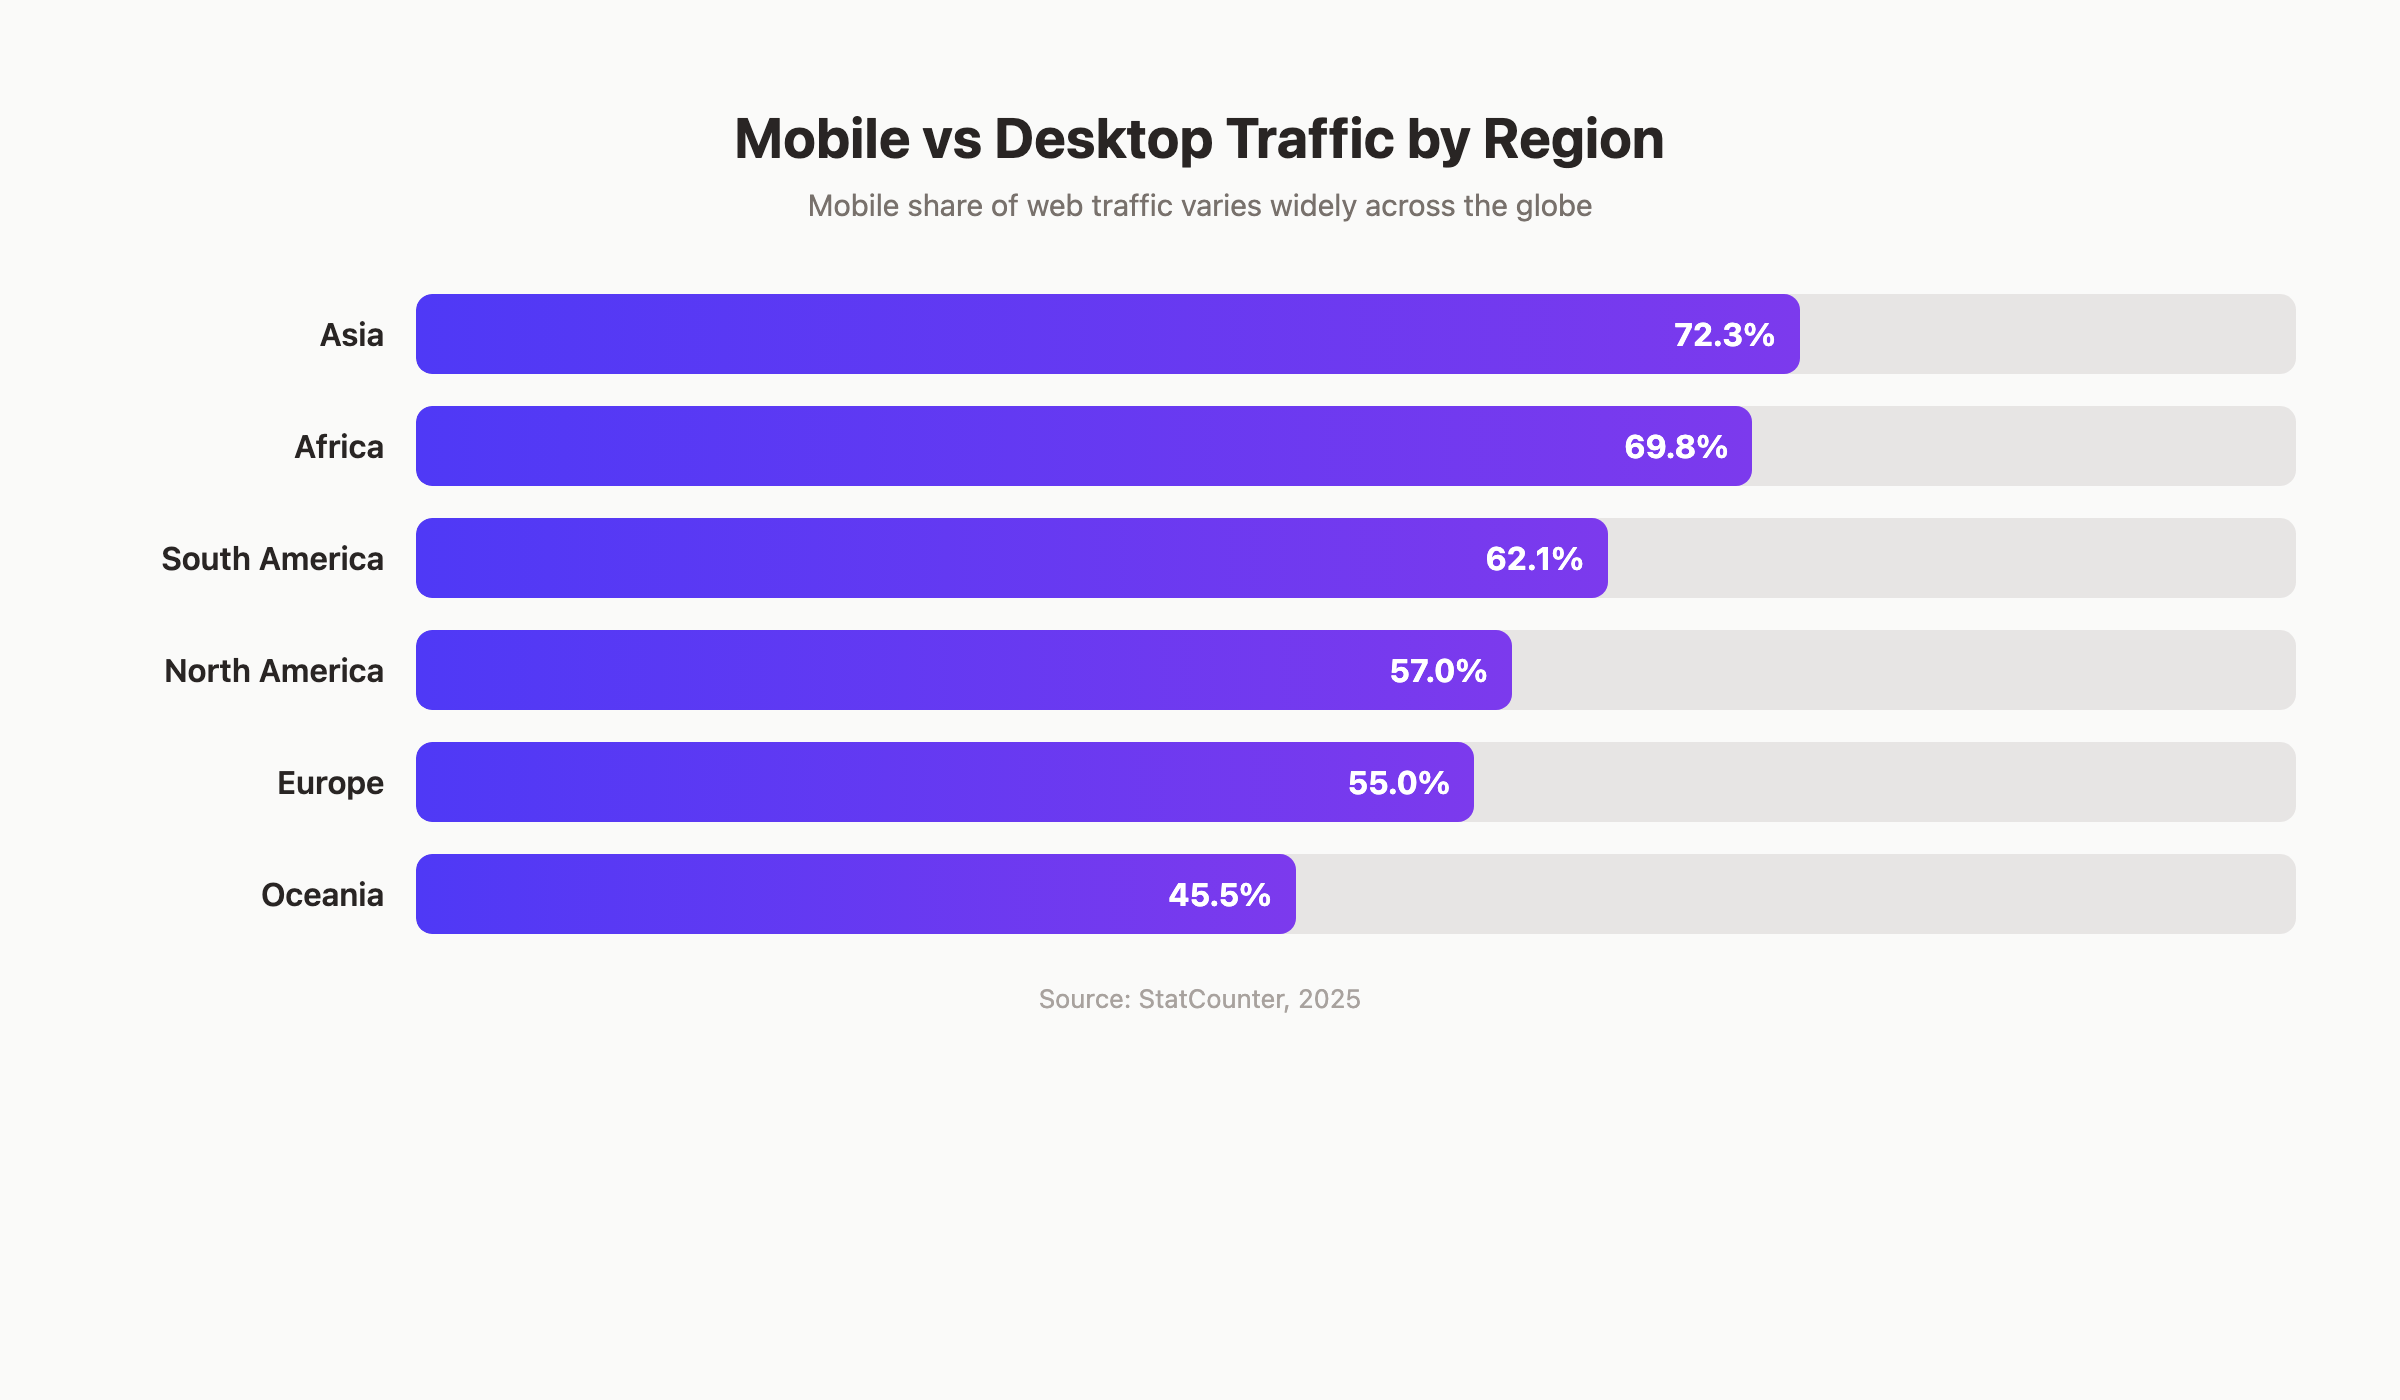
8. Asia leads with 72.3% mobile traffic share. Oceania trails at 45.5%. Source: StatCounter, 2025
Regional differences are significant. In Africa, mobile accounts for 69.8%. Europe sits at 55%. North America is at 57%.
| Region | Mobile Traffic Share | Desktop Traffic Share |
|---|---|---|
| Asia | 72.3% | 27.7% |
| Africa | 69.8% | 30.2% |
| South America | 62.1% | 37.9% |
| North America | 57.0% | 43.0% |
| Europe | 55.0% | 45.0% |
| Oceania | 45.5% | 54.5% |
Source: StatCounter, 2025
9. Mobile users spend an average of 4.8 hours per day on their smartphones. Source: DataReportal, 2025
That is more than one-third of waking hours. Search, social media, and messaging dominate that time.
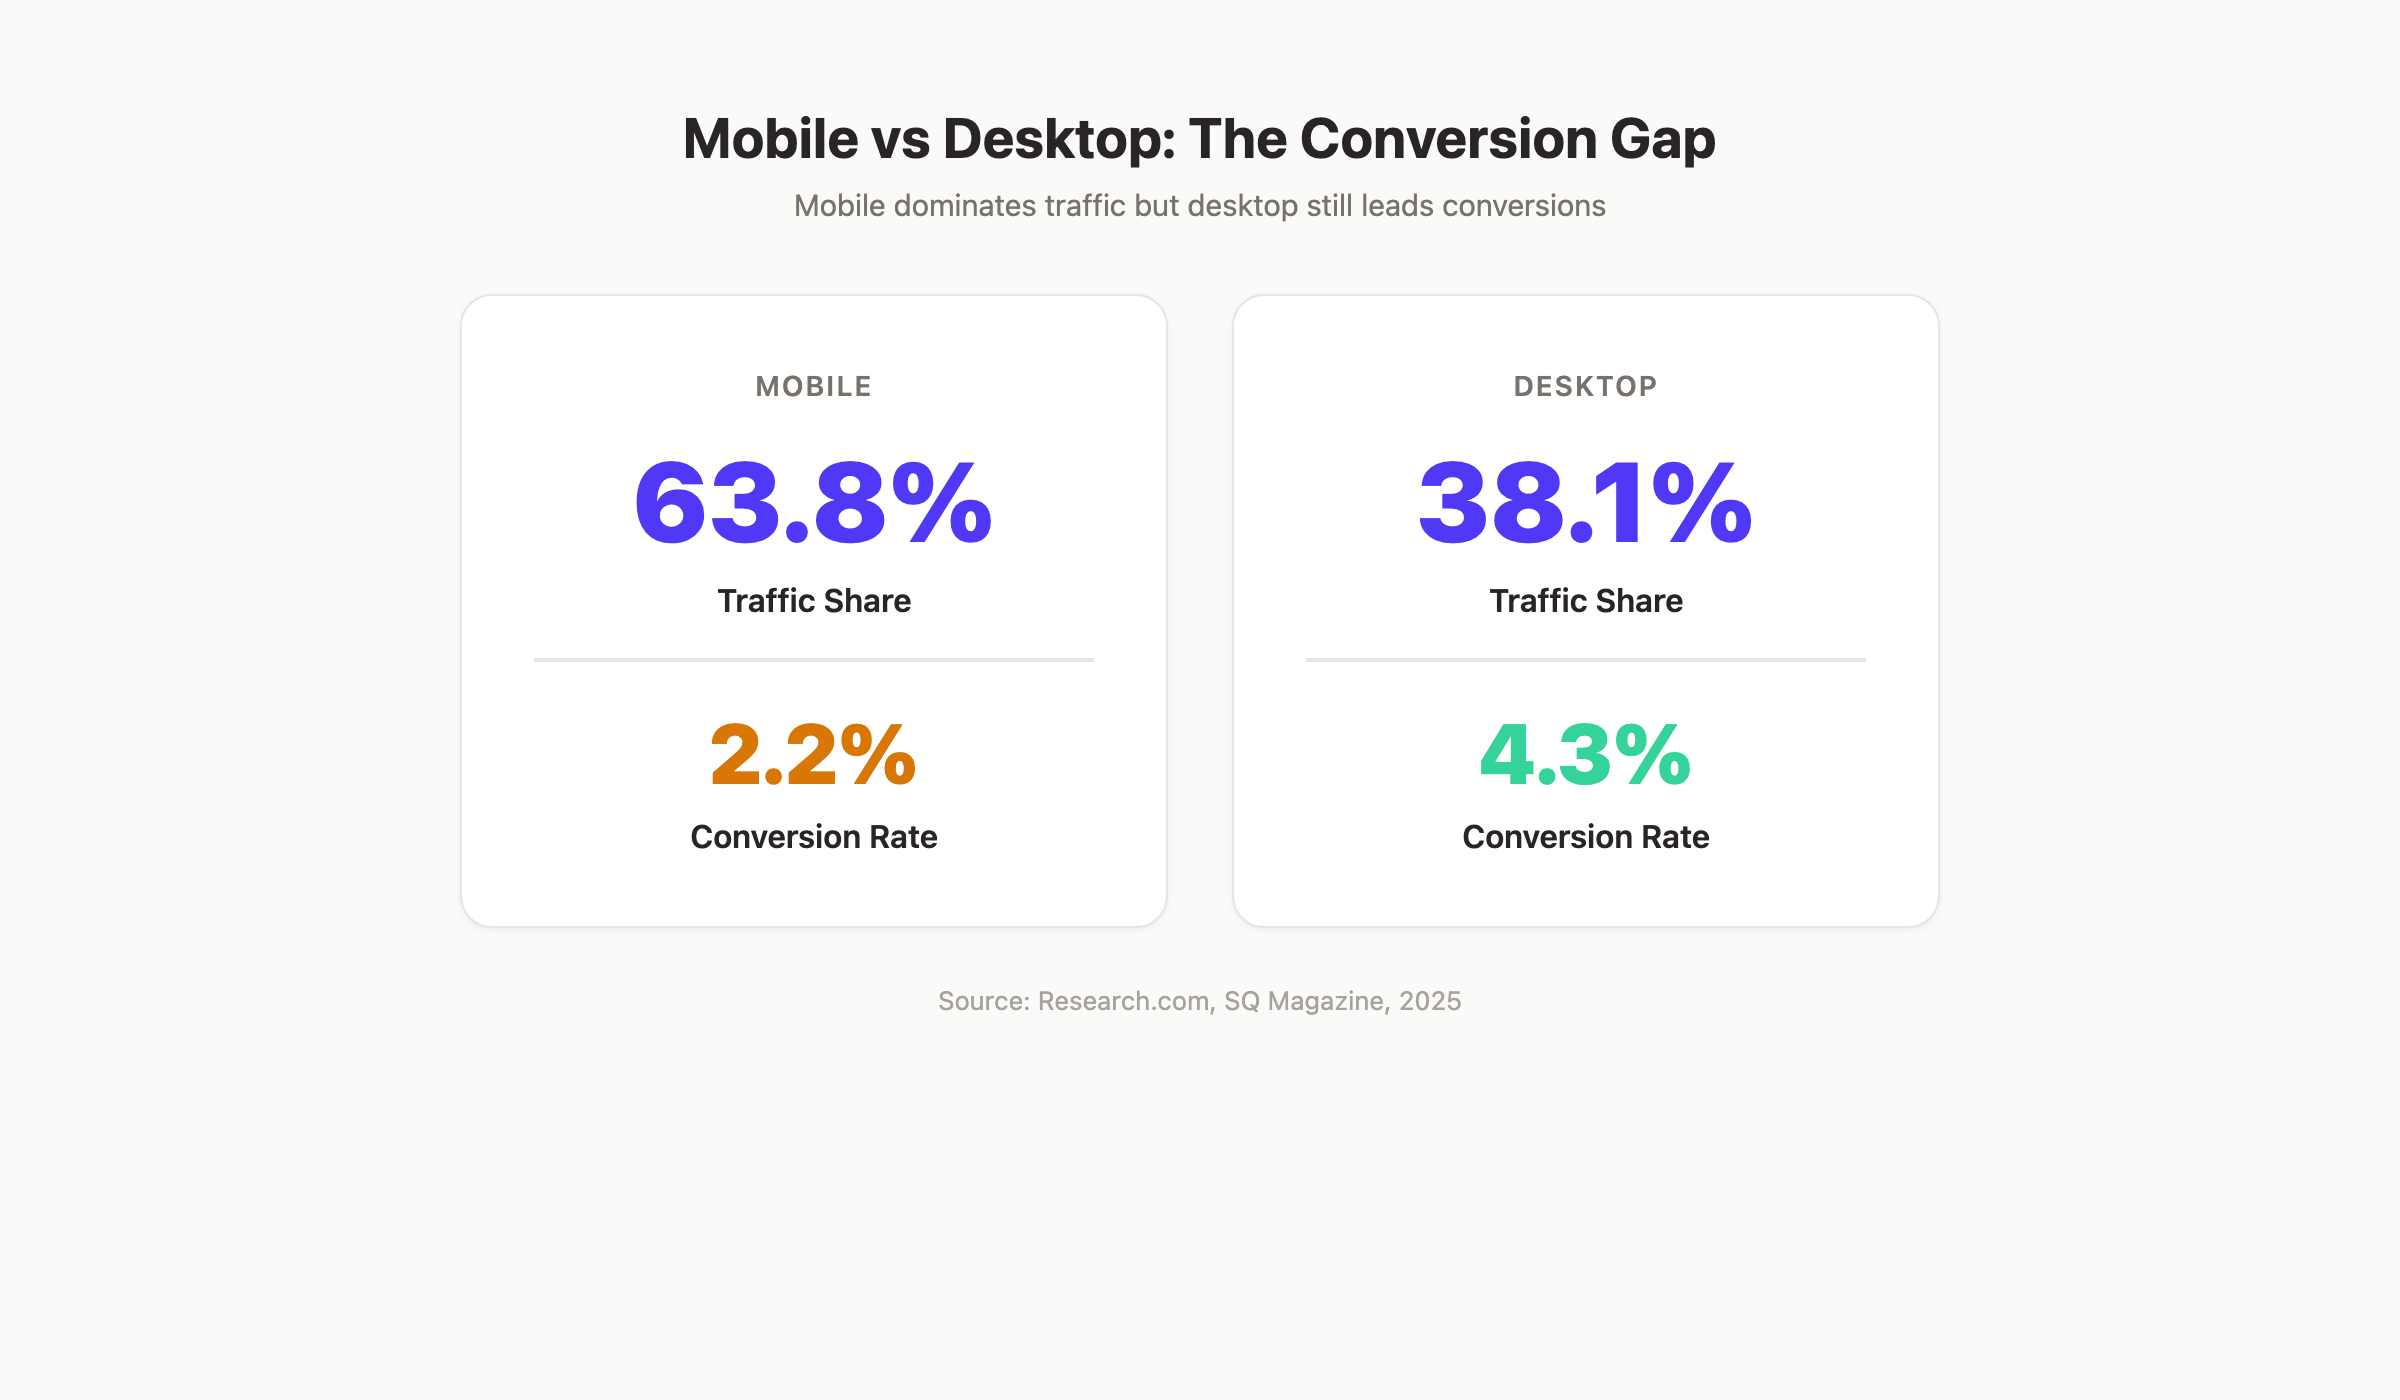
10. Desktop still drives higher conversion rates at 4.3% vs 2.2% on mobile. Source: SQ Magazine, 2025
Mobile wins on volume. Desktop wins on conversion. Smart marketers optimize for both.
11. By end of 2026, mobile will account for nearly 70% of global search traffic. Source: Research.com, 2026
The upward trend shows no signs of reversal. Desktop usage declines roughly 7% year over year.
12. Desktop accounts for over 45% of high-value B2B conversions despite lower traffic share. Source: Research.com, 2026
B2B buyers often research on mobile but complete purchases or form fills on desktop. This cross-device pattern matters for content marketing strategy.
Mobile Search Behavior Statistics
13. 70% of mobile searches lead to action within 1 hour. Source: Search Engine Journal, 2024
Mobile searchers act fast. They are not browsing casually. They want answers and they want them now.
14. 82% of mobile web traffic is video content. Source: Cisco, 2025
Video dominates mobile bandwidth. Pages with embedded video hold mobile users longer and reduce bounce rates.
15. More than 80% of all searches end without a click (zero-click searches). Source: Click Vision, 2026
AI Overviews and featured snippets answer queries directly in the search results. Searches with AI Overviews show an 83% zero-click rate on mobile.
16. AI Overviews appear in 21.59% of US mobile search queries. Source: AllOutSEO, 2026
That is up from 8.61% in 2024. Mobile users see AI-generated answers more frequently than desktop users. Getting cited in AI search results is now a ranking strategy.
17. Google Lens processes over 20 billion visual searches per month. Source: AffMaven, 2026
Visual search is a mobile-native behavior. Users point their cameras at products, landmarks, and text. This changes how product and image SEO works.
18. E-commerce sites see 71.8% of traffic from mobile devices. Source: Contentsquare, 2024
E-commerce is the most mobile-heavy industry. Media and publishing follow at 66.2%.
Your SEO score determines where mobile searchers find you. We publish SEO content that ranks across every device and platform. Start for $1 →
Mobile Local Search Statistics
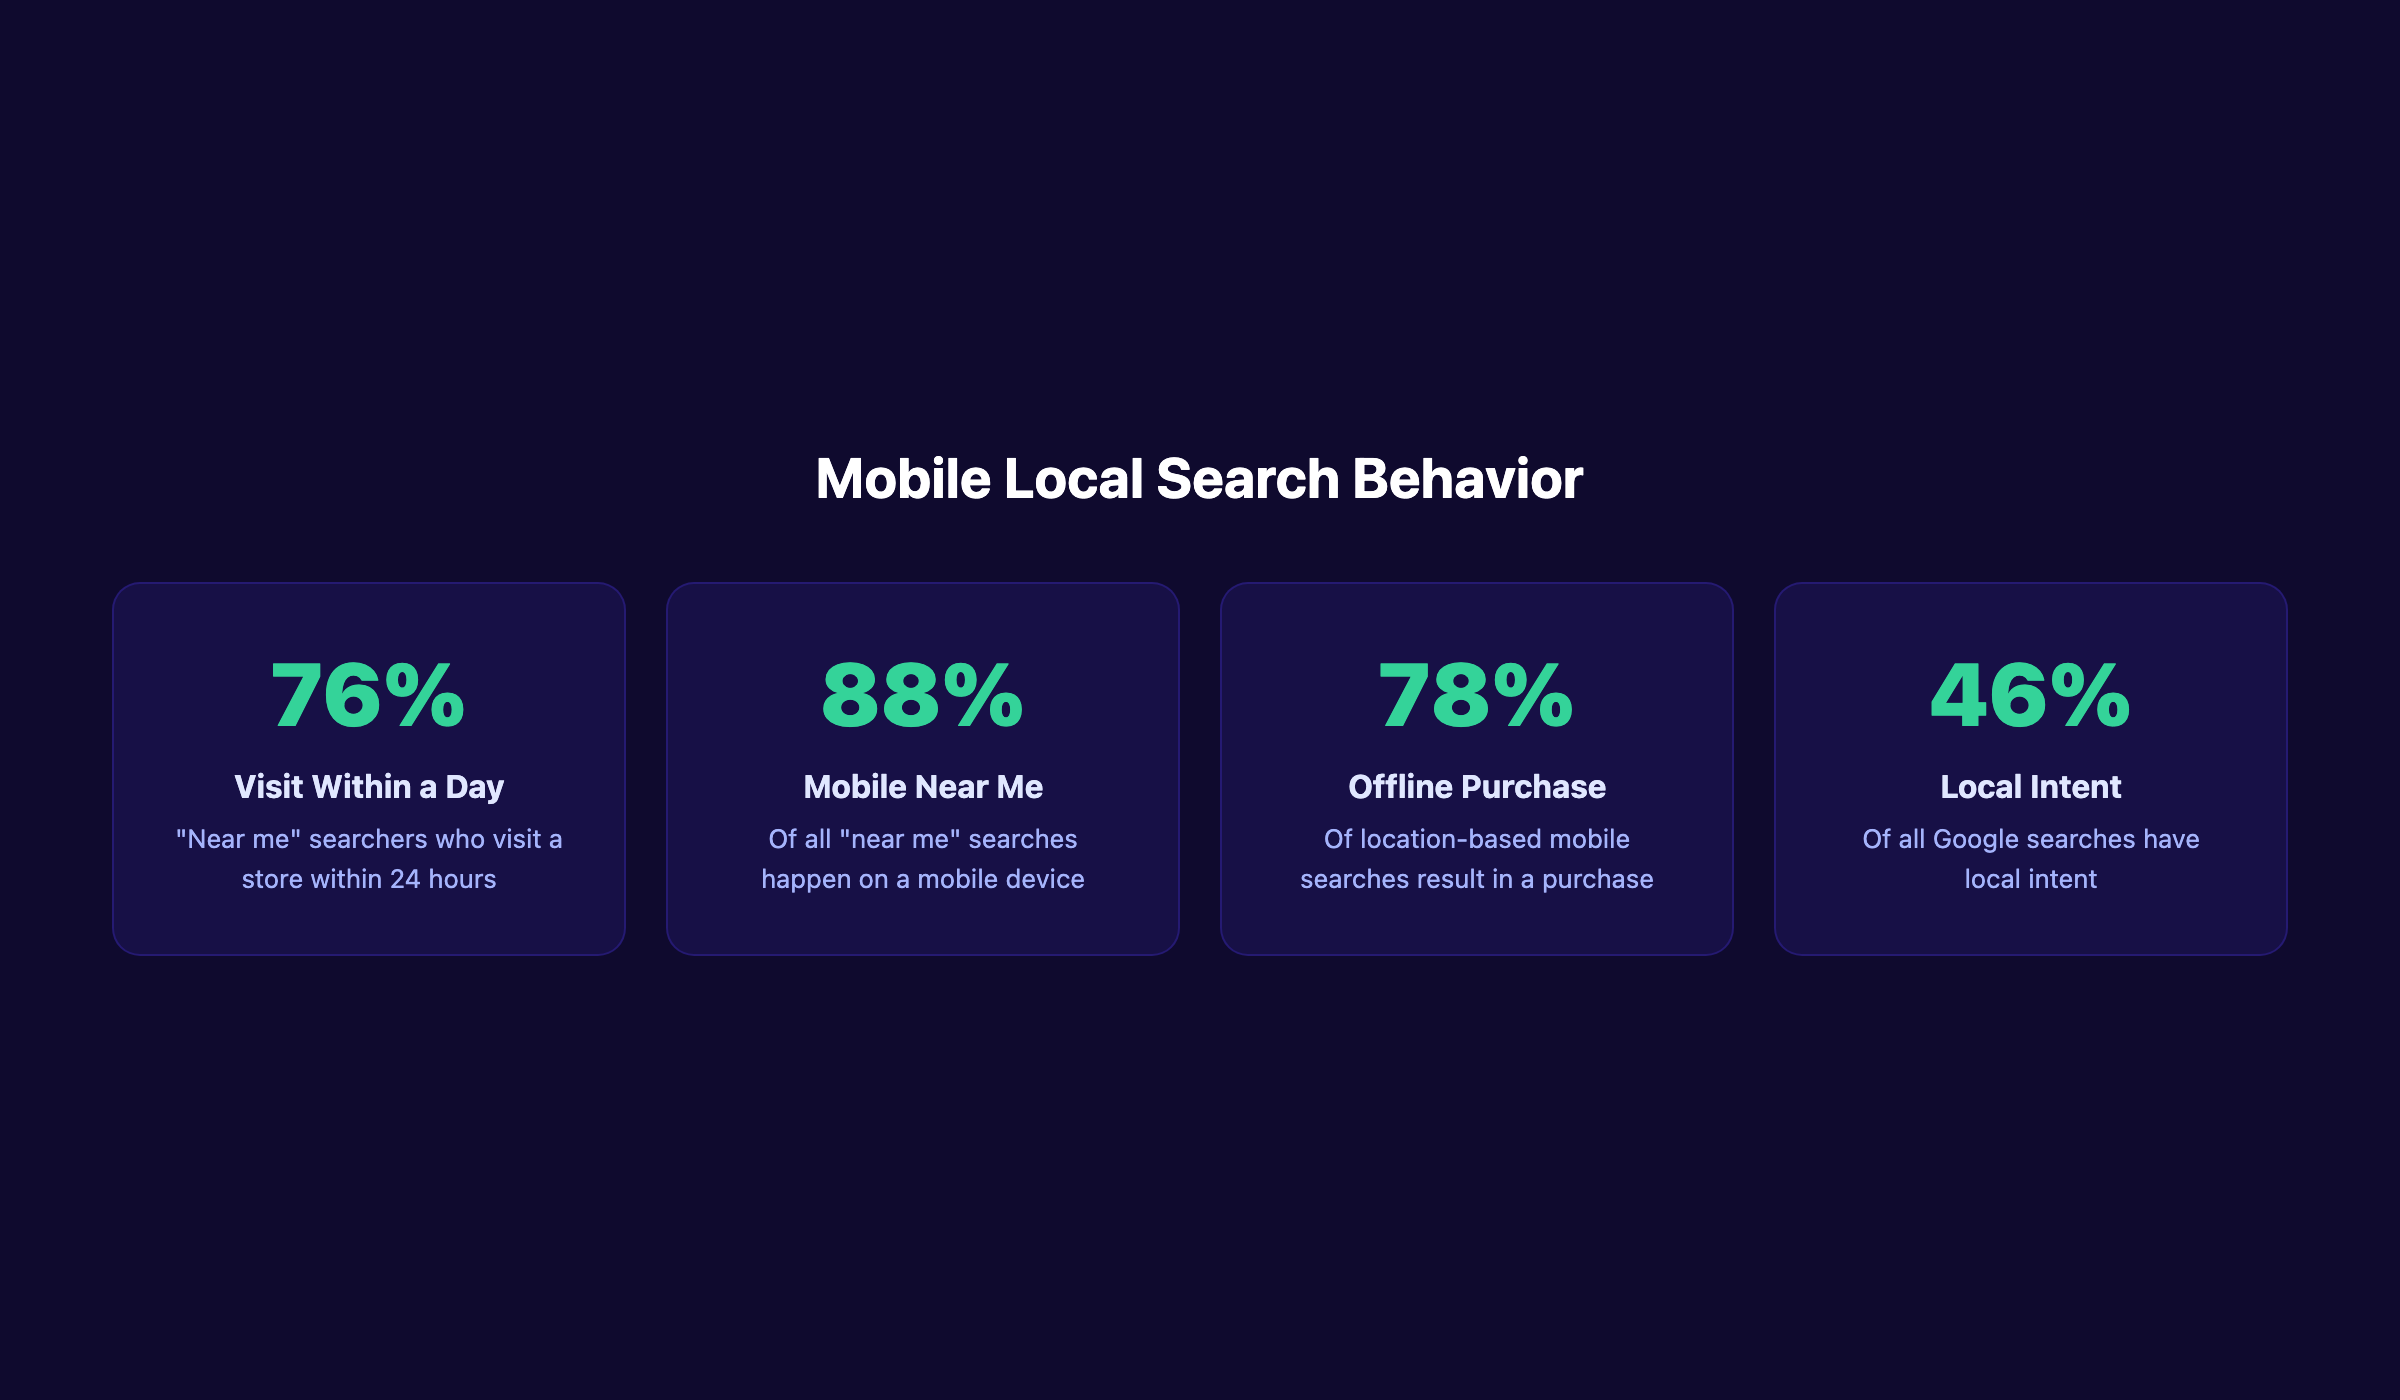
19. 46% of all Google searches have local intent. Source: Backlinko, 2024
Nearly half of every search query is someone looking for a nearby business, service, or product. Local SEO is not niche. It is mainstream. See our full local SEO statistics roundup for more.
20. 88% of “near me” searches happen on mobile devices. Source: SoCI, 2024
This makes mobile optimization a requirement for any business with a physical location. Desktop “near me” searches are rare by comparison.
21. 76% of people who search “near me” on mobile visit a store within 24 hours. Source: Think with Google, 2024
The intent behind mobile local searches is extremely high. These are not window shoppers. They are buyers.
22. 78% of location-based mobile searches result in an offline purchase. Source: Search Engine Journal, 2024
Mobile local search bridges the gap between online and offline. An optimized Google Business Profile captures this traffic.
23. “Near me” keyword variations generate 800 million searches per month in the US alone. Source: SeoProfy, 2024
There are 5.9 million keywords related to “near me” in the US. That is an enormous pool of high-intent traffic.
24. “Open now near me” searches are up 400% year over year. Source: The Media Captain, 2024
Consumers add time-based modifiers to location queries. They do not just want nearby. They want nearby and open right now.
25. 82% of smartphone shoppers conduct “near me” searches. Source: Synup, 2024
This is not a niche behavior. It is how the majority of smartphone owners find businesses. Our local SEO guide covers optimization tactics in full.
Mobile Page Speed and UX Statistics
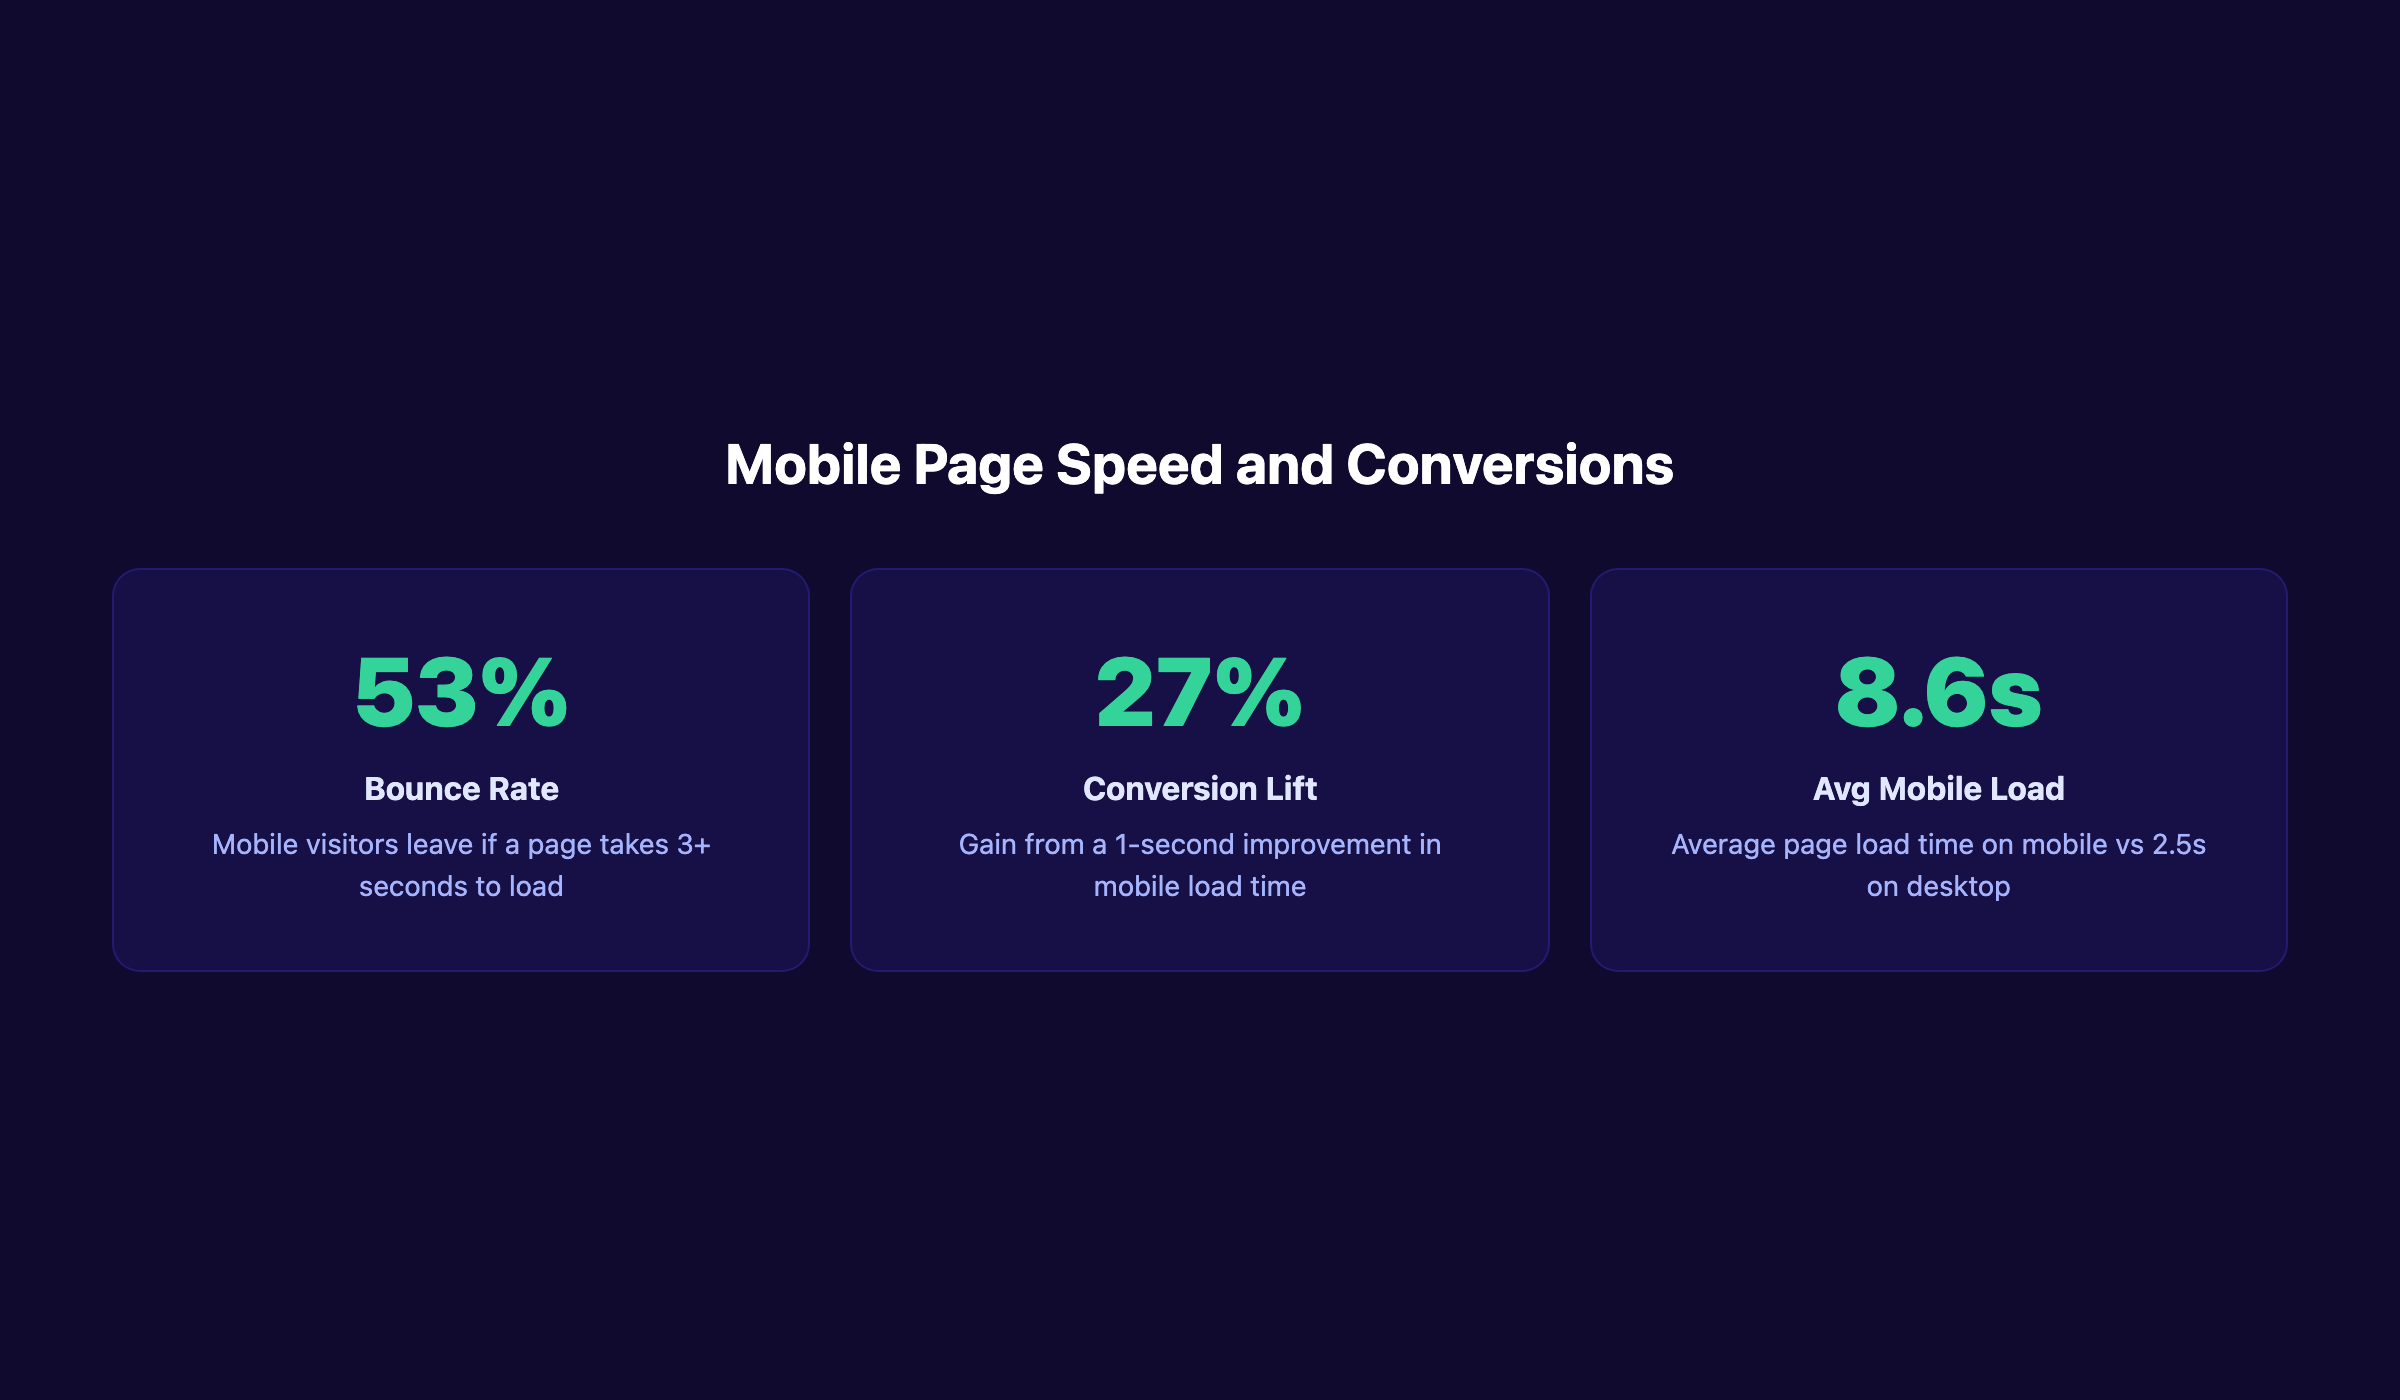
26. 53% of mobile visitors leave a page that takes more than 3 seconds to load. Source: Google/SOASTA, 2024
Three seconds is the threshold. Every second beyond that compounds the abandonment rate.
27. The average mobile page loads in 8.6 seconds. Desktop loads in 2.5 seconds. Source: Huckabuy, 2024
Mobile pages load 70.9% slower than desktop. This gap explains the mobile conversion disadvantage.
28. A 1-second improvement in mobile page speed can increase conversions by 27%. Source: Cloudflare, 2024
Speed optimization delivers measurable ROI. Even a 0.1-second improvement boosts conversions by 8.4%. Our guide on improving Core Web Vitals covers the technical side.
29. 70% of consumers say page speed affects their willingness to buy online. Source: WebFX, 2025
Speed is not just a technical SEO metric. It is a purchasing decision factor.
30. For every 1-second delay in mobile page load, conversions drop by up to 20%. Source: Conductor, 2024
The relationship between speed and revenue is linear. Slower pages mean fewer sales. Period.
| Load Time | Bounce Rate Impact | Conversion Impact |
|---|---|---|
| 1-3 seconds | Baseline | Baseline |
| 3-5 seconds | +32% bounce rate | -15% conversions |
| 5-7 seconds | +90% bounce rate | -30% conversions |
| 7-10 seconds | +123% bounce rate | -50% conversions |
Source: Google/SOASTA, 2024
Mobile Voice Search Statistics
31. 27% of the global online population uses voice search on mobile. Source: DemandSage, 2025
Voice search is not a gimmick. Over a quarter of internet users use it. And it is growing.
32. Smartphones account for 56% of all voice search device usage. Source: DemandSage, 2025
Phones are the primary voice search device, ahead of smart speakers and other connected devices.
33. 71% of consumers prefer voice search over typing when possible. Source: Synup, 2025
Typing on a small screen is slow. Voice search eliminates that friction. This preference drives growth.
34. 76% of voice searches are local or “near me” queries. Source: Synup, 2025
Voice search and local SEO are deeply connected. “Hey Google, find a plumber near me” is a common query pattern.
35. 32% of consumers use voice daily for searches they would normally type. Source: Digital Silk, 2025
Daily voice search usage means this is a habitual behavior, not an occasional novelty.
36. There are 8.4 billion voice-enabled devices in use worldwide. Source: Yaguara, 2026
That is more devices than people on Earth. Voice search infrastructure is everywhere.
Local businesses that rank for voice queries capture high-intent traffic. We publish content and GBP posts that put your business in front of mobile searchers. Start for $1 →
Mobile Commerce Statistics
37. Mobile commerce accounts for 59% of all retail e-commerce sales globally. Source: DemandSage, 2025
More than half of all online shopping happens on phones. That number rises to 63% by 2028.
38. The global mobile commerce market is valued at $2.24 trillion in 2025. Source: Fortune Business Insights, 2025
Projected to hit $5 trillion by 2034, growing at a 9.5% compound annual rate.
39. 1.65 billion people worldwide shop on mobile devices. Source: Invesp, 2025
30% of the global digital population makes purchases on their phones.
40. Mobile wallets process 54% of all global online transactions. Source: The Droids on Roids, 2025
Apple Pay, Google Pay, and similar wallets have overtaken credit cards for mobile checkout.
41. 70% of mobile e-commerce purchases happen in apps, not browsers. Source: OyeLabs, 2026
App experiences convert better than mobile web. Businesses with apps see higher mobile conversion rates.
42. Asia Pacific leads mobile commerce with $954.65 billion in annual revenue. Source: Fortune Business Insights, 2025
The region grows at 11.4% annually. Mobile-first payment systems like Alipay and WeChat Pay drive this dominance.
Mobile SEO Statistics
43. Google uses mobile-first indexing for all websites. Source: Google Search Central, 2024
Since July 2024, Google crawls and indexes the mobile version of every site first. If your mobile experience is poor, your rankings suffer across all devices.
44. Pages in the top 5 Google results score an average of 70+ on mobile page speed tests. Source: Ahrefs, 2024
Speed and rankings correlate. Slow mobile pages rarely rank well. An on-page SEO audit should always include mobile speed.
45. Mobile-friendly sites receive a ranking boost in mobile search results. Source: Google Search Central, 2024
Google has used mobile-friendliness as a ranking signal since 2015. Responsive design is the baseline.
46. 61% of users will not return to a mobile site they had trouble accessing. Source: Google/Think with Google, 2024
First impressions on mobile are permanent. A bad experience costs you that visitor forever. Good blog SEO structure helps retain mobile readers.
Key Takeaways
- 63.8% of all web traffic is mobile. Desktop is the minority platform. Optimize for mobile first.
- 95.4% of mobile searches go through Google. Mobile search engine optimization is Google optimization.
- 76% of “near me” searchers visit a store within 24 hours. Mobile local search drives offline revenue.
- 53% of visitors leave if a page takes over 3 seconds. Mobile speed is a conversion multiplier.
- 27% of users search by voice on mobile. Voice search favors featured snippets and local results.
- Mobile commerce exceeds $2.24 trillion annually. More than half of online shopping is mobile.
- AI Overviews appear on 21.59% of mobile queries. Zero-click behavior is accelerating.
Methodology
Sources: StatCounter, Google/Think with Google, DemandSage, DataReportal, GSMA Intelligence, Fortune Business Insights, Contentsquare, Cisco, Ahrefs, HubSpot, Search Engine Journal, Backlinko, Cloudflare, WebFX
Last updated: March 2026
Note: We update this page quarterly to ensure all statistics remain current. If a stat has changed since original publication, we note the date it was updated.
Turn these numbers into rankings. We publish SEO content and GBP posts that put your business in front of mobile searchers across every platform. Start for $1 →
Frequently Asked Questions
What percentage of searches are mobile in 2026?
Roughly 64% of all Google searches happen on mobile devices. When factoring in all global web traffic, mobile accounts for 63.8%. That number is projected to reach 70% by end of 2026.
How does mobile search affect local businesses?
Mobile search is the primary driver of local business discovery. 88% of “near me” searches happen on mobile. 76% of those searchers visit a physical store within 24 hours. Businesses without mobile-optimized sites and Google Business Profiles miss this traffic entirely.
What is the average mobile page load time?
The average mobile page takes 8.6 seconds to load, compared to 2.5 seconds on desktop. Pages that load in under 3 seconds retain significantly more visitors. Speed improvements of just 1 second can increase conversions by 27%.
How many people use voice search on mobile?
27% of global internet users use voice search on mobile. Smartphones account for 56% of all voice search activity. The number of voice-enabled devices worldwide exceeds 8.4 billion.
What is mobile commerce market share?
Mobile commerce accounts for 59% of all retail e-commerce sales in 2025. The market is valued at $2.24 trillion and projected to grow to $5 trillion by 2034. Asia Pacific leads with the highest regional revenue.
How often are these mobile search statistics updated?
We update this page quarterly. Last updated: March 2026. All statistics include source citations and year of publication.
Written and published by Stacc. We publish 3,500+ articles per month across 70+ industries. All data verified against public sources as of March 2026.
