Marketing Mix Modeling with AI: The Complete Guide (2026)
Learn how AI transforms marketing mix modeling for faster, cheaper budget optimization. 9 chapters covering MMM tools, data inputs, and ROI. Updated 2026.
Siddharth Gangal • 2026-04-02 • SEO Tips
In This Article
Most marketing teams cannot answer one simple question: which channels actually drive revenue? They spend $10,000 per month across 6 platforms and guess which ones work. Marketing mix modeling with AI solves that problem, and it no longer requires a $200,000 consulting engagement to get started.
The shift is real. 46.9% of US marketers plan to increase their MMM investment over the next 12 months. Privacy regulations killed cookie-based tracking. AI made the alternative faster and cheaper.
In this guide, you will learn:
- What marketing mix modeling is and how it works (no statistics degree required)
- How AI reduced MMM timelines from 6 months to 2 weeks
- The exact data inputs your model needs to produce useful results
- Why ignoring SEO in your marketing mix model wastes budget
- Which free and paid MMM tools exist right now
- How to read MMM outputs and actually reallocate spend based on them
We publish 3,500+ blog posts across 70+ industries. We see firsthand how organic content compounds alongside paid channels. This guide covers everything we know about marketing mix modeling and where AI fits.
Table of Contents
- Chapter 1: What Is Marketing Mix Modeling?
- Chapter 2: How Traditional MMM Worked
- Chapter 3: How AI Transforms Marketing Mix Modeling
- Chapter 4: AI and ML Techniques Behind Modern MMM
- Chapter 5: What Data Inputs AI-Driven MMM Requires
- Chapter 6: Why Most Marketing Mix Models Ignore SEO
- Chapter 7: Popular AI-Powered MMM Tools and Platforms
- Chapter 8: How to Read and Act on MMM Outputs
- Chapter 9: How to Start with MMM Without a Data Science Team
- Frequently Asked Questions
Chapter 1: What Is Marketing Mix Modeling? {#ch1}
Marketing mix modeling measures how each marketing channel contributes to revenue. It answers the question every CMO asks: “Where should I spend the next dollar?”
The concept is not new. Economists and CPG companies used MMM since the 1960s. But the method stayed locked behind expensive consultancies and months-long timelines until recently.
The Core Idea in One Sentence
MMM uses statistical analysis on historical data to isolate the revenue impact of each marketing channel. It separates what happened because of your ads from what happened because of seasonality, economic trends, or competitor moves.
Think of your total sales as a pie. MMM slices that pie into pieces. One slice belongs to TV ads. Another to paid search. Another to organic traffic. Another to pricing changes. Another to factors outside your control, like weather or holidays.
The model does not track individual users. It works with aggregate data. Spend $50,000 on Facebook ads in March, and revenue went up $120,000? MMM determines how much of that $120,000 actually came from Facebook versus everything else happening at the same time.
Base Sales vs. Incremental Sales
MMM divides revenue into 2 categories.
Base sales happen without any marketing. They come from brand awareness, repeat customers, word of mouth, and organic demand. For established businesses, base sales often account for 40-60% of total revenue.
Incremental sales result directly from marketing activity. Every dollar you spend on ads, content, events, or sponsorships generates some portion of incremental revenue. MMM quantifies that portion per channel.
This distinction matters because many marketing teams take credit for base sales. A Facebook campaign runs during the holiday season, revenue spikes, and the team claims success. MMM strips away the seasonal bump and shows what Facebook actually added.
Why MMM Matters More in 2026
Three forces made MMM essential this year.
First, 53.5% of US marketers use MMM to handle privacy limitations. Cookie deprecation broke multi-touch attribution. MMM does not need cookies, pixels, or user-level tracking.
Second, marketing budgets face pressure. Research shows 20-30% of marketing budgets are misallocated in 2026. That waste grows when you rely on platform-reported metrics instead of independent measurement.
Third, channel complexity exploded. The average B2B company now uses 8-12 marketing channels. Without a model that measures all of them together, you optimize each channel in isolation and miss the interactions between them.
Chapter 2: How Traditional MMM Worked (And Why It Was Painful) {#ch2}
Traditional marketing mix modeling followed a predictable and slow pattern. A brand hired a consulting firm. The firm spent 3-6 months collecting data, building regression models, and delivering a PowerPoint deck. By the time results arrived, the market had changed.
The Old-School Process
The typical traditional MMM engagement looked like this:
- Data collection — 4-8 weeks gathering spend data, sales figures, pricing history, and external factors from every department
- Model building — 6-12 weeks of econometricians running multivariate regression models and testing dozens of variable combinations
- Validation — 2-4 weeks checking model accuracy against holdout periods
- Delivery — A final report with budget recommendations already weeks old
Total timeline: 3-6 months. Cost: $150,000-$500,000 per engagement. Refresh cycle: once per year, maybe twice.
Multivariate Regression: The Workhorse
Traditional MMM relied on linear regression. The model looked like this:
Sales = Base + (TV coefficient x TV spend) + (Radio coefficient x Radio spend) + (Print coefficient x Print spend) + error
Each coefficient represented how much one dollar of spend in that channel moved revenue. The model tested thousands of combinations to find the coefficients that best explained historical sales patterns.
The problem? Linear regression assumes linear relationships. It cannot capture the reality that your 10th TV ad performs differently than your 100th. It struggles with channels that interact. And it requires 2-3 years of clean, weekly data to produce stable results.
Why Companies Hated It
Three pain points killed adoption among mid-market brands.
Cost. A single MMM study from Nielsen, Kantar, or Analytic Partners ran $150,000-$500,000. Only Fortune 500 brands could justify that expense on a regular basis.
Speed. By the time a 6-month model delivered results, the Q4 campaign it analyzed was ancient history. Marketers needed answers in weeks, not quarters.
Black box. Most consulting firms delivered final numbers without explaining the model. Marketing teams received recommendations they could not question, challenge, or adapt. That lack of transparency eroded trust.
The result? MMM became a checkbox exercise for large enterprises. Mid-market brands never touched it. Small businesses did not know it existed.
Stop guessing which channels drive revenue. Stacc publishes 30 SEO-optimized articles per month so organic becomes a measurable, compounding channel in your marketing mix. Start for $1 →
Chapter 3: How AI Transforms Marketing Mix Modeling {#ch3}
AI did not just speed up MMM. It changed what MMM can do. The shift from regression-based consulting projects to AI-driven platforms happened between 2022 and 2025. By 2026, real-time MMM is becoming the standard for mid-market and enterprise brands.
Speed: Months to Days
Traditional MMM took 3-6 months. AI-driven MMM platforms deliver initial models in 1-2 weeks. Some, like Recast and Prescient AI, produce results within days after data connection.
The reason is automation. AI handles the manual steps that consumed analyst time. Data cleaning, variable selection, model iteration, and sensitivity testing all run automatically. A process that required 3 econometricians for 8 weeks now runs on a server overnight.
Granularity: Channel to Campaign Level
Old-school MMM measured broad channels. You learned that “digital advertising” drove 22% of incremental revenue. That helped with annual planning but not with Tuesday’s budget decision.
AI-driven MMM operates at the campaign and ad set level. You can see that your retargeting campaign on Meta outperforms your prospecting campaign by 3x. You can identify which creative variants drive real incrementality versus the ones that just capture existing demand.
This granularity emerged in 2025 when platforms started estimating Marginal Incremental ROAS (miROAS) at the campaign level. That metric tells you what one additional dollar in a specific campaign produces.
Real-Time Updates
The biggest shift in 2026 is continuous modeling. Legacy MMM produced a static snapshot. AI-driven MMM ingests data hourly and recalculates models multiple times per day.
That means your budget recommendations update as market conditions change. A competitor launches a sale? The model detects the impact within days. Your TV campaign underperforms? The model flags it before you waste 3 more weeks of spend.
Accessibility: Enterprise to Everyone
Traditional MMM required a PhD in econometrics. AI-driven MMM platforms use chat interfaces, drag-and-drop dashboards, and natural language queries. A marketing manager can ask, “What happens if I move $20,000 from display to paid search?” and get a modeled answer in seconds.
This is the “agentic MMM” trend. AI agents handle the entire workflow: data ingestion, model building, scenario planning, and recommendation delivery. The marketer provides business context. The AI does the math.
Cost: Six Figures to Free
Google released Meridian as an open-source MMM framework in 2025. Meta open-sourced Robyn even earlier. Uber released Orbit for Bayesian time-series modeling. These free tools put enterprise-grade modeling in reach of any company with a data analyst.
Commercial platforms like Recast, Sellforte, and Prescient AI offer managed MMM services starting at $2,000-$5,000 per month. That is 95% cheaper than a traditional consulting engagement.
Chapter 4: AI and ML Techniques Behind Modern MMM {#ch4}
You do not need to understand the math to use AI-driven MMM. But knowing the techniques helps you evaluate vendors, ask better questions, and avoid models built on flawed assumptions.
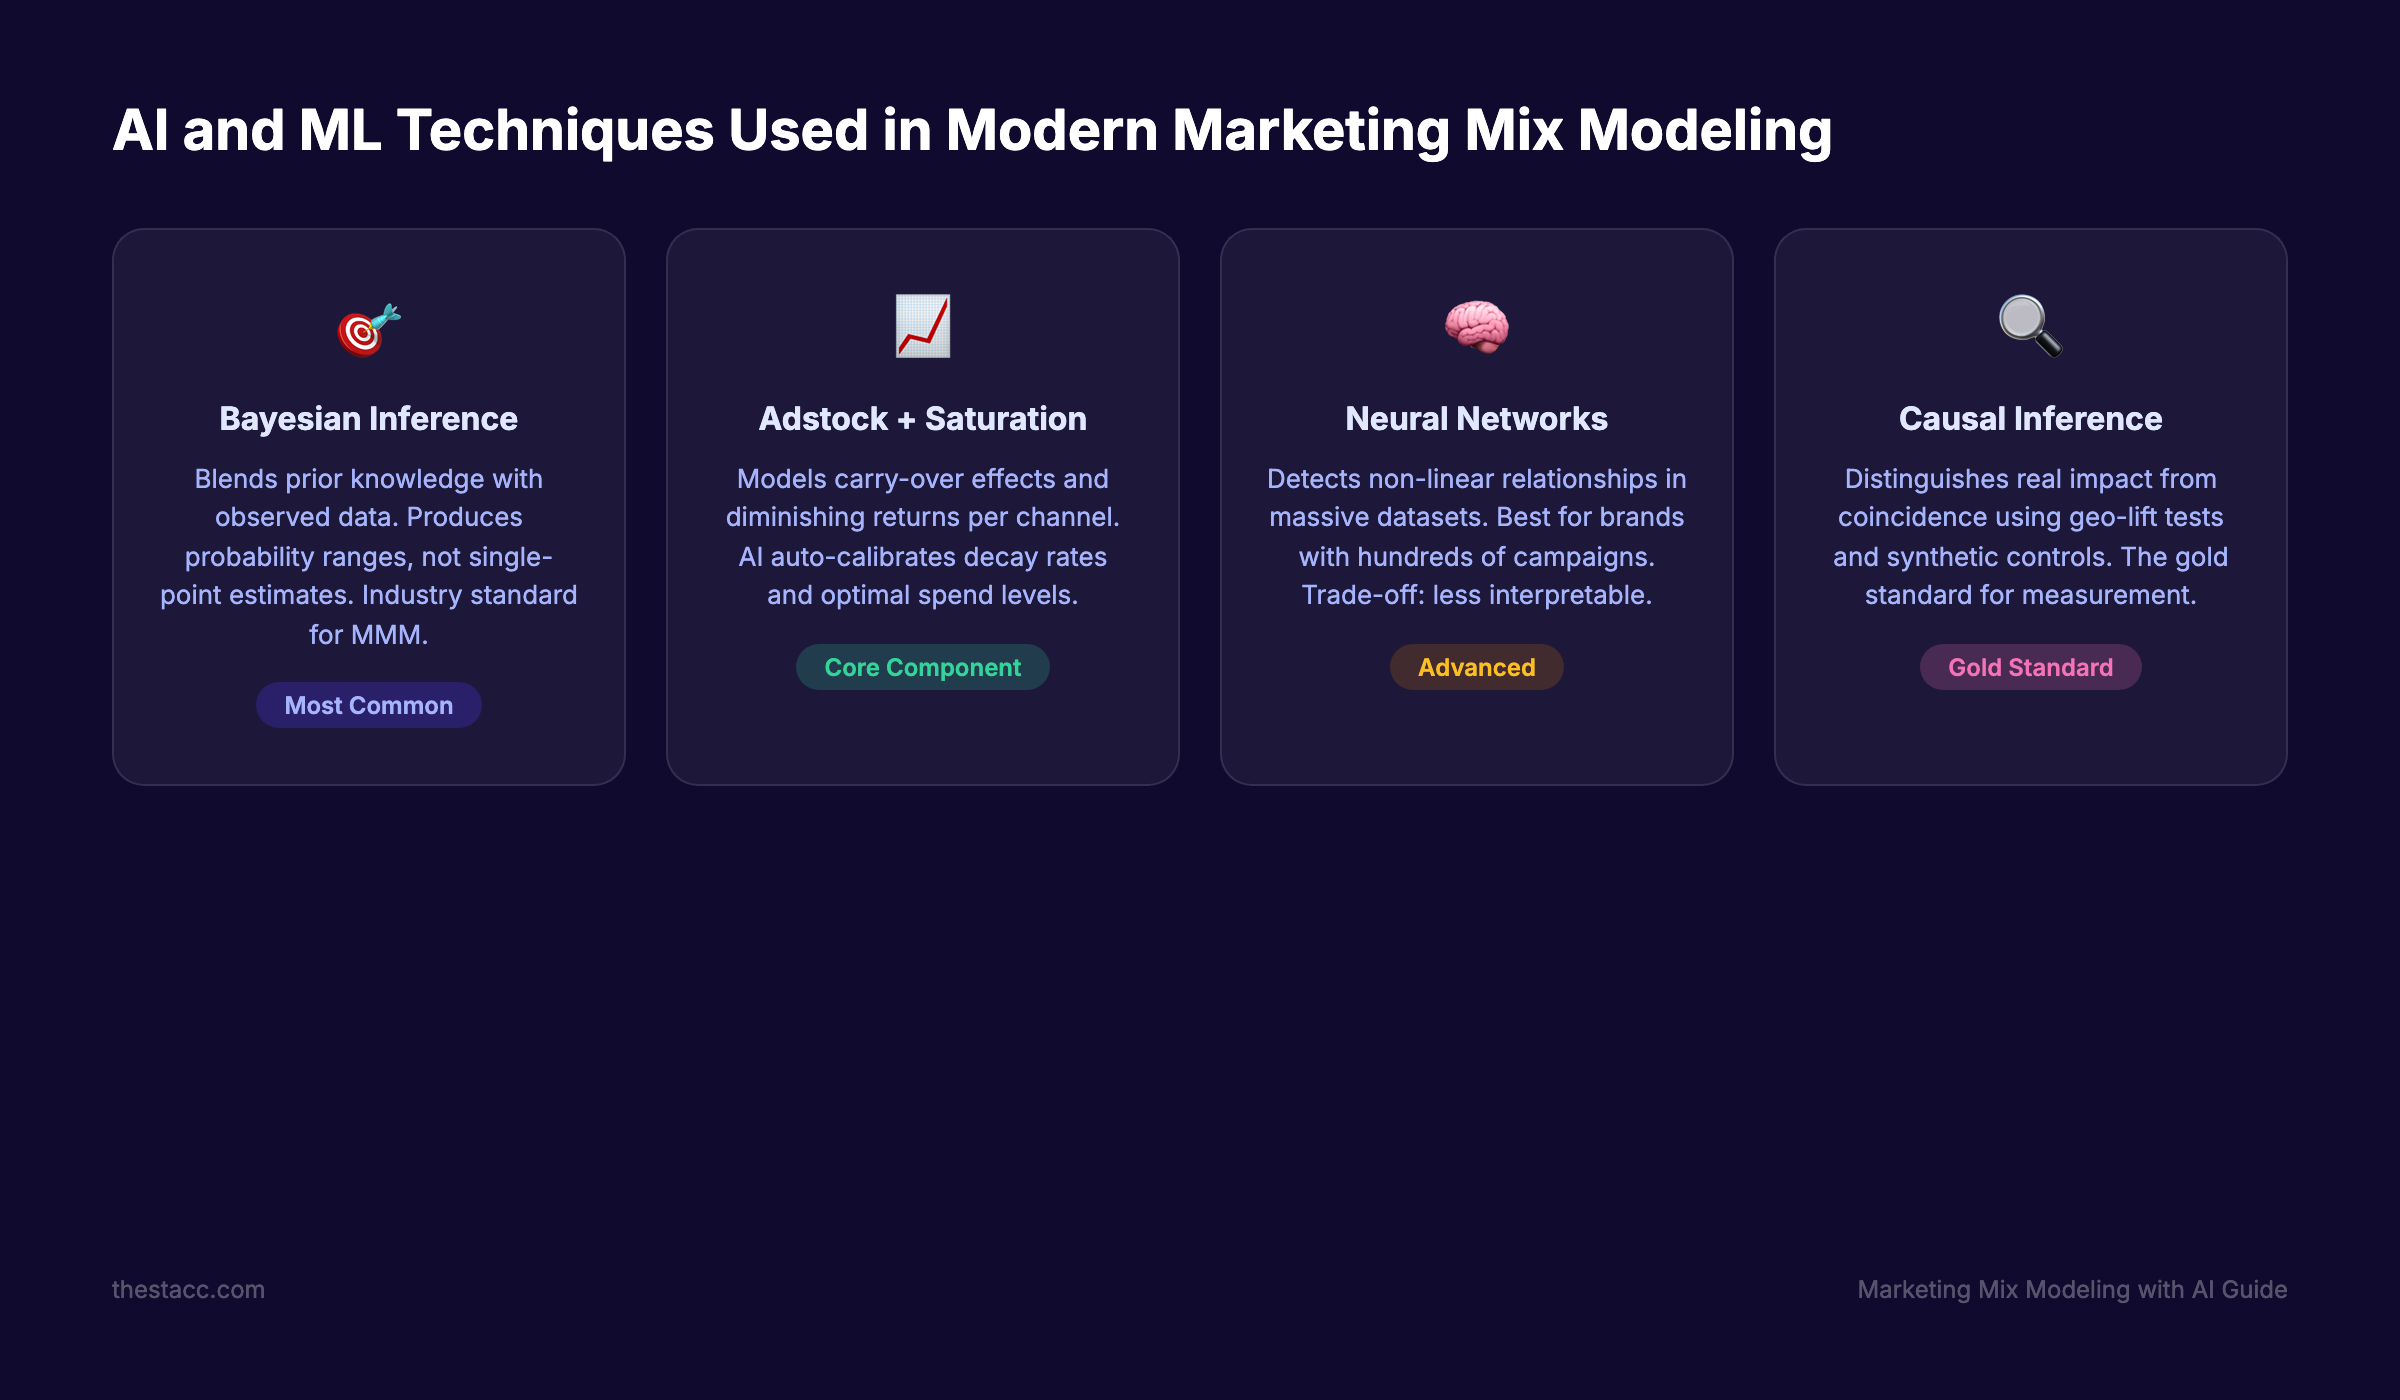
Bayesian Methods
Most modern MMM platforms use Bayesian inference. This approach does 2 things traditional regression cannot.
First, it incorporates prior knowledge. If you ran an incrementality test showing Facebook drives a 2.5x ROAS, you feed that result into the model as a “prior.” The model blends your real-world data with the test result to produce more accurate estimates.
Second, Bayesian models produce probability distributions instead of single numbers. Instead of “TV drives $4.20 per dollar,” you get “TV drives between $3.50 and $5.10 per dollar, with 90% confidence.” That range helps you make decisions with appropriate uncertainty.
Google Meridian, Meta Robyn, and PyMC-Labs all use Bayesian frameworks. This is now the industry standard.
Adstock and Saturation Curves
Two concepts matter for every MMM model.
Adstock measures the carry-over effect of advertising. A TV ad airs on Monday, but its impact on sales continues through Friday. Adstock functions model this decay. AI automates the estimation of decay rates per channel, something that took analysts weeks to calibrate manually.
Saturation curves capture diminishing returns. Your first $10,000 in Google Ads produces strong returns. Your 10th $10,000 produces less. At some point, additional spend barely moves the needle. AI fits these curves automatically and identifies the optimal spend level for each channel.
| Concept | What It Measures | Why It Matters |
|---|---|---|
| Adstock | How long an ad’s effect lasts | Prevents undervaluing channels with delayed impact |
| Saturation | Where diminishing returns begin | Identifies overspending on maxed-out channels |
| Priors | Pre-existing knowledge about a channel | Improves accuracy with real test data |
| Interaction effects | How channels amplify each other | Reveals that TV + search together outperform each alone |
Neural Networks and Deep Learning
Some platforms use neural networks for MMM, especially for brands with massive datasets across hundreds of campaigns. Neural networks detect non-linear relationships that Bayesian models might miss.
The trade-off is interpretability. Bayesian models show you exactly why they recommend shifting budget from Display to Search. Neural networks give you the answer but less of the reasoning. For most marketers, Bayesian methods offer the better balance of accuracy and transparency.
Causal Inference
The gold standard in modern MMM is causal modeling. Correlation is not causation. Just because you spent more on Meta ads in the same month revenue grew does not mean Meta caused the growth.
Causal inference techniques, including geo-lift tests, synthetic controls, and instrumental variables, help MMM distinguish real impact from coincidence. The best AI-driven platforms integrate incrementality test results directly into their models to anchor the causal claims.
Chapter 5: What Data Inputs AI-Driven MMM Requires {#ch5}
A model is only as good as its data. The number 1 reason MMM projects fail is not bad algorithms. It is incomplete or messy input data. Here is what you need and how to organize it.
Marketing Spend Data
You need weekly spend data for every marketing channel. The minimum viable dataset covers 2 years (104 weekly observations). Three years is better.
- Paid search spend by platform (Google, Bing)
- Paid social spend by platform (Meta, LinkedIn, TikTok)
- Display and programmatic spend
- TV, radio, and OOH spend (if applicable)
- Email marketing costs
- Content marketing and SEO investment
- Event and sponsorship spend
- Affiliate and referral program costs
Break spend into the most granular level possible. “Digital advertising” as one line item produces a useless model. Separate Google Search from Google Display from YouTube.
Revenue and Conversion Data
The model needs a target variable. For most businesses, that is weekly revenue or weekly conversions. E-commerce brands use transactions. SaaS companies use sign-ups or MRR. Service businesses use leads or booked appointments.
Match the revenue time grain to your spend data. If spend is weekly, revenue must be weekly. Mixing daily spend with monthly revenue creates alignment problems that corrupt the model.
External Factors
MMM must account for forces outside your control. Without these, the model attributes their impact to your marketing channels and inflates your ROI estimates.
| External Factor | Example | Data Source |
|---|---|---|
| Seasonality | Holiday shopping spikes | Historical sales patterns |
| Economic indicators | Consumer confidence, CPI | Federal Reserve, BLS |
| Weather | Extreme heat reduces foot traffic | NOAA |
| Competitor activity | Rival launches a sale | Manual tracking, SimilarWeb |
| Industry events | Trade shows, product launches | Internal calendar |
| COVID/disruptions | Supply chain delays | Internal records |
Organic and SEO Data
This is the input most brands forget. Your organic traffic data belongs in the model. Pull weekly organic sessions, organic conversions, and keyword rankings from Google Search Console or Google Analytics 4.
Without organic data, the model cannot distinguish between paid-driven sales and organic-driven sales. That gap leads to over-crediting paid channels and under-funding content.
Organic traffic compounds over time. Every article Stacc publishes builds your domain authority and feeds your marketing mix model with better data. Start for $1 →
Chapter 6: Why Most Marketing Mix Models Ignore SEO (And Why That Is a Mistake) {#ch6}
Here is the biggest blind spot in marketing mix modeling: organic search. Most MMM studies either exclude SEO entirely or lump it into a “base sales” bucket that gets no credit for marketing effort.
That is a $50,000+ mistake for any brand investing in content.
The Attribution Problem
Traditional MMM treats organic search as background noise. The logic goes: “We did not pay for those clicks, so they belong in base sales.” But that logic ignores every dollar spent on content creation, technical SEO, link building, and site optimization.
When a brand publishes 30 blog posts per month, that investment drives organic traffic growth. If the MMM model does not account for content velocity, it attributes organic-driven revenue to other channels or to the “unexplained” bucket.
Research shows organic search accounts for 53% of all website traffic across industries. For B2B companies, that number reaches 64%. Excluding the channel that drives more than half your traffic from your measurement framework is negligent.
How SEO Should Enter the Model
To model organic search correctly, include these inputs:
- Content investment — Monthly spend on writers, editors, SEO tools, and publishing platforms
- Organic sessions — Weekly sessions from Google organic search
- Indexed pages — Total pages indexed over time (a proxy for content volume)
- Domain authority or link equity — Monthly backlink metrics from Ahrefs or Semrush
- Keyword rankings — Average position for target keywords, tracked weekly
The model then estimates the incremental revenue contribution of your content investment. It accounts for the lagged effect of SEO, where content published in January starts ranking in March and peaks in June.
This lag is exactly why brands undervalue SEO. SEO takes 3-6 months to show results. MMM with proper adstock functions captures that delay and credits content for its long-term impact.
The Compounding Effect
Paid channels produce linear returns. Spend $10,000 this month, get results this month. Stop spending, results stop.
Organic content produces compounding returns. Publish 30 articles this month. They start ranking in 3 months. They keep driving traffic for 2 years. Each new article strengthens the domain, helping older articles rank higher.
When you include SEO in your marketing mix model, the ROI curve looks different from every other channel. It starts slow, then accelerates. A properly configured model reveals this compounding pattern and prevents you from cutting content investment during the slow early phase.
| Channel | Time to ROI | Decay Rate | Compounding? |
|---|---|---|---|
| Paid search | Immediate | 100% when paused | No |
| Paid social | 1-7 days | 95% when paused | No |
| TV/Video | 1-3 weeks | Gradual over weeks | No |
| 1-3 days | Minimal per send | Slight (list growth) | |
| SEO/Content | 3-6 months | Very slow | Yes — strong |
What Happens When You Add SEO to the Model
Brands that add organic search to their MMM typically discover 2 things.
First, paid search ROAS drops. The model reveals that some paid search conversions would have happened organically. That branded search campaign capturing existing demand gets less credit once organic traffic enters the picture.
Second, content investment shows higher ROI than expected. The lagged, compounding nature of SEO means its true lifetime value is 3-5x what monthly content marketing ROI calculations suggest.
Chapter 7: Popular AI-Powered MMM Tools and Platforms {#ch7}
The MMM tool market split into 2 categories in 2025: open-source frameworks and commercial platforms. Both use AI. The difference is who does the work.
Open-Source MMM Frameworks
These are free but require a data analyst or data scientist to implement.
Google Meridian Released in 2025 and now available to everyone. Built on Bayesian causal inference. Supports reach and frequency data as inputs (unique among MMM tools). Includes a partner ecosystem of 20+ certified measurement firms. Best for brands with an in-house analytics team.
Meta Robyn Open-sourced by Meta in 2022. Built in R. Uses ridge regression with gradient-based optimization. Includes automated hyperparameter tuning and budget allocation. Has the largest community of MMM practitioners. Best for teams comfortable with R.
Uber Orbit A Bayesian time-series forecasting library. Not MMM-specific, but widely used for marketing mix models. Built on probabilistic programming. Best for advanced teams building custom models.
PyMC Marketing An open-source Bayesian marketing toolkit from PyMC Labs. Includes pre-built MMM components for adstock, saturation curves, and budget optimization. The AI MMM Agent feature compresses weeks of model building into hours.
| Framework | Language | Method | Best For |
|---|---|---|---|
| Google Meridian | Python | Bayesian | Brands with analytics teams |
| Meta Robyn | R | Ridge regression + optimization | R-proficient data teams |
| Uber Orbit | Python | Bayesian time-series | Custom model builders |
| PyMC Marketing | Python | Bayesian | Teams wanting pre-built components |
Commercial MMM Platforms
These handle everything: data ingestion, model building, scenario planning, and reporting. No data science team required.
Recast Self-serve MMM platform. Connects to your ad platforms via API, builds models automatically, and delivers weekly budget recommendations. Pricing starts around $2,000-$4,000/month.
Prescient AI Focused on e-commerce and DTC brands. Provides daily-updated models, creative-level insights, and automated budget allocation. Known for fast implementation (days, not weeks).
Sellforte European-based platform with strong retail and CPG focus. Offers both self-serve and managed options. Recently launched agentic MMM features with natural language querying.
Measured Enterprise-focused platform combining MMM with incrementality testing. Uses a “Unified Marketing Measurement” approach. Strong media calibration capabilities.
Lifesight Mid-market platform with scenario planning tools. Combines MMM with multi-touch attribution for a unified view. Good starting point for brands new to measurement.
Your organic channel deserves measurement too. Stacc publishes consistent, SEO-optimized content that compounds. See the difference in your marketing mix within 90 days. Start for $1 →
Chapter 8: How to Read and Act on MMM Outputs {#ch8}
Building a model is step 1. Using the results to make better decisions is the part that generates ROI. Most MMM projects fail not at the modeling stage but at the interpretation stage. Here is how to read the outputs.
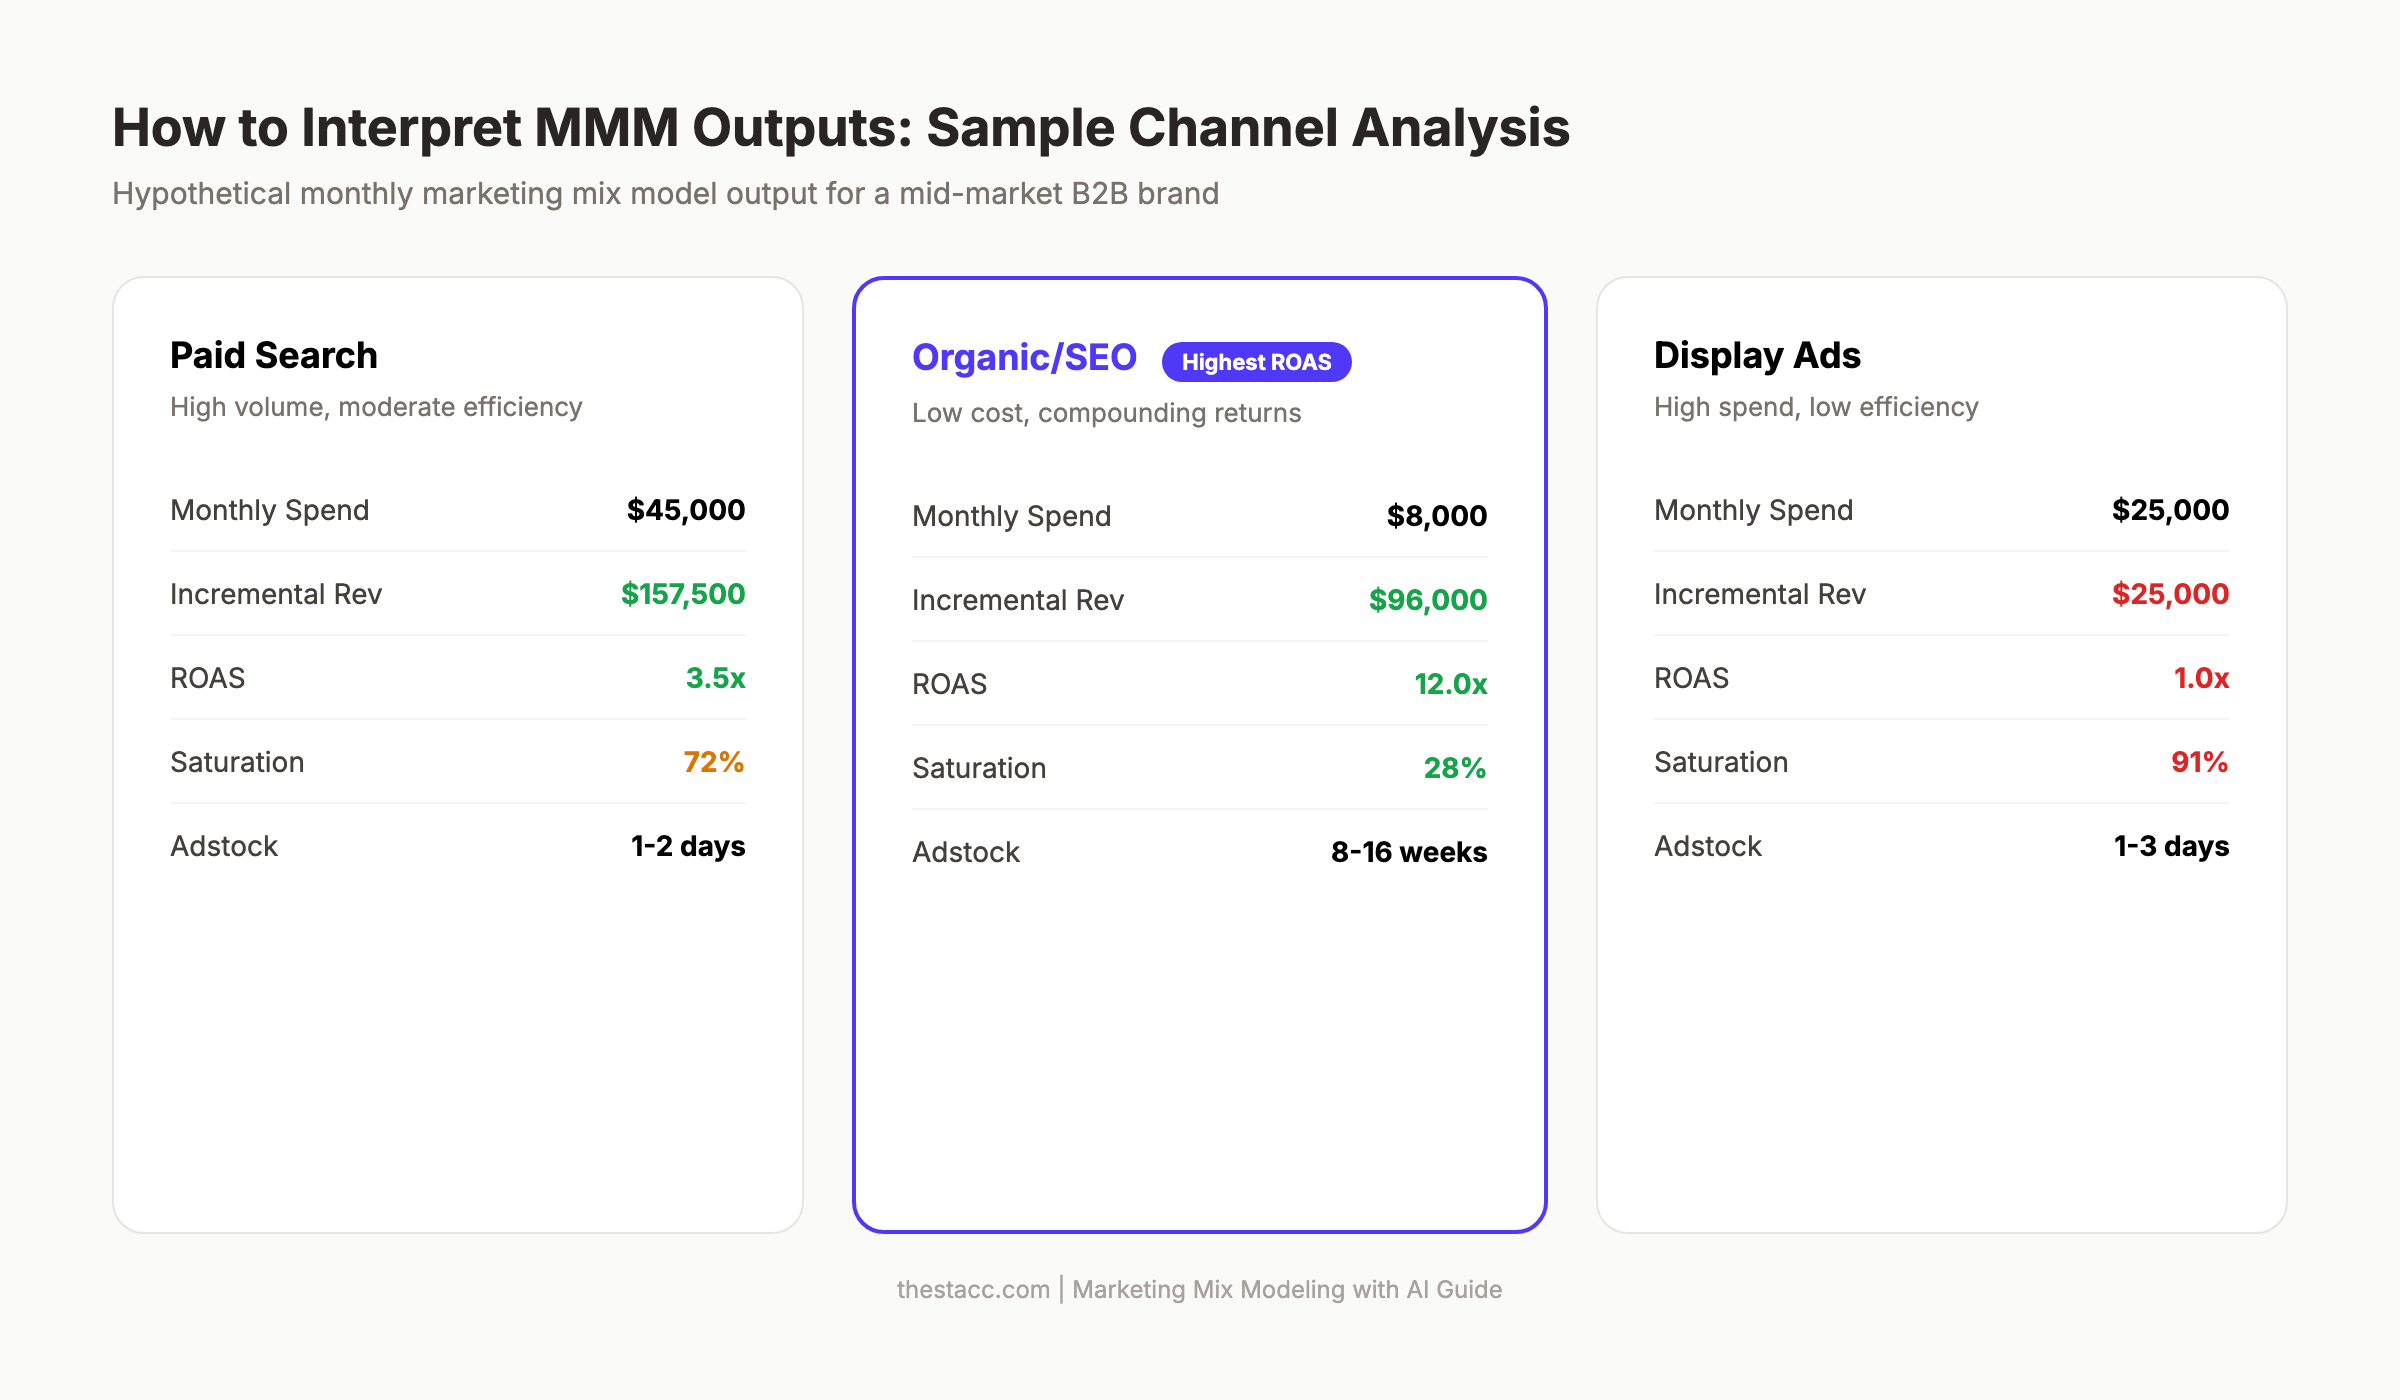
ROI by Channel
The primary output is a revenue contribution breakdown. The model shows how much incremental revenue each channel produced per dollar spent.
Example output:
| Channel | Spend | Incremental Revenue | ROAS | Share of Incremental |
|---|---|---|---|---|
| Google Search | $45,000 | $157,500 | 3.5x | 28% |
| Meta Ads | $35,000 | $84,000 | 2.4x | 15% |
| Organic/SEO | $8,000 | $96,000 | 12.0x | 17% |
| TV/CTV | $60,000 | $132,000 | 2.2x | 23% |
| $3,000 | $54,000 | 18.0x | 10% | |
| Display | $25,000 | $25,000 | 1.0x | 4% |
In this example, organic SEO and email produce the highest ROAS. Display barely breaks even. A naive marketer would double down on TV because of its large absolute contribution. A smart marketer would shift Display budget to Organic and Email, where marginal returns are highest.
Saturation Curves
Every channel hits a point of diminishing returns. The saturation curve shows where you sit on that curve right now.
If your Google Search spend sits on the steep part of the curve, adding more budget produces strong returns. If it sits on the flat part, every additional dollar produces less and less.
This is the most actionable output. It tells you not just “where to spend” but “how much is too much.” Most brands discover they overspend on 1-2 channels and underspend on 2-3 others.
Budget Optimizer
AI-driven platforms include scenario planning tools. You input your total budget and constraints (“TV cannot go below $40,000” or “Must maintain Meta presence”). The optimizer recommends the allocation that maximizes total revenue.
Run 3 scenarios:
- Current allocation vs. optimized allocation
- 10% budget increase — where should the extra money go?
- 10% budget cut — where do you trim with least impact?
Adstock Insights
The model reveals how long each channel’s impact lasts after you stop spending. Content marketing and SEO show the longest adstock periods, often 8-16 weeks. Paid social shows the shortest, typically 1-3 days.
This changes how you think about “pausing” channels. Pausing paid social for a week has minimal long-term impact. Pausing content publishing for a quarter destroys months of momentum that take months to rebuild.
Response Curves by Time Period
Look at how channel effectiveness changes across seasons. Your Meta ads might produce a 3x ROAS in Q1 but a 1.5x ROAS in Q4 when CPMs spike from holiday competition.
This output drives tactical decisions. Increase SEO and email investment in Q4 when paid channels get expensive. Increase paid spend in Q1 when competition drops and CPMs fall.
Chapter 9: How to Start with MMM Without a Data Science Team {#ch9}
You do not need a team of data scientists. You do not need a $200,000 consulting contract. Here is how marketing managers and small business owners can start with marketing mix modeling this quarter.
Option 1: Start with Google Meridian + A Partner
Google built a certified partner network of 20+ measurement firms trained on Meridian. These partners charge a fraction of traditional consulting fees because Meridian handles the heavy modeling work.
Expect to pay $5,000-$20,000 for a guided Meridian implementation versus $150,000+ for a traditional MMM study. The partner helps with data preparation, model configuration, and result interpretation.
Option 2: Use a Self-Serve Platform
Platforms like Recast, Lifesight, and Prescient AI require no data science expertise. Connect your ad platforms, upload your revenue data, and the platform builds the model automatically.
Implementation timeline: 2-4 weeks. Ongoing cost: $2,000-$5,000/month. That pays for itself if it identifies even a 5% improvement in budget allocation on a $100,000 monthly spend.
Option 3: Build a Simple Model Yourself
For brands spending under $20,000 per month on marketing, a full MMM platform may be overkill. Start with a simplified approach:
- Track weekly spend per channel in a spreadsheet
- Track weekly revenue or leads in the same spreadsheet
- Run a basic regression in Google Sheets or Excel
- Look for obvious patterns — weeks with high organic investment and low paid spend still drove strong revenue? That tells you something.
This is not real MMM. But it builds the data habit. When you are ready for a proper model, you will have clean historical data to feed it.
Option 4: Focus on the Data Foundation First
If your data is scattered across 6 platforms with no central tracking, pause the modeling ambition. Fix the data layer first.
- Centralize all marketing spend in one spreadsheet or tool
- Set up Google Analytics 4 with proper conversion tracking
- Track organic performance weekly in Google Search Console
- Record offline marketing spend (events, print, sponsorships)
- Maintain a log of external events (competitor moves, industry shifts, PR hits)
After 6 months of clean data, you are ready for any MMM platform.
The Content Layer
One variable most small businesses can control: content velocity. Companies that publish consistent, SEO-optimized blog content create a measurable organic channel that feeds the model with signal rather than noise.
When your marketing mix model shows organic search contributing 15-20% of incremental revenue at a 10x+ ROAS, the case for sustained content investment becomes impossible to ignore. Scaling blog content is how you build that organic signal over time.
The Content Compound Effect is real. Each month of consistent publishing adds data points to your model, strengthens organic rankings, and compounds on previous content. That is exactly what our clients see when they automate their SEO workflow through Stacc.
Ready to make organic search a measurable growth channel? Stacc publishes 30 SEO articles per month. Your marketing mix model will thank you. Start for $1 →
Frequently Asked Questions {#faq}
What is the difference between marketing mix modeling and attribution modeling?
Attribution modeling tracks individual user journeys across touchpoints. It relies on cookies and pixel tracking. Marketing mix modeling uses aggregate historical data to measure channel impact. It does not need user-level tracking, which makes it privacy-safe. MMM answers “which channels drive revenue at a macro level.” Attribution answers “which touchpoints influenced this specific conversion.” The best measurement programs use both.
How much data do I need to run a marketing mix model?
The minimum is 2 years of weekly data, giving you 104 observations. Three years is better because it provides more seasonal cycles for the model to learn from. You also need at least 5 active marketing channels with meaningful spend variation. If you spent the exact same amount on Google Ads every week for 2 years, the model cannot estimate its impact.
Is marketing mix modeling only for large enterprises?
Not anymore. Open-source tools like Google Meridian and Meta Robyn are free. Self-serve platforms start at $2,000 per month. Any brand spending $50,000+ per month on marketing across 4 or more channels has enough data and enough at stake to benefit from MMM.
How often should I update my marketing mix model?
AI-driven platforms update continuously, some daily. If you use an open-source framework, refresh the model quarterly at minimum. Annual updates (the old consulting model) are too slow. Market conditions, competitor behavior, and channel performance shift faster than a yearly cadence can capture.
Can marketing mix modeling measure the impact of SEO and content marketing?
Yes, but only if you include the right inputs. Feed the model your weekly content investment, organic sessions, indexed pages, and domain authority metrics. Without these inputs, the model lumps organic revenue into base sales and gives SEO zero credit. Content marketing statistics show organic drives 53% of web traffic. Excluding it from your model is a measurement failure.
What are the biggest limitations of AI-driven MMM?
Three main limitations exist. First, correlation still is not causation. Even AI models can attribute revenue to the wrong channel without incrementality test calibration. Second, data quality remains the bottleneck. Bad input data produces bad model output regardless of how advanced the algorithm is. Third, MMM works best at the strategic level. It tells you where to allocate budget across channels but cannot optimize individual ad creative or bidding strategies. Pair MMM with platform-level optimization for complete coverage.
Marketing mix modeling with AI is no longer a luxury for Fortune 500 brands. Open-source frameworks and self-serve platforms put real measurement within reach of any marketing team willing to organize its data. The brands that adopt AI-driven MMM now will reallocate faster, waste less, and compound the channels, like SEO and content, that their competitors still ignore. Start with the data foundation. The model will follow.
Written and published by Stacc. We publish 3,500+ articles per month across 70+ industries. All data verified against public sources as of March 2026.
