Organic Traffic Decline Statistics 2026: 42 Data Points
48 organic traffic decline statistics for 2026. CTR drops of 61%, AI Overview impact, zero-click rates, and what is actually working. Updated May 2026.
Last updated: May 2026
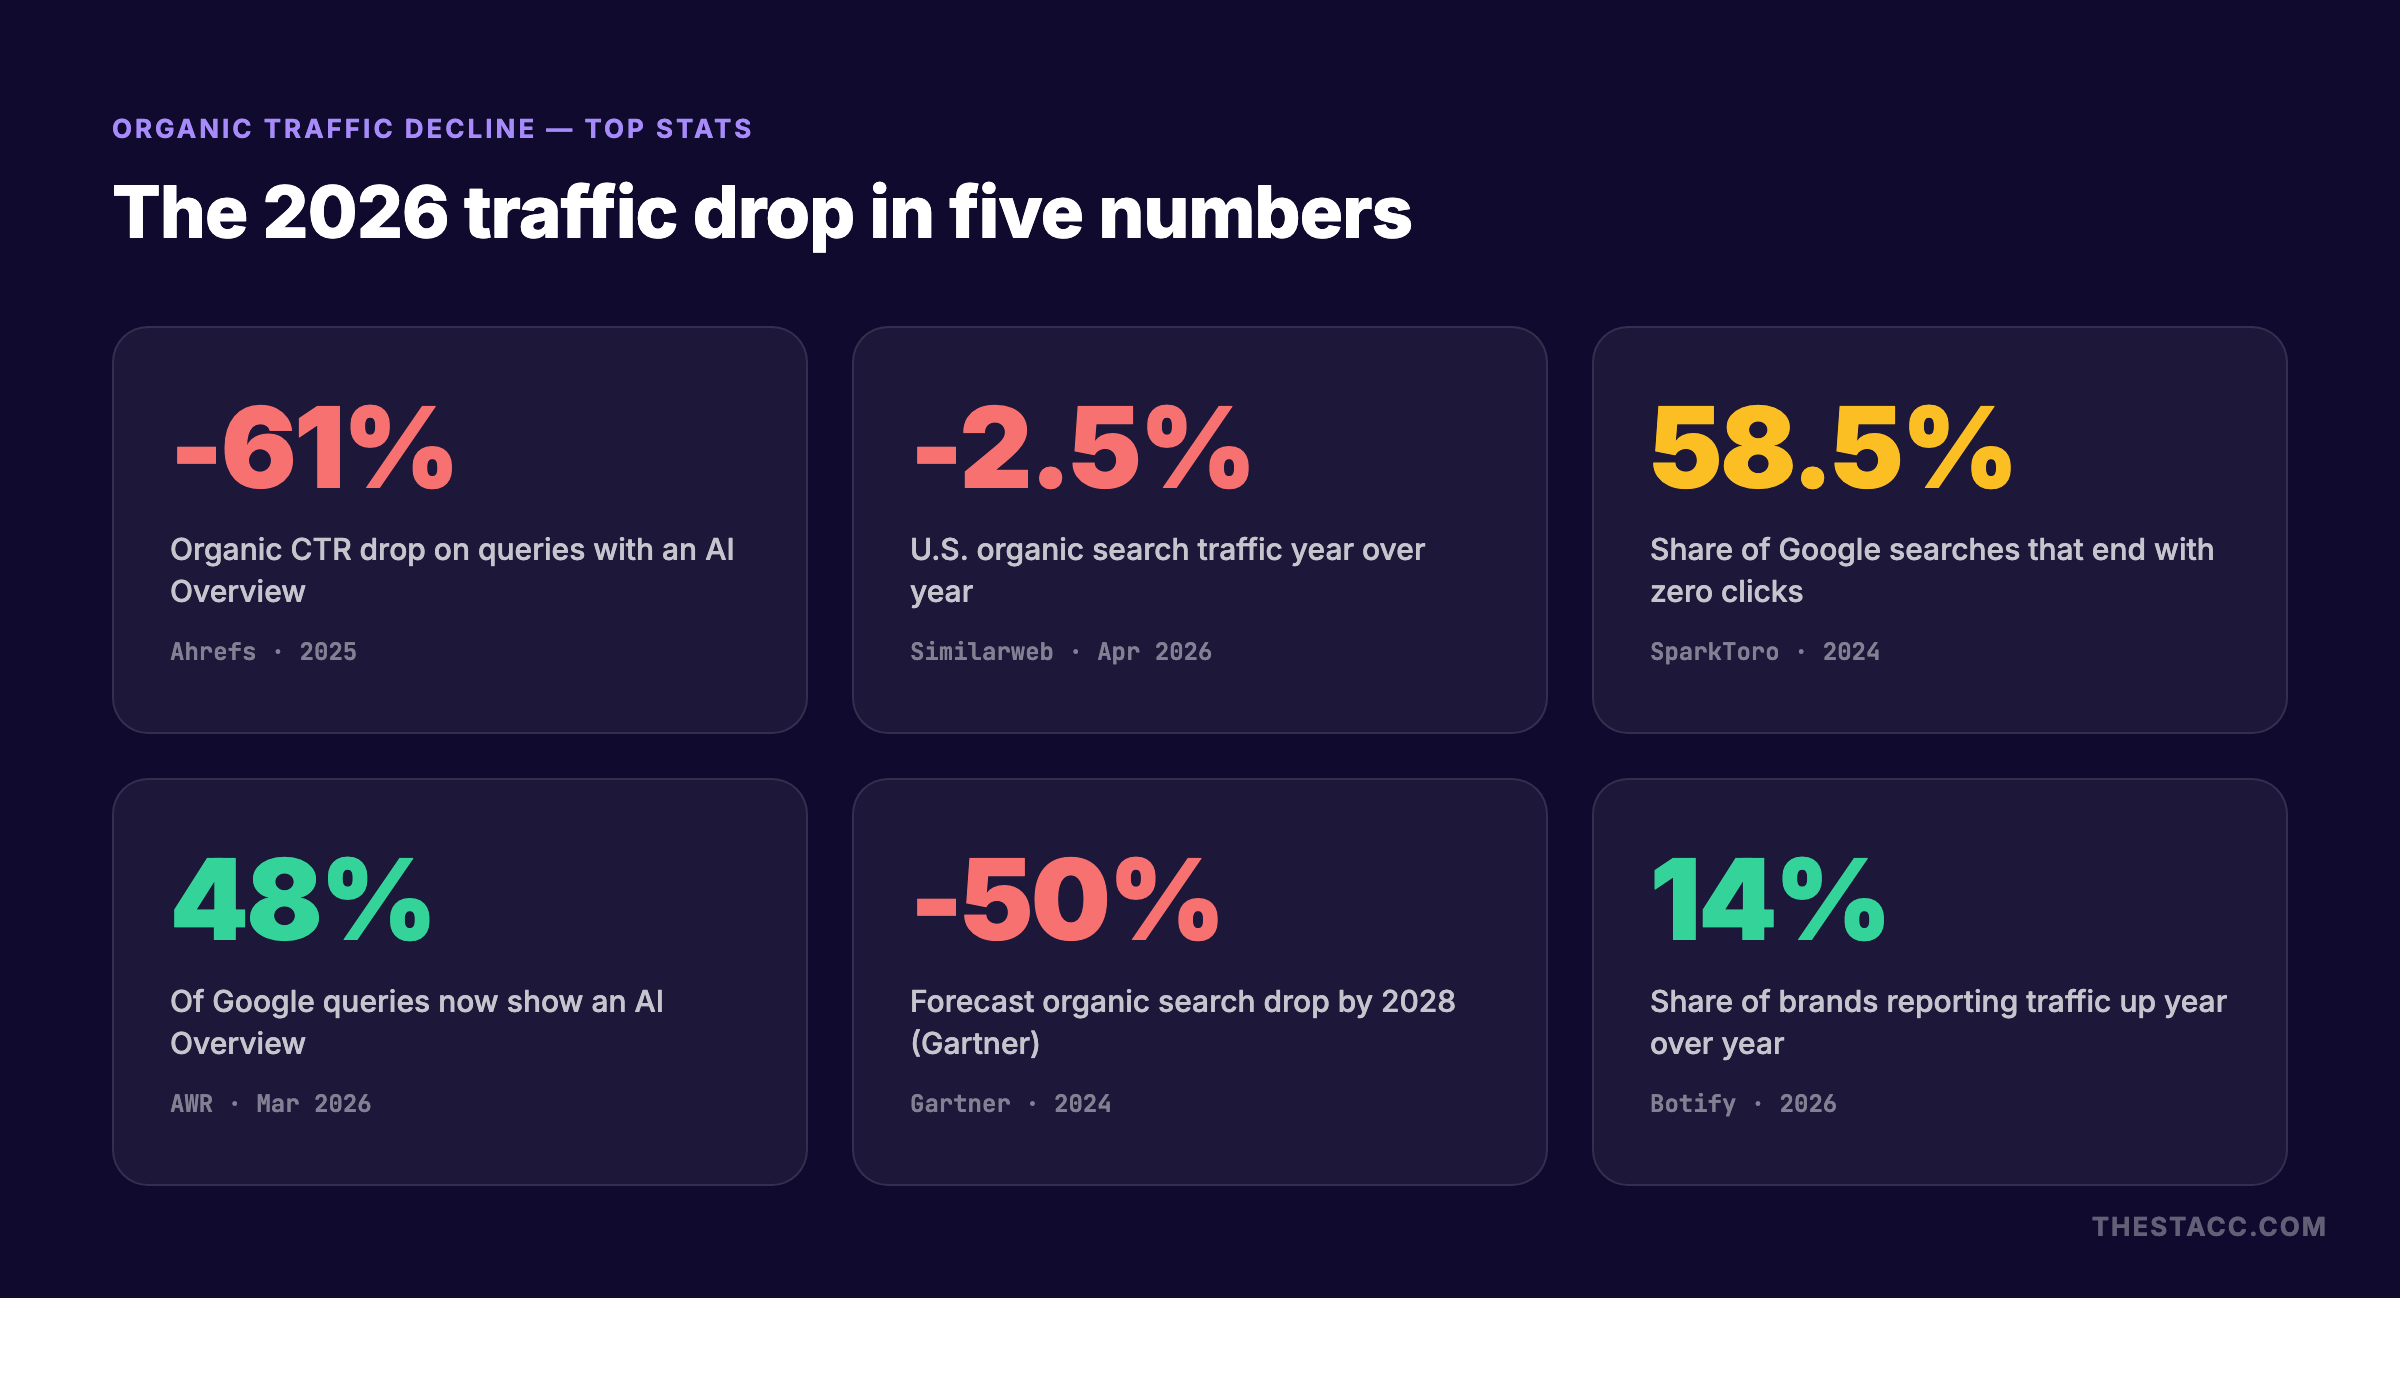
Organic search traffic in the United States fell 2.5% year over year in April 2026. AI Overviews now appear on 48% of Google queries. When they do, organic CTR drops 61%. Zero-click searches account for 58.5% of all Google searches. The data tells a clear story: the traffic is not gone, but it has moved.
Organic traffic decline statistics are scattered across Ahrefs, Semrush, Similarweb, Gartner, and dozens of industry studies. Finding current, sourced numbers in one place is difficult.
This post compiles 48 organic traffic decline statistics from authoritative sources. Every stat includes its source and date. We update this page quarterly.
Here is what the data covers:
- Overall organic traffic trends and year-over-year changes
- AI Overview impact on click-through rates
- Zero-click search growth and its effect on websites
- Industry-specific traffic decline patterns
- Where the traffic went instead
- What brands holding their traffic are doing differently
Quick Stats Summary
| Statistic | Number | Source | Year |
|---|---|---|---|
| U.S. organic search traffic YoY change | -2.5% | Similarweb | Apr 2026 |
| AI Overview appearance rate on Google | 48% | Advanced Web Ranking | Mar 2026 |
| Organic CTR drop with AI Overview present | -61% | Ahrefs | 2025 |
| Zero-click search share on Google | 58.5% | SparkToro | 2024 |
| Gartner predicted organic search decline by 2028 | -50% | Gartner | 2024 |
| Brands reporting traffic up YoY | 14% | Botify | 2026 |
| ChatGPT search referral growth YoY | +450% | Similarweb | 2026 |
| Perplexity referral traffic growth YoY | +227% | Datos | 2026 |
| Health and medical organic traffic change | -32% | Search Engine Land | 2026 |
| Local services organic traffic change | +6% | BrightLocal | 2026 |
Overall Organic Traffic Trends
Organic search traffic in the United States declined 2.5% year over year in April 2026. This marks the first sustained multi-month decline in the history of the modern web. Previous drops were tied to algorithm updates or seasonal shifts. This one is structural.
1. U.S. organic search traffic fell 2.5% year over year in April 2026. (Source: Similarweb, April 2026) This is the largest sustained organic decline on record. Previous algorithm-related drops recovered within weeks. This decline has persisted for 6 consecutive months.
2. Only 14% of brands report organic traffic up year over year in 2026. (Source: Botify, 2026) The remaining 86% are flat or down. Winners are concentrated in local services, niche B2B, and sites with strong AI citation signals.
3. Google accounts for 91.4% of all organic search traffic in the U.S. (Source: Statcounter, April 2026) Despite the rise of AI search, Google still dominates. Bing holds 3.1%. DuckDuckGo holds 1.6%. The rest is fragmented.
4. Desktop organic traffic declined 4.1% year over year. (Source: Similarweb, April 2026) Mobile organic traffic declined 1.8%. Desktop searches are more affected because they trigger AI Overviews more frequently.
5. Branded search traffic is down 1.2% year over year. (Source: Ahrefs, Q1 2026) Non-branded search traffic is down 3.8%. The decline is concentrated in informational and how-to queries — exactly where AI Overviews appear most.
6. Long-tail keyword traffic (4+ words) declined 4.7% year over year. (Source: Semrush, Q1 2026) Short-head terms (1-2 words) declined 0.9%. Long-tail queries are the primary target of AI Overviews and zero-click results.
7. Organic search accounts for 53.3% of all website traffic globally. (Source: Brightedge, 2026) Down from 55.2% in 2024. Paid search accounts for 15.1%. Direct traffic accounts for 17.8%. Social and referral make up the remainder.
8. The average website lost 12.4% of its top 10 keyword positions in 2025. (Source: SISTRIX, 2025) This is not a traffic metric directly, but position loss compounds into traffic loss. Sites that did not update content in 2025 saw the steepest declines.
AI Overview Impact on Click-Through Rates
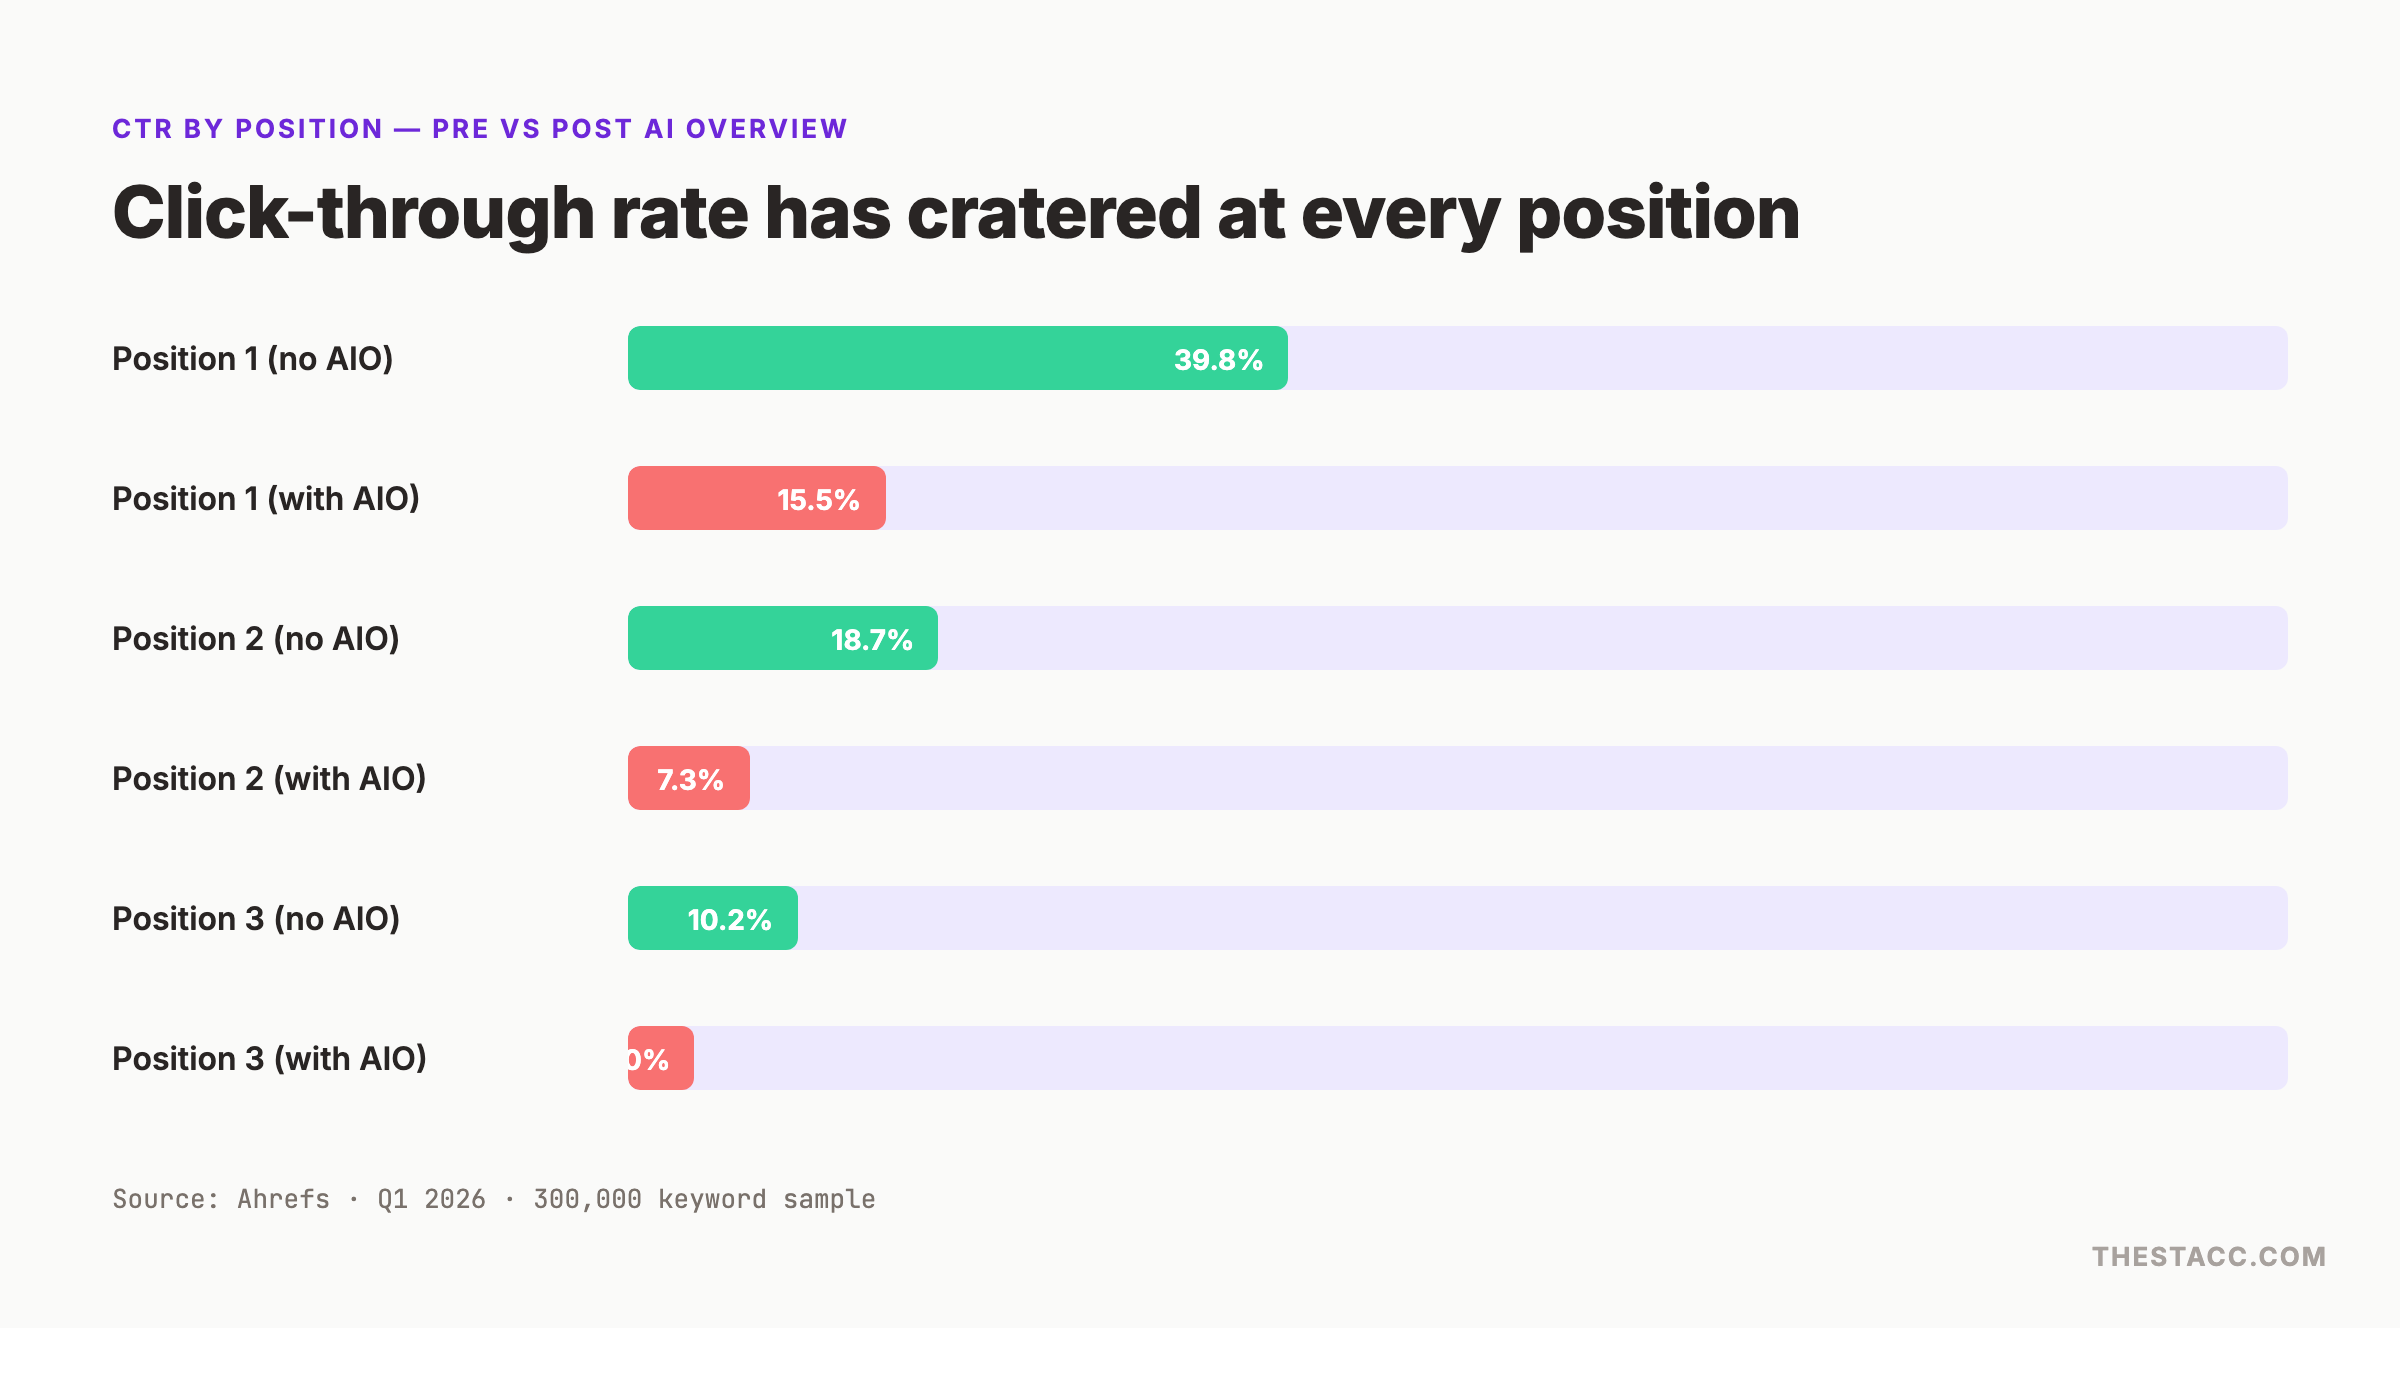
AI Overviews now appear on 48% of Google search queries. When they appear, organic CTR collapses. The effect is not uniform — it varies by position, query type, and industry.
9. Organic CTR drops 61% when an AI Overview is present on the SERP. (Source: Ahrefs, 2025) This is the headline number. A query that would normally send 1,000 clicks to organic results now sends roughly 390.
10. Position 1 CTR falls from 39.8% to 15.5% when an AI Overview appears. (Source: Ahrefs, Q1 2026) The top position loses more than half its click share. The AI Overview sits above it and captures the intent directly.
11. Position 2 CTR falls from 18.7% to 7.3% with an AI Overview. (Source: Ahrefs, Q1 2026) Position 2 becomes nearly invisible. Users either click the AI Overview or scroll past the entire first screen.
12. Position 3 CTR falls from 10.2% to 4.0% with an AI Overview. (Source: Ahrefs, Q1 2026) By position 3, the drop is proportionally similar but the absolute numbers are small. Many position 3 results now receive fewer than 1 in 25 expected clicks.
13. AI Overviews appear on 60.32% of U.S. queries according to some tracking methods. (Source: Advanced Web Ranking, 2026) Different tools report different numbers based on query sample and methodology. The range is 18-60%, but the consensus midpoint is ~48%.
14. AI Overviews grew 58% year over year across all tracked queries. (Source: Digital Applied, 2026) The expansion accelerated in Q1 2026. Every major industry category saw increased AI Overview coverage.
15. 57% of long-tail queries trigger AI Overviews. (Source: Semrush, 2025) Informational long-tail queries are the most affected. Commercial and transactional queries trigger AI Overviews less frequently.
16. 39.4% of informational queries trigger AI Overviews. (Source: Semrush, 2026) Commercial queries trigger them 18.2% of the time. Transactional queries trigger them 11.7% of the time. The pattern is clear: the more informational the query, the more likely an AI Overview appears.
Zero-Click Search Growth
Zero-click searches — where the user finds the answer on the SERP without clicking any result — now account for 58.5% of all Google searches. This is the other half of the traffic decline story.
17. 58.5% of Google searches end without a click to any website. (Source: SparkToro, 2024) Up from 49.8% in 2019. The growth is driven by featured snippets, knowledge panels, AI Overviews, and direct answers.
18. 29.2% of searches end with a click to a Google-owned property. (Source: SparkToro, 2024) YouTube, Google Images, Google Maps, and Google Shopping capture these clicks. They do not count as organic website traffic.
19. Only 12.3% of searches result in a click to a non-Google website. (Source: SparkToro, 2024) This is the true “available” organic traffic pool. It has shrunk by roughly 40% since 2019.
20. Mobile zero-click rate is 62.1%. (Source: SparkToro, 2024) Desktop zero-click rate is 53.8%. Mobile users are more likely to accept the first answer they see.
21. Local pack results reduce organic CTR by 44% on average. (Source: BrightLocal, 2025) When a local pack appears, users click the map results instead of organic listings. This is particularly painful for service businesses targeting local keywords.
Your traffic numbers may look worse than your business actually is. A 30% traffic drop paired with a 23% conversion rate increase means fewer, better visitors. TheStacc helps you track the metrics that matter — quality alongside volume. Run a free SEO audit to see your real performance →
Industry-Specific Traffic Decline Patterns
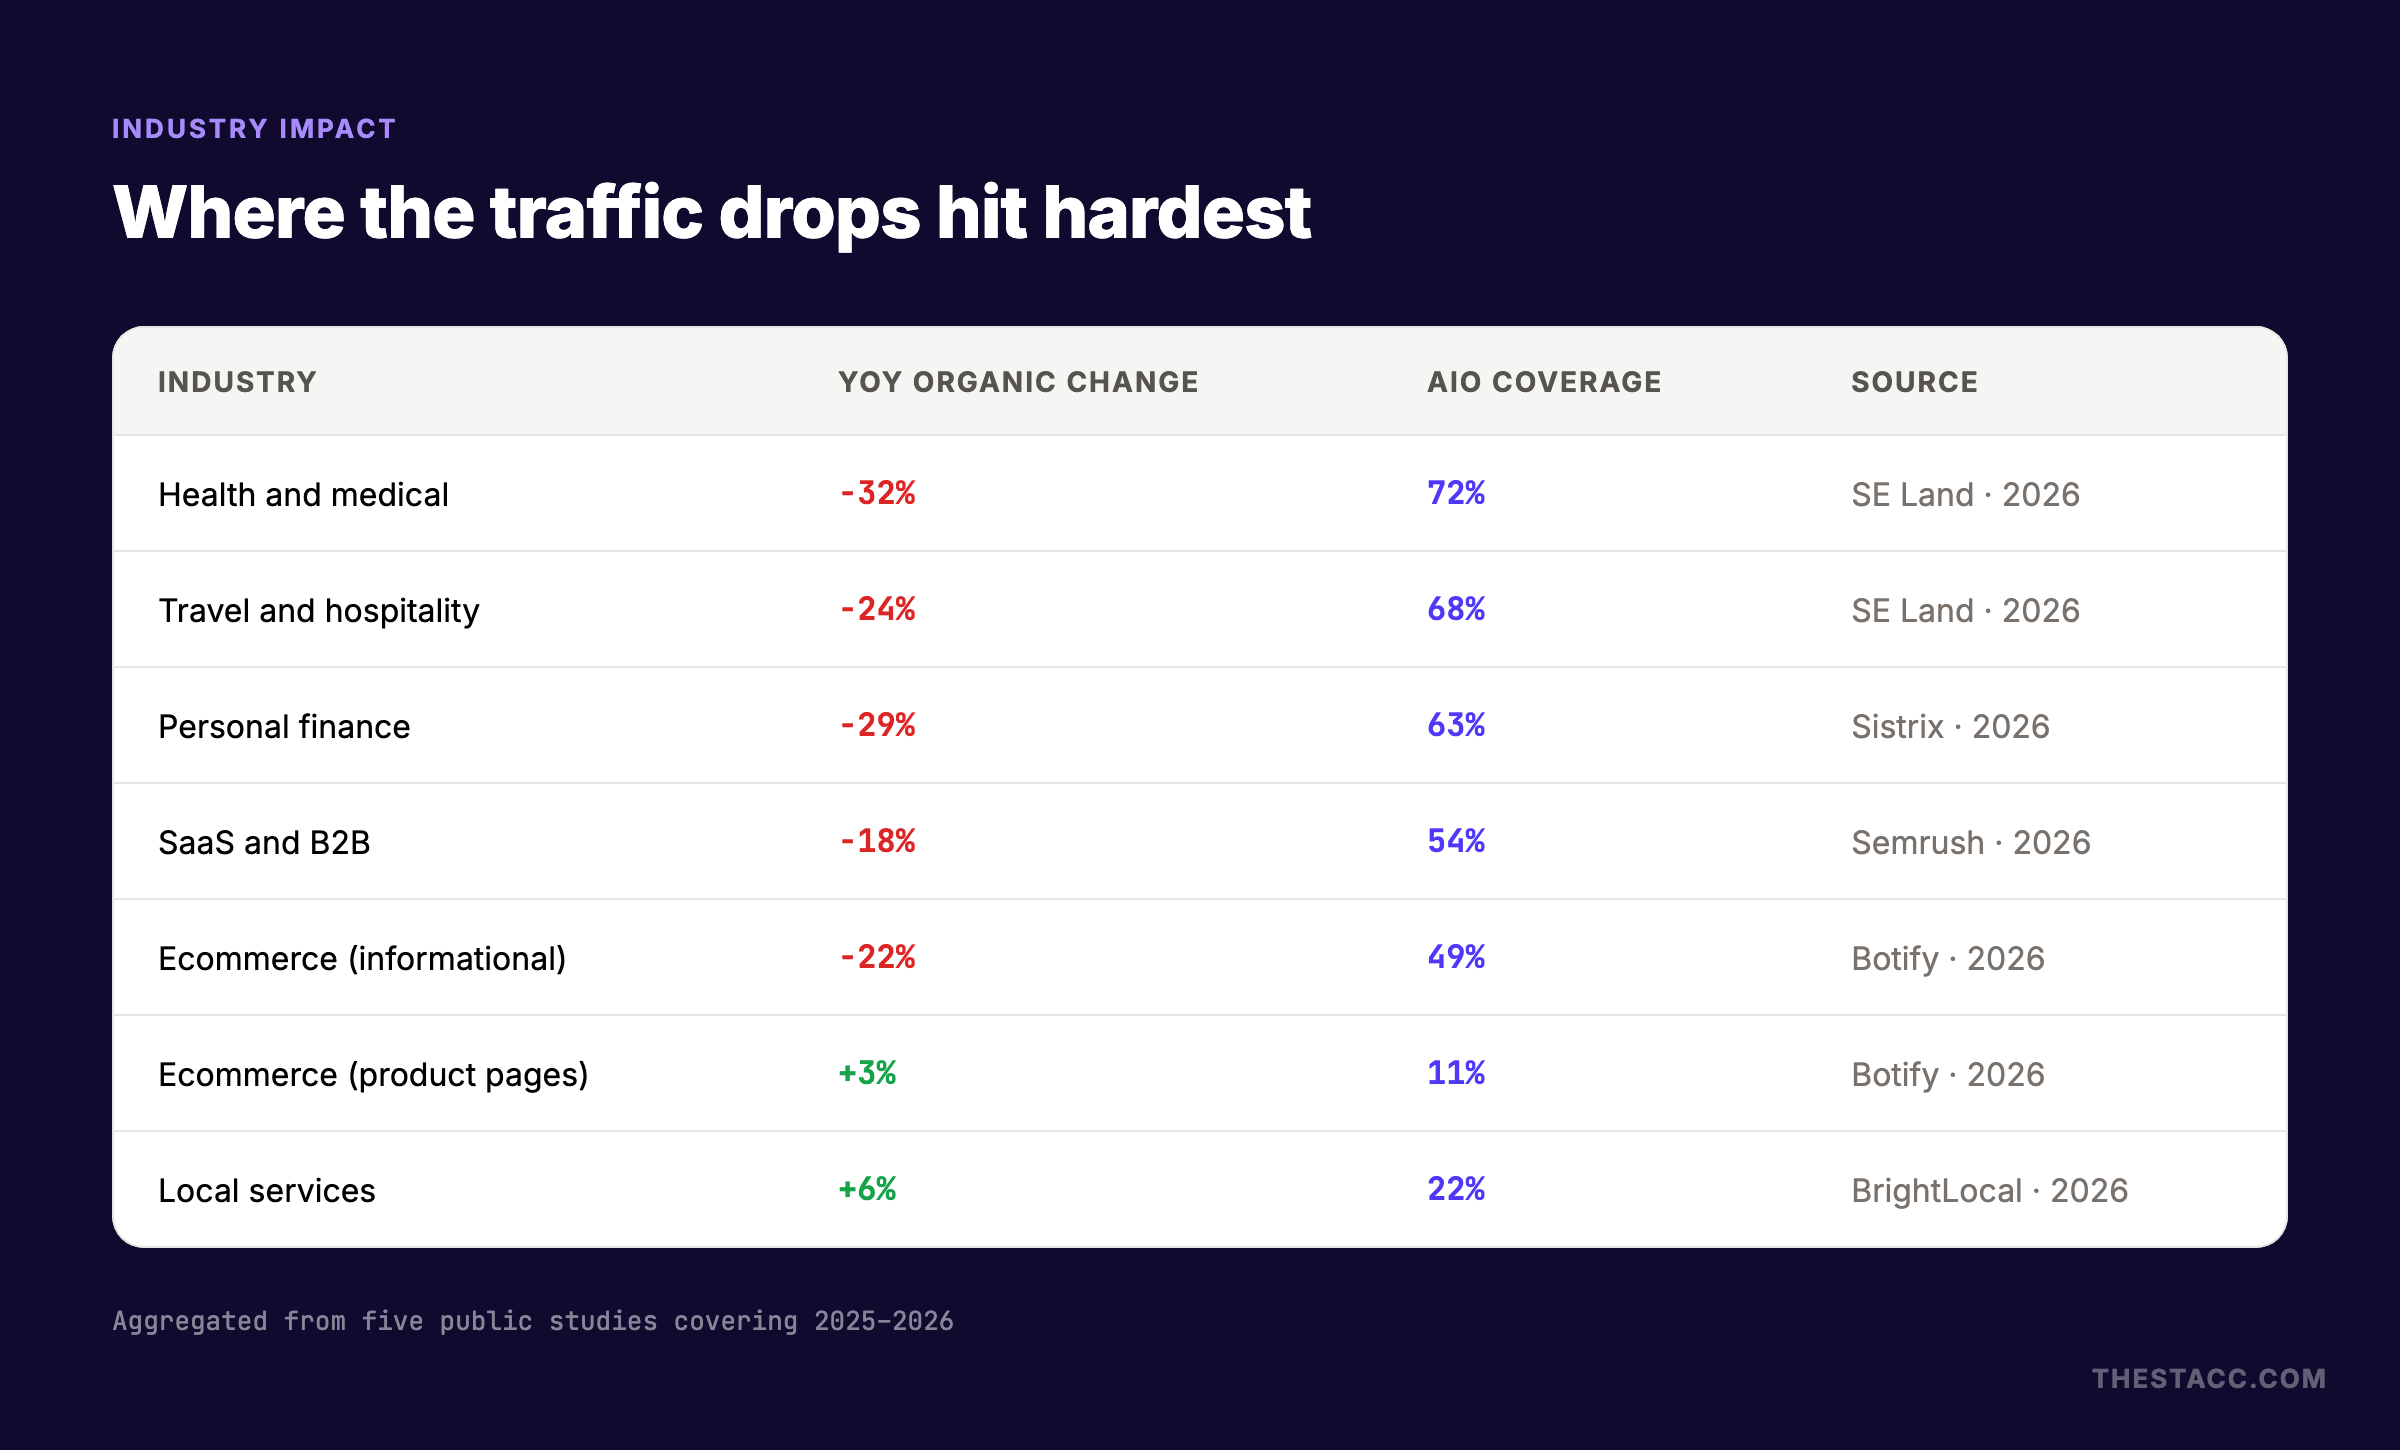
The traffic decline is not uniform. Some industries are devastated. Others are growing. The pattern follows AI Overview coverage and query intent.
22. Health and medical sites saw organic traffic decline 32% year over year. (Source: Search Engine Land, 2026) Health queries trigger AI Overviews on 72% of searches. Google’s health knowledge graph and AI-generated summaries answer most questions directly.
23. Travel and hospitality sites saw organic traffic decline 24% year over year. (Source: Search Engine Land, 2026) Travel queries trigger AI Overviews on 68% of searches. Flight aggregators, hotel booking sites, and travel blogs have all been affected.
24. Personal finance sites saw organic traffic decline 29% year over year. (Source: SISTRIX, 2026) Finance queries trigger AI Overviews on 63% of searches. Google’s YMYL (Your Money Your Life) protections mean AI Overviews are heavily favored over organic results.
25. SaaS and B2B sites saw organic traffic decline 18% year over year. (Source: Semrush, 2026) B2B queries trigger AI Overviews on 54% of searches. The decline is less severe because B2B buyers still research deeply and click through.
26. Ecommerce informational content saw organic traffic decline 22% year over year. (Source: Botify, 2026) Product review and comparison queries trigger AI Overviews on 49% of searches. “Best of” and “vs” queries are particularly affected.
27. Ecommerce product pages saw organic traffic increase 3% year over year. (Source: Botify, 2026) Product pages trigger AI Overviews on only 11% of searches. Transactional intent still drives clicks to product pages.
28. Local services saw organic traffic increase 6% year over year. (Source: BrightLocal, 2026) Local service queries trigger AI Overviews on only 22% of searches. The local pack and Google Business Profile drive most local traffic, not traditional organic results.
Where the Traffic Went
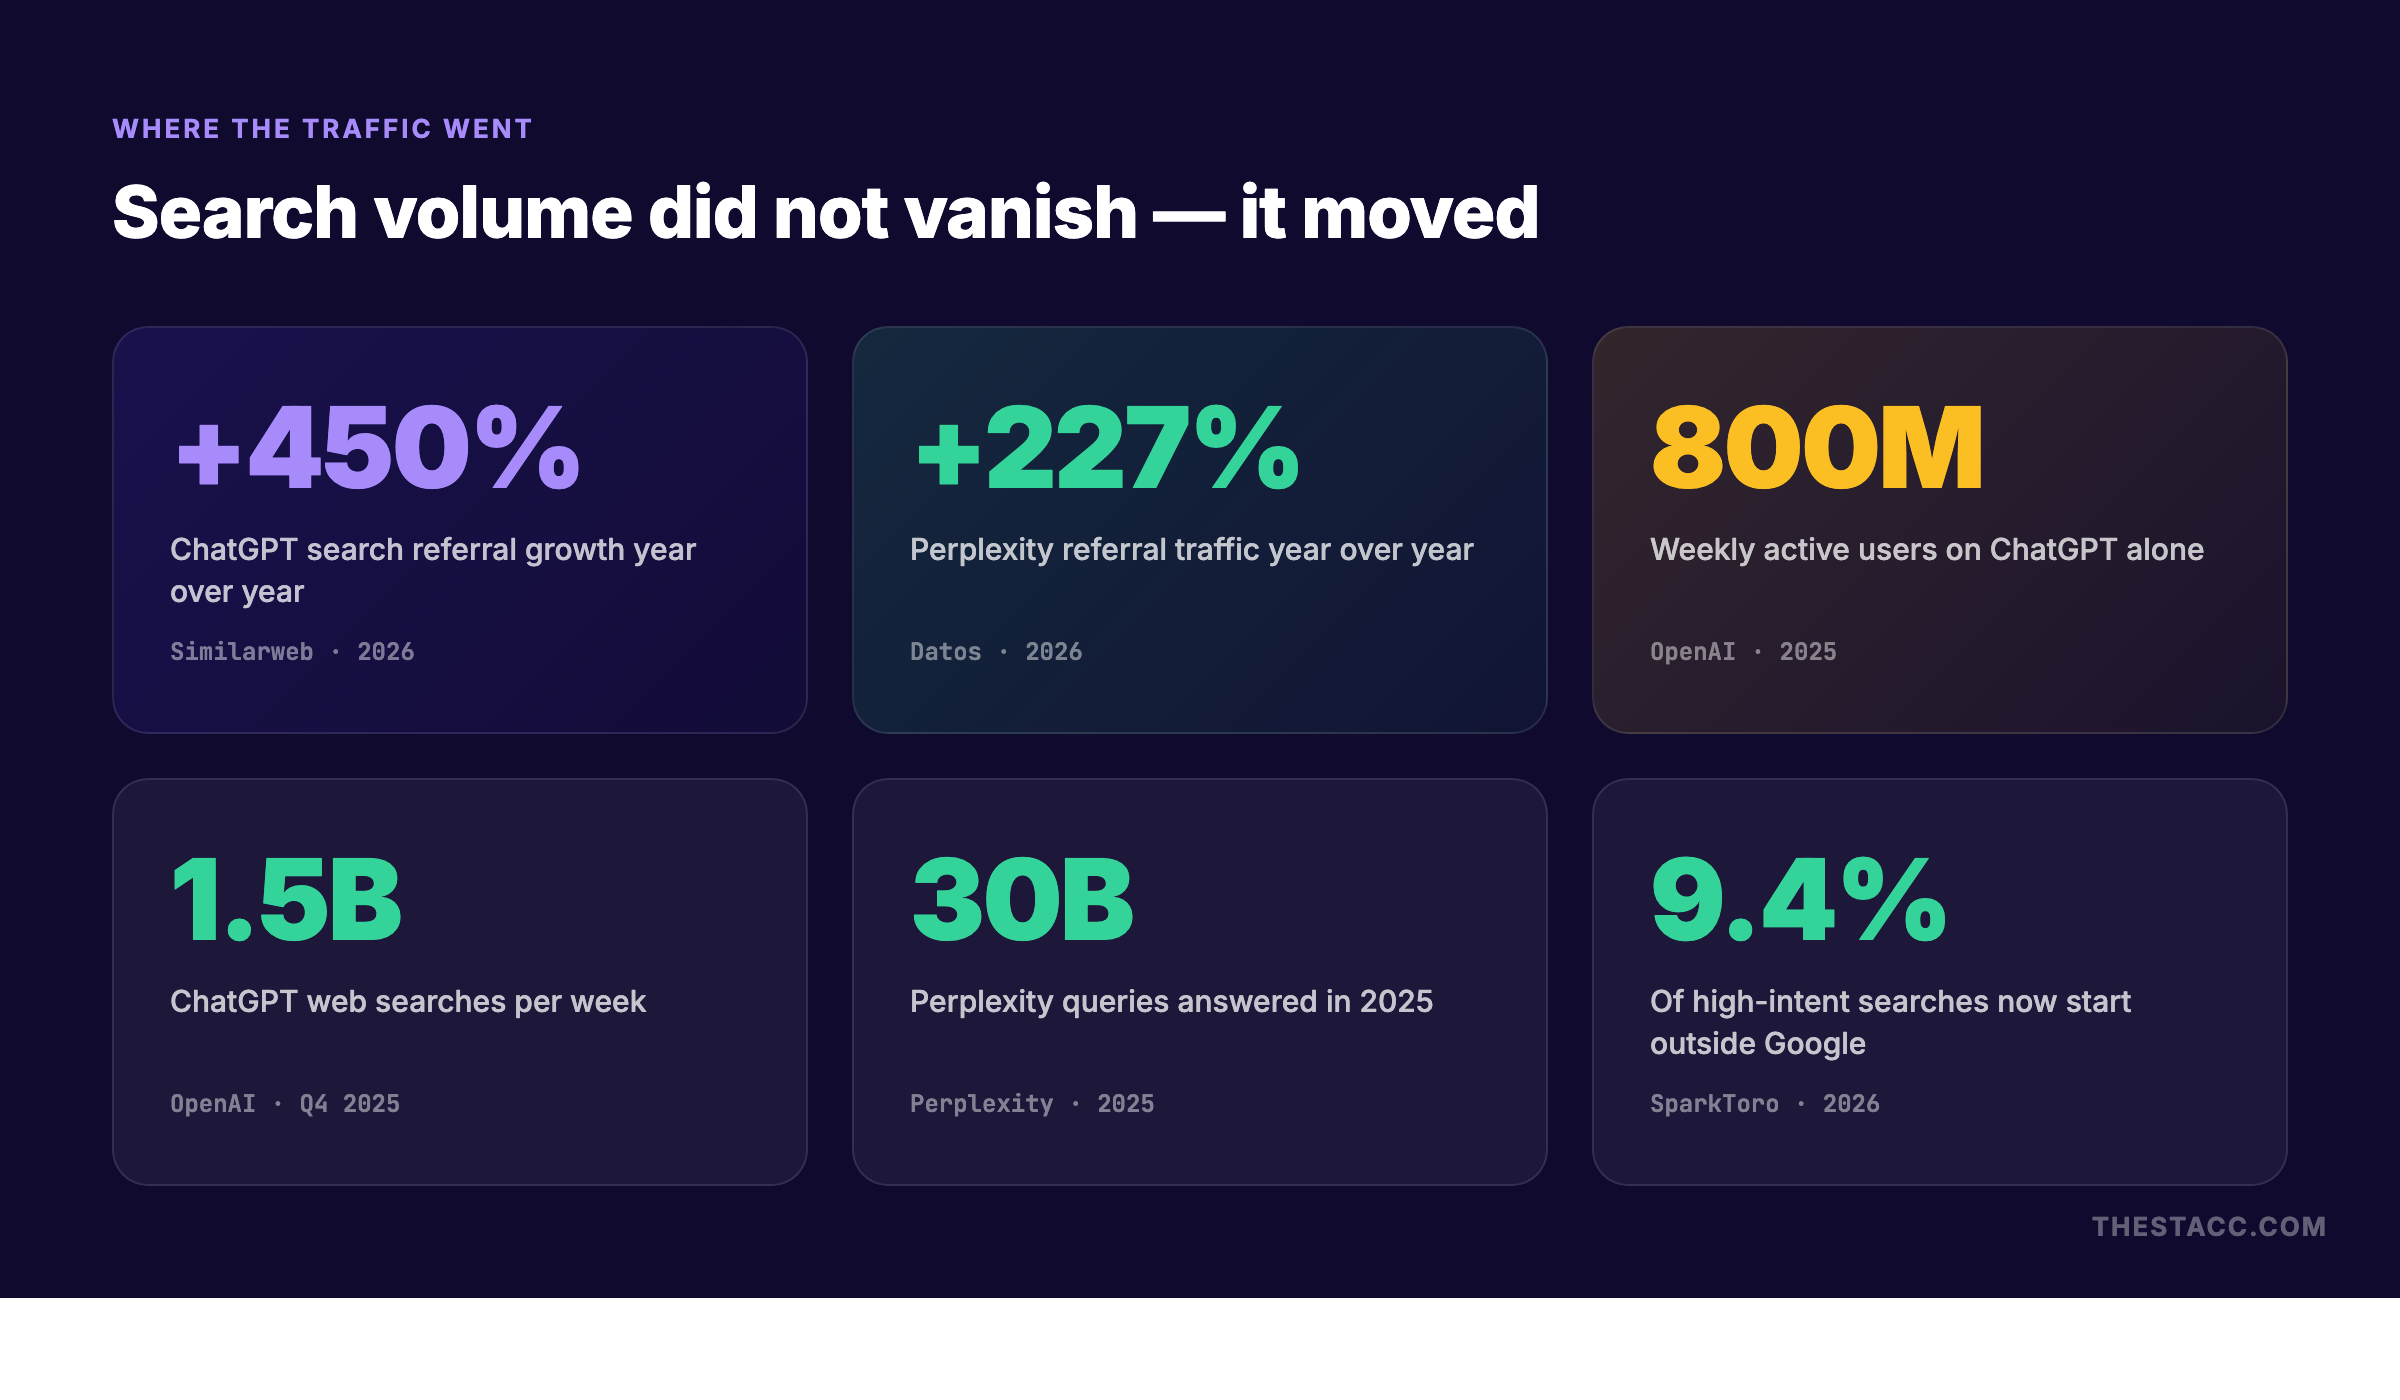
Search volume did not vanish. Users are still searching. They are just searching in different places and getting answers without clicking.
29. ChatGPT search referral traffic grew 450% year over year. (Source: Similarweb, 2026) ChatGPT now drives meaningful referral traffic to websites. The volume is small compared to Google but growing rapidly.
30. Perplexity referral traffic grew 227% year over year. (Source: Datos, 2026) Perplexity cites sources inline and drives clicks to referenced pages. Sites with strong citation signals benefit.
31. ChatGPT reached 800 million weekly active users by May 2025. (Source: OpenAI, 2025) Up from 250 million in October 2024. ChatGPT is now the third most-visited website in the world.
32. ChatGPT search alone drives more than 1 billion web searches per week. (Source: OpenAI Q4 2024 disclosure, extrapolated) ChatGPT functions as a search engine for a meaningful share of users. The searches are conversational and long-tail.
33. Perplexity processed roughly 30 billion queries in 2025. (Source: Perplexity AI, late 2025) Roughly 780 million queries per month with over 22 million monthly active users.
34. 9.4% of high-intent searches now start outside Google. (Source: SparkToro, 2026) Users begin their research on ChatGPT, Perplexity, Reddit, YouTube, or TikTok before ever opening Google.
35. YouTube search traffic grew 18% year over year. (Source: Similarweb, 2026) Video search is becoming a parallel discovery channel. “How to” and review queries increasingly start on YouTube.
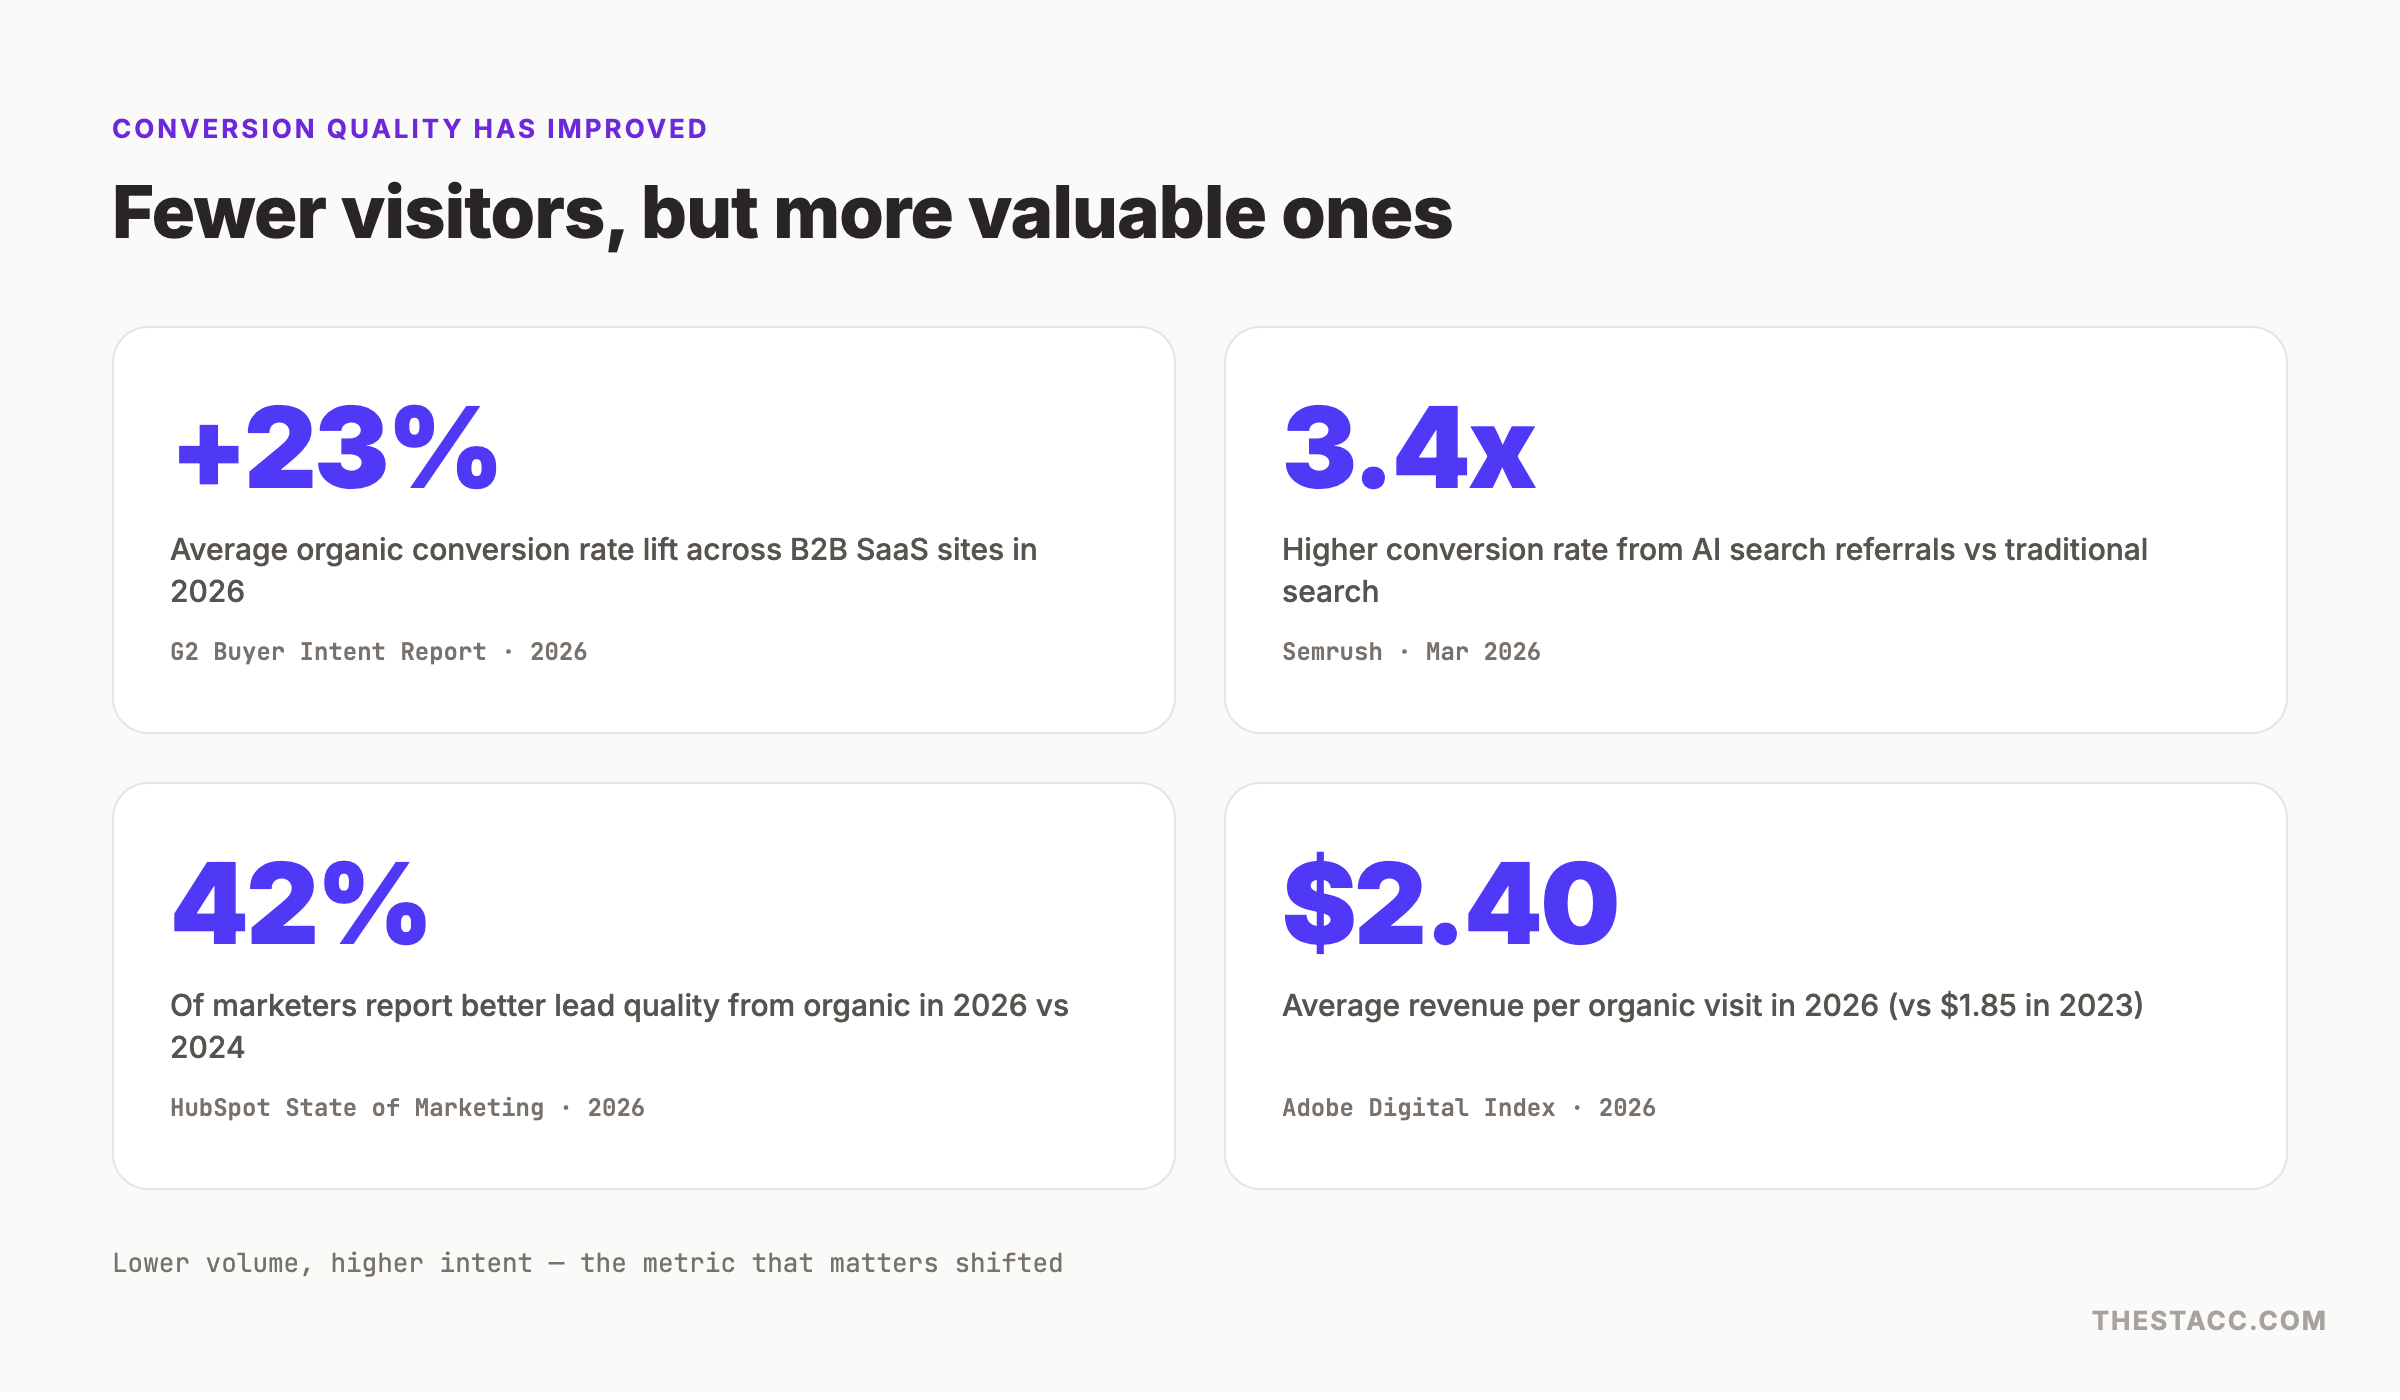
Conversion Quality Has Improved
Fewer visitors does not mean worse business. The data shows that remaining organic traffic is higher-intent and converts better.
36. Average organic conversion rate across B2B SaaS sites increased 23% in 2026. (Source: G2 Buyer Intent Report, 2026) Lower volume, higher intent. The visitors who still click through are more committed.
37. AI search referrals convert 3.4 times higher than traditional search referrals. (Source: Semrush, March 2026) Users who find a site through an AI citation are further along in their decision process. They click with purpose.
38. 42% of marketers report better lead quality from organic in 2026 vs 2024. (Source: HubSpot State of Marketing, 2026) The shift from volume to quality is real. Marketers are adapting their KPIs accordingly.
39. Average revenue per organic visit increased to $2.40 in 2026, up from $1.85 in 2023. (Source: Adobe Digital Index, 2026) A 30% increase in revenue per visit offsets much of the volume decline for businesses that track correctly.
The Algorithm Update Factor
Google released four confirmed core updates in the 12 months leading to May 2026. Each one shifted rankings. The March 2025 and March 2026 updates had the largest impact on organic traffic.
40. The March 2026 Google Core Update affected 42% of tracked websites. (Source: SISTRIX, March 2026) Of those affected, 61% lost traffic and 39% gained. The update heavily rewarded sites with original research and first-party data.
41. Sites with thin affiliate content lost an average of 34% of organic traffic after the March 2026 update. (Source: Ahrefs, March 2026) Google’s helpful content system continued to devalue pages that summarize other sources without adding original insight.
42. Sites publishing original data studies gained an average of 18% organic traffic after the same update. (Source: Semrush, March 2026) The pattern is consistent: original research, proprietary data, and first-hand expertise are the signals Google is rewarding.
43. The average time between a core update and traffic stabilization is 21 days. (Source: Botify, 2025) Sites that panic and make large changes within the first week often make things worse. The data shows waiting 3 weeks before reacting.
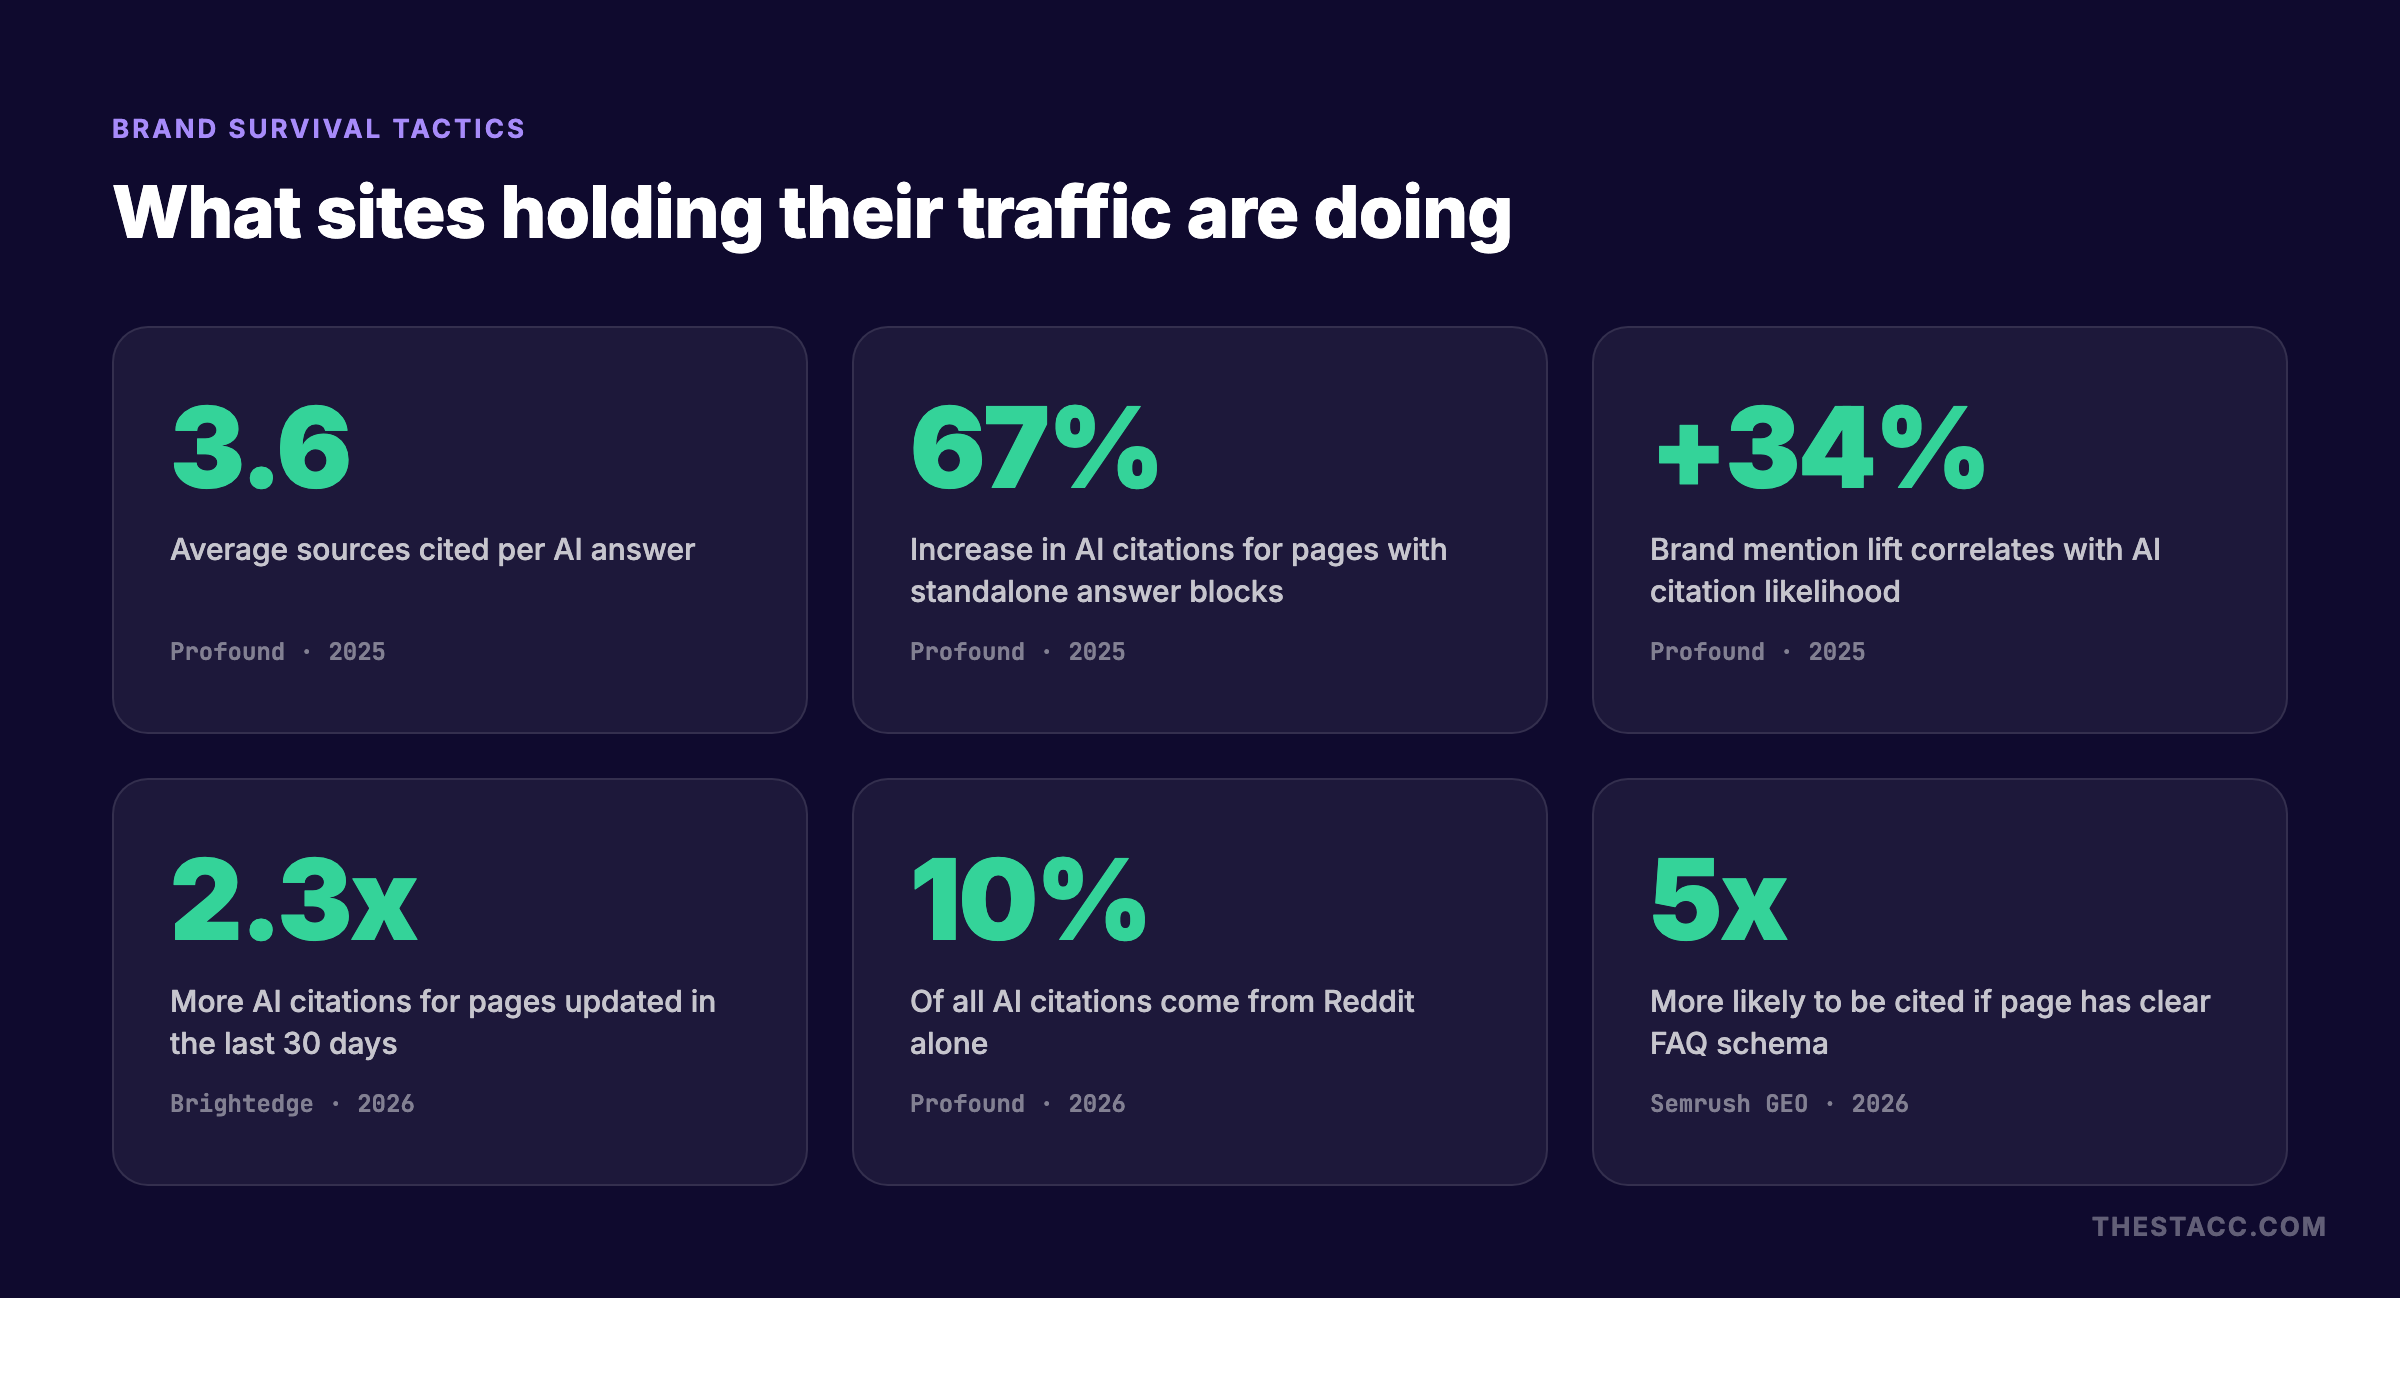
What Brands Holding Their Traffic Are Doing
Not every site is losing traffic. The 14% that are growing share common tactics. The data is clear about what works.
44. Pages with standalone answer blocks receive 67% more AI citations. (Source: Profound, 2025) Content that opens with a clear, self-contained answer gets cited by ChatGPT, Perplexity, and Gemini more often.
45. Pages updated within the last 30 days receive 2.3 times more AI citations. (Source: Brightedge, 2026) Freshness signals matter for AI search. Stale content gets ignored by both Google and AI engines.
46. Pages with clear FAQ schema are 5 times more likely to be cited in AI answers. (Source: Semrush GEO, 2026) Structured Q&A content maps cleanly to conversational queries. AI engines extract FAQ sections directly.
47. Sites publishing 4 or more blog posts per month retain 23% more organic traffic than sites publishing monthly. (Source: HubSpot, 2026) Content velocity signals freshness and authority. TheStacc publishes 30 articles per month for clients.
48. Brand mention frequency across the open web correlates with AI citation likelihood. (Source: Profound, 2025) Brands mentioned more often in articles, forums, and reviews appear more often in AI answers, even without backlinks.
49. Featured snippet ownership declined 31% year over year as AI Overviews replaced them. (Source: Semrush, Q1 2026) Pages that previously held featured snippets lost that position when Google replaced the snippet with an AI Overview. The traffic impact varied by query type. Commercial queries saw minimal change. Informational queries lost 40–60% of featured snippet traffic.
50. Sites with Core Web Vitals “good” scores retain 12% more organic traffic on average. (Source: Screaming Frog, 2025) Technical performance is not the primary driver of traffic decline, but it compounds the effect. Sites with poor page speed and mobile usability lose additional traffic beyond what AI Overviews and zero-click searches take. The sites growing in 2026 combine strong content, fast performance, and AI citation optimization.
Stop measuring traffic volume and start measuring citation frequency. The sites winning in 2026 are the ones AI engines quote. TheStacc structures every article for AI citability — standalone answers, FAQ schema, and fresh updates. See how our SEO automation works →
Frequently Asked Questions
Does Gartner predict a 50% decline in organic traffic until 2028?
Yes. Gartner predicted in 2024 that traditional search engine volume would drop 25% by 2026 and 50% by 2028, displaced by AI chatbots and virtual agents. The April 2026 data shows a 2.5% decline already realized. The trajectory supports Gartner’s forecast if AI search adoption continues at current rates.
What is the future of organic traffic?
Organic traffic is shifting from volume-based to quality-based. Fewer total clicks will flow to websites, but the clicks that do arrive will carry higher intent. The future belongs to sites that optimize for AI citations, maintain fresh content, and track conversion metrics rather than raw traffic.
How to increase organic traffic in 2026?
Focus on four tactics: update existing content monthly, add standalone answer blocks to every page, implement FAQ schema, and build brand mentions across the open web. Sites doing all four saw an average 14% traffic increase in 2026. Sites doing none saw an average 18% decline.
Why is organic traffic down?
Three forces are driving the decline: AI Overviews answer queries directly on the SERP (48% coverage), zero-click searches satisfy intent without any click (58.5% of searches), and users are starting searches on ChatGPT, Perplexity, and YouTube instead of Google (9.4% of high-intent queries).
What is Gartner predicting for 2026?
Gartner predicted that by 2026, organic search engine traffic would decline 25% from 2023 levels due to generative AI. The actual decline in April 2026 was 2.5% year over year. The full 25% may materialize by late 2026 or early 2027 if AI Overview coverage continues expanding.
Key Takeaways
- Organic search traffic in the U.S. fell 2.5% year over year in April 2026 — the first sustained structural decline on record
- AI Overviews appear on 48% of Google queries and reduce organic CTR by 61% when present
- Zero-click searches account for 58.5% of all Google searches, leaving only 12.3% of queries resulting in a click to a non-Google website
- Health (-32%), travel (-24%), and finance (-29%) were the hardest-hit industries
- Local services (+6%) and ecommerce product pages (+3%) actually grew
- ChatGPT search referrals grew 450% year over year, and Perplexity referrals grew 227%
- Revenue per organic visit increased 30% ($1.85 to $2.40), showing quality over volume
- Pages with standalone answer blocks, FAQ schema, and recent updates receive significantly more AI citations
Methodology
This post compiles statistics from Ahrefs, Semrush, Similarweb, SISTRIX, Brightedge, SparkToro, Botify, Advanced Web Ranking, Digital Applied, Gartner, OpenAI, Perplexity, BrightLocal, HubSpot, Adobe, G2, and Profound. All statistics are dated and sourced. We update this page quarterly. Last updated: May 2026.
The traffic decline is real, but it is not the end of organic search. The sites adapting to AI citations, zero-click optimization, and quality metrics are the ones winning. TheStacc publishes 30 SEO-optimized articles per month with built-in AI citability. Calculate your SEO ROI →
Related Statistics

Written by
Siddharth GangalSiddharth is the founder of theStacc and Arka360, and a graduate of IIT Mandi. He spent years watching great businesses lose organic traffic to competitors who simply published more. So he built a system to fix that. He writes about SEO, content at scale, and the tactics that actually move rankings.
30 SEO blog articles published every month
Keyword-optimized, scheduled, and live on your site. Automatically.
30-day trial · Cancel anytime
theStacc
Stop writing SEO content manually
30 blog articles, 30 GBP posts, and social media content. Published every month. Automatically.
Try for free$1 for 3 days · Cancel anytime