Core Web Vitals Statistics: 43% Fail INP in 2026
55 Core Web Vitals statistics for 2026. Pass rates, INP failures, LCP and CLS data, mobile vs desktop, ranking impact, and CMS benchmarks compared.
Last updated: May 2026
43% of websites still fail the 200ms INP threshold in 2026. Interaction to Next Paint replaced First Input Delay in March 2024, and it is the hardest Core Web Vital to pass. Mobile pass rates trail desktop by 7 percentage points, and only 47% of sites meet all three thresholds at once.
Most performance decisions are made on hunch. Engineers ship a build. Marketers wait. Pagespeed scores wobble. Nobody can say what is normal, what is good, or what is worth fixing first.
The data below settles that argument. Every number is sourced from the Chrome User Experience Report, the HTTP Archive Web Almanac, Google Search Central, or peer-reviewed industry studies. Every stat is dated. Every number is current as of May 2026.
We publish 3,500+ blogs across 70+ industries at Stacc. Performance is a tie-breaker in competitive niches, and these are the Core Web Vitals statistics that shape how we build sites that rank.
Here is what the numbers show:
- Global Core Web Vitals Pass Rate Statistics (8 stats)
- INP Statistics: Interaction to Next Paint (7 stats)
- LCP Statistics: Largest Contentful Paint (7 stats)
- CLS Statistics: Cumulative Layout Shift (6 stats)
- Mobile vs Desktop Core Web Vitals (6 stats)
- Core Web Vitals and SEO Rankings (7 stats)
- Industry and CMS Benchmarks (8 stats)
- Business Impact of Core Web Vitals (6 stats)
- Frequently Asked Questions
- Key Takeaways
Global Core Web Vitals Pass Rate Statistics
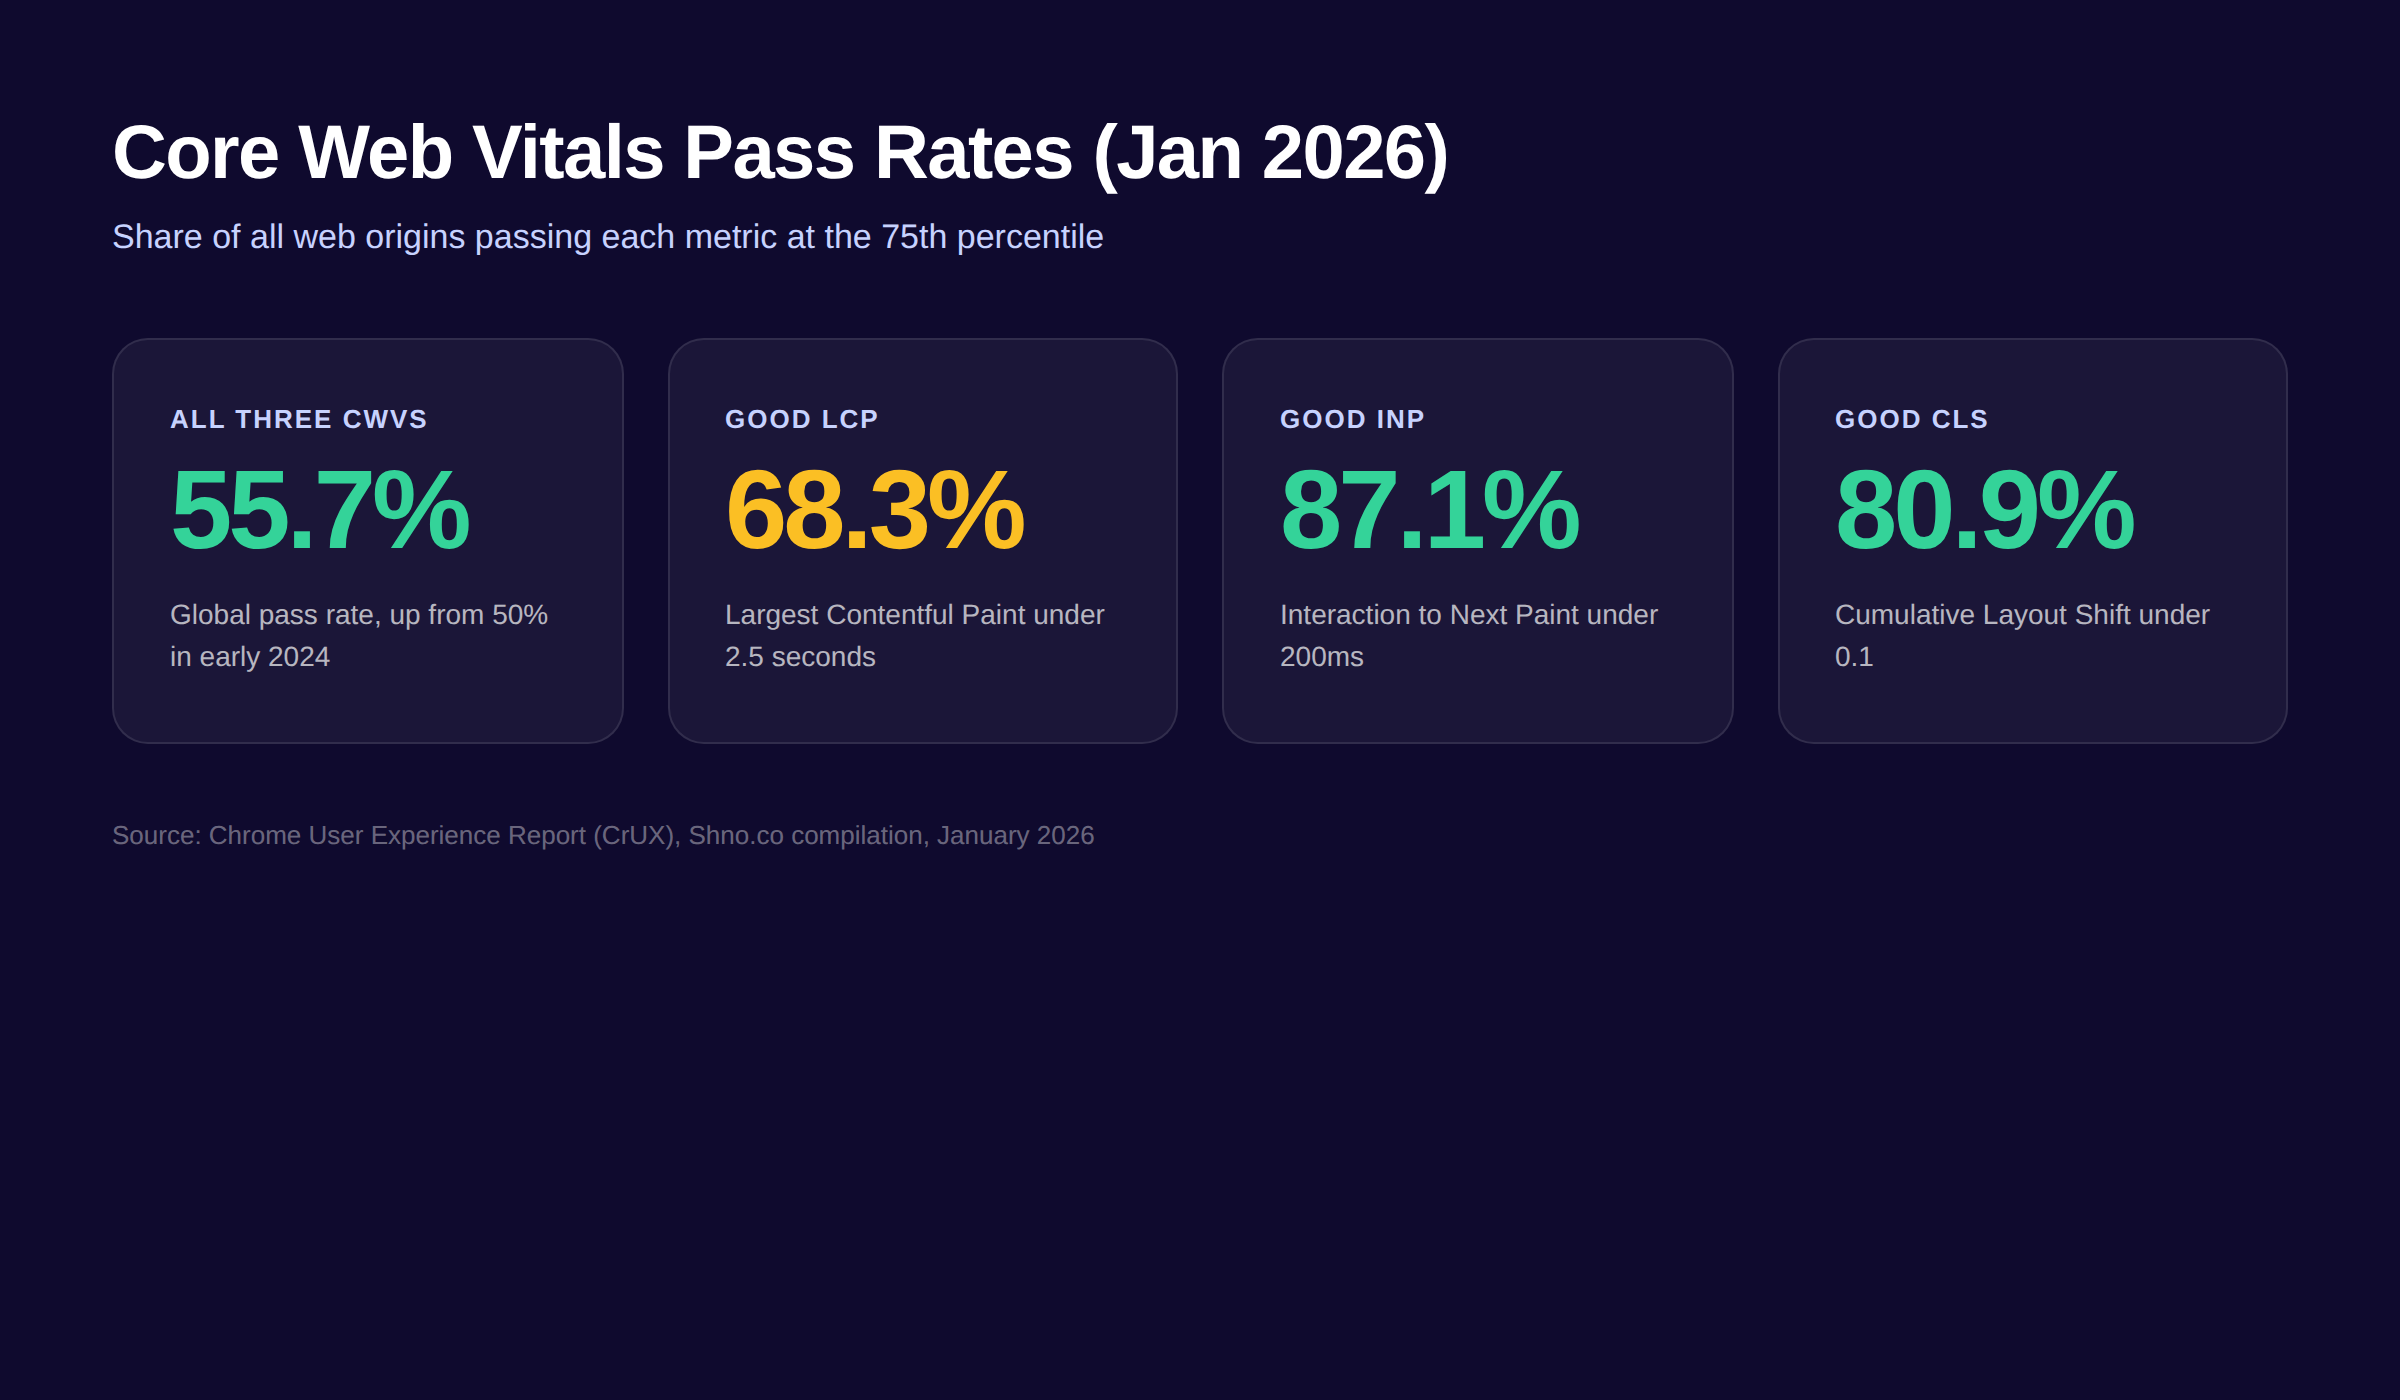
The headline number for 2026 is 55.7%. That is the share of all web origins that pass every Core Web Vital. The rest do not. The pass rate has climbed every year since Google launched these metrics in 2020, yet the majority of the open web still fails at least one threshold.
1. 55.7% of all web origins globally pass all three Core Web Vitals thresholds in January 2026. That is up from roughly 50% in early 2024 and 36% in 2022. (Source: Shno.co / CrUX, 2026)
2. 53% of origins in the Chrome User Experience Report passed all three Core Web Vitals in September 2025. This number tracks LCP, INP, and CLS together at the 75th percentile. (Source: Addy Osmani via CrUX, 2025)
3. 43.9% of origins had good Core Web Vitals immediately after INP replaced FID in February 2024. That number recovered to over 50% within 12 months as sites optimized for the new metric. (Source: Chrome DevRel / CrUX, 2024)
4. 47% of sites pass all three Core Web Vitals on the stricter “good” thresholds. The remaining 53% miss at least one metric, with INP and LCP the most common failures. (Source: Web Almanac 2025, 2025)
5. Only 21.98% of all origins meet Core Web Vitals when measured against every page type. This includes home pages, product pages, and deep secondary pages combined. (Source: HostingStep / CrUX, 2025)
6. 88% of the 42 million URLs Ahrefs analyzed lacked enough CrUX data to receive a ranking signal. Most of the web is too low-traffic for field data to register. (Source: Whitehat SEO / Ahrefs, 2025)
7. Pass rates dropped 0.4 percentage points the day CrUX switched from FID to INP in March 2024. Many sites that passed FID failed INP because INP measures every interaction, not just the first. (Source: Chrome Developers, 2024)
8. As of March 2026, Google evaluates Core Web Vitals at the origin level, not just the page level. Domain-wide failures can drag down rankings even for pages that individually pass. (Source: Google Search Central, 2026)
For the full ranking factor picture, read our breakdown of Google ranking factors.
INP Statistics: Interaction to Next Paint
INP is the metric that broke most sites in 2024. Where FID measured only the first input delay, INP measures every click, tap, and keypress across the entire user session. The “good” threshold is 200 milliseconds. The “poor” threshold is 500 milliseconds. Most JavaScript-heavy sites land in the middle.
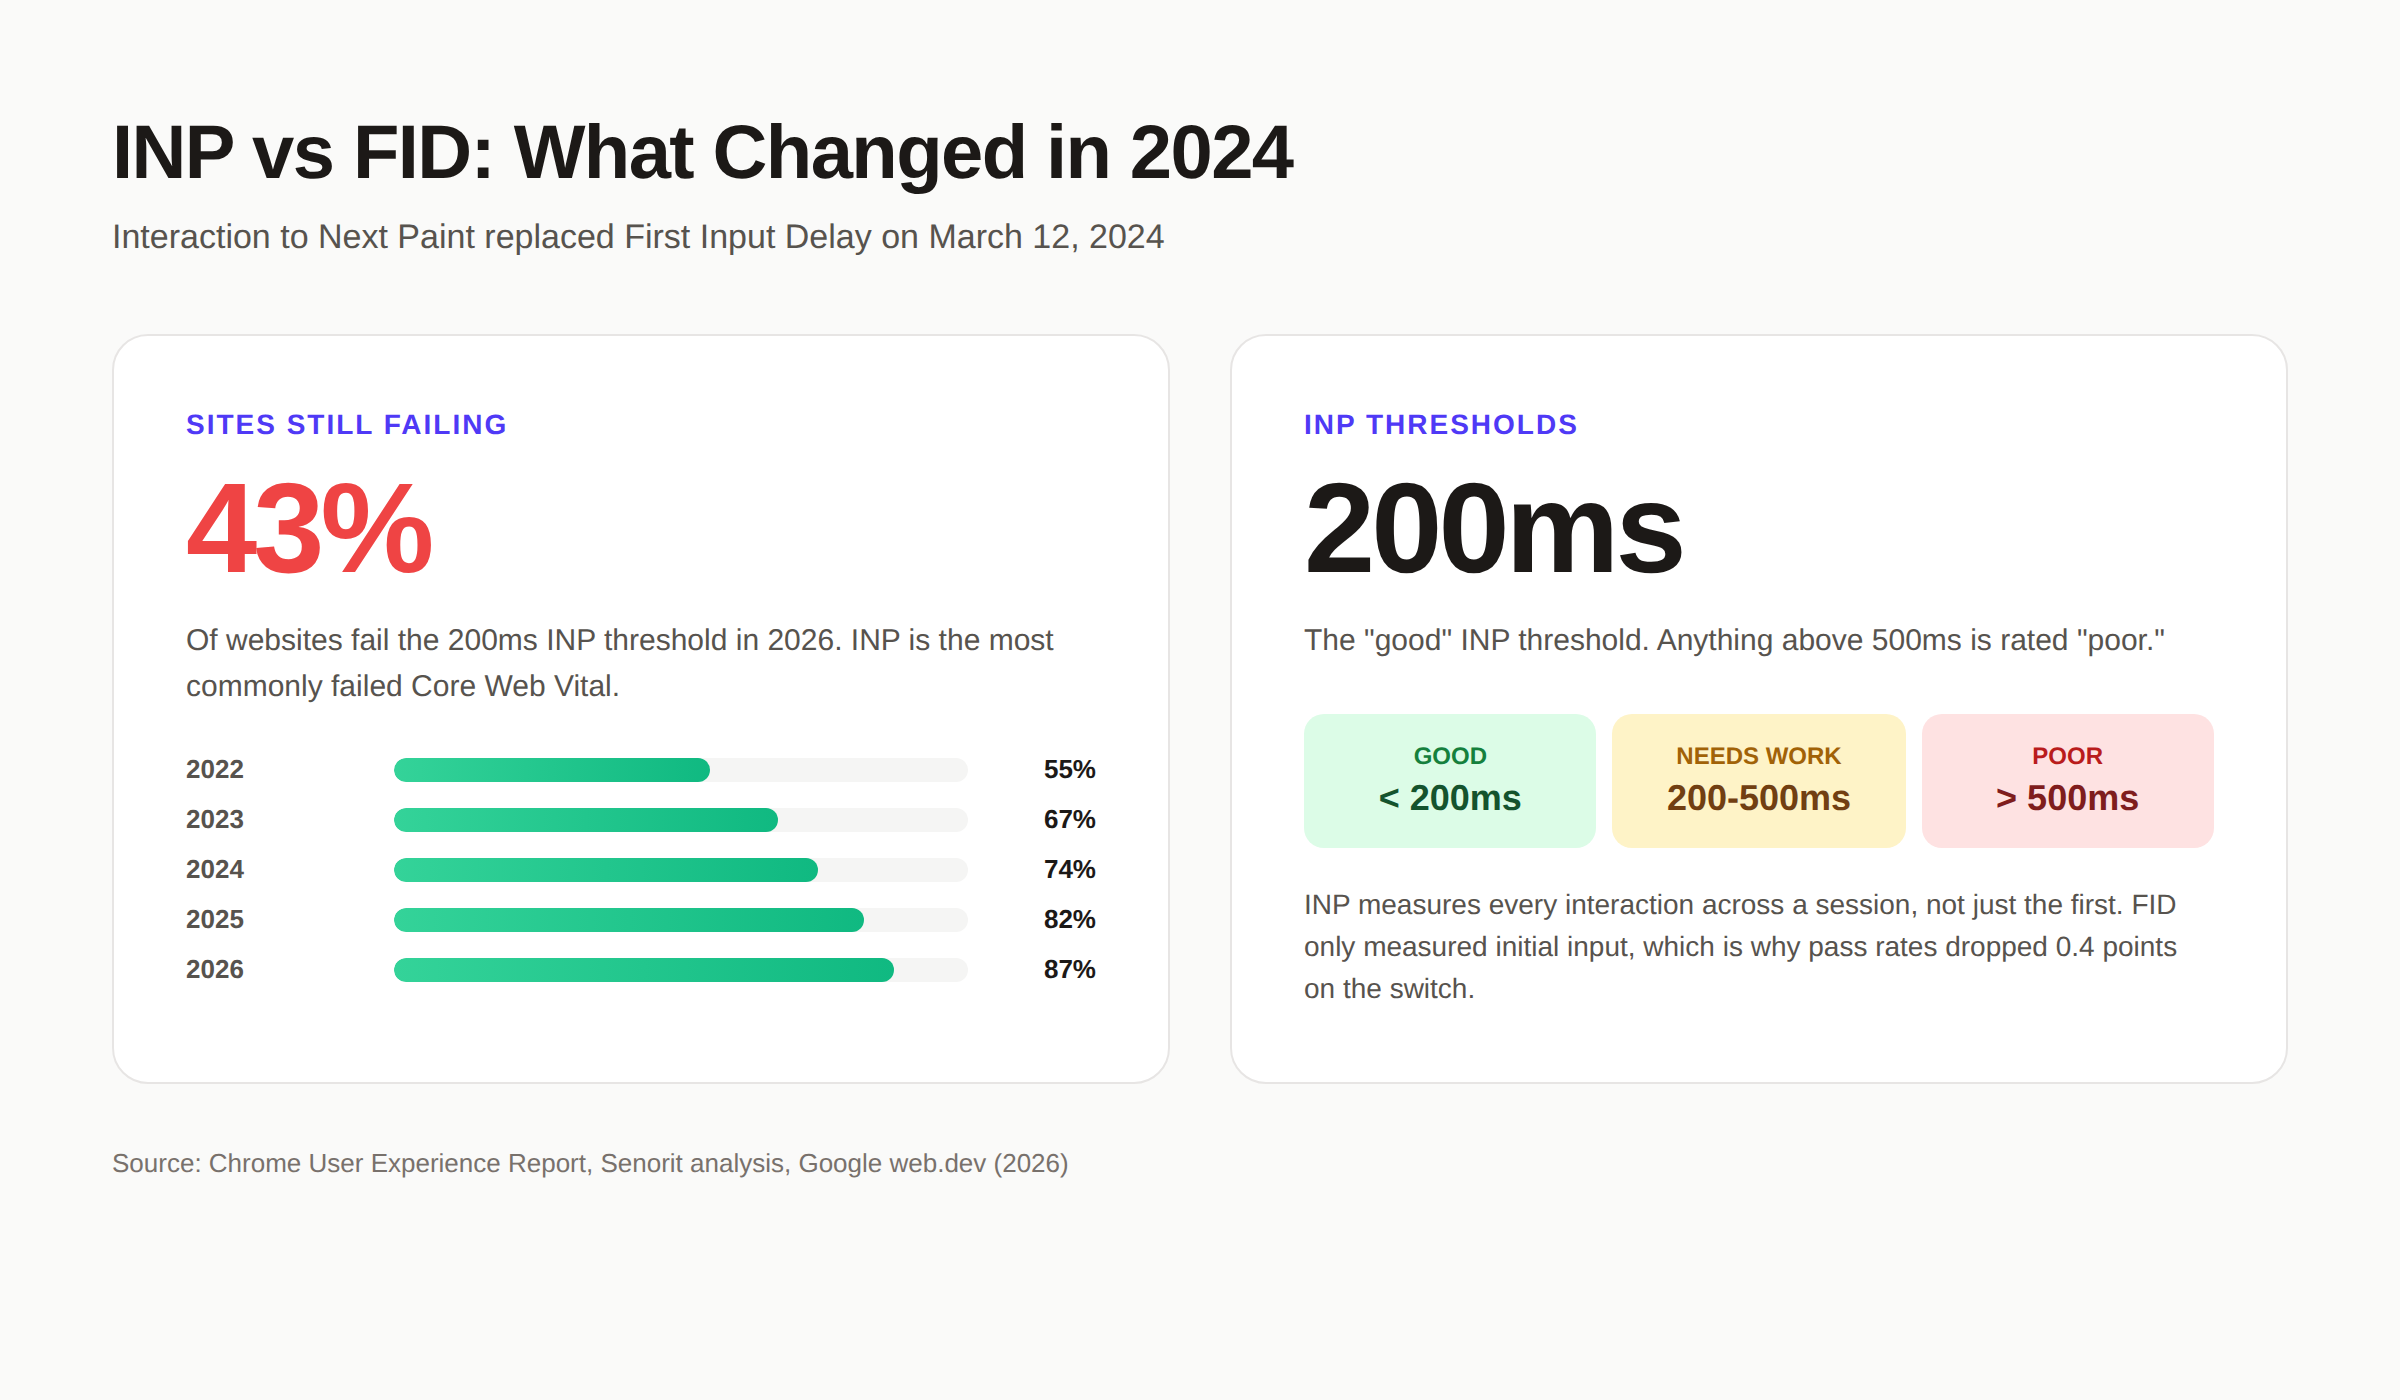
9. 43% of websites still fail the 200ms INP threshold in 2026. INP is now the most commonly failed Core Web Vital across the open web. (Source: Senorit / CrUX, 2026)
10. INP officially replaced FID on March 12, 2024. First Input Delay was retired after 4 years as a Core Web Vital. (Source: Google / web.dev, 2024)
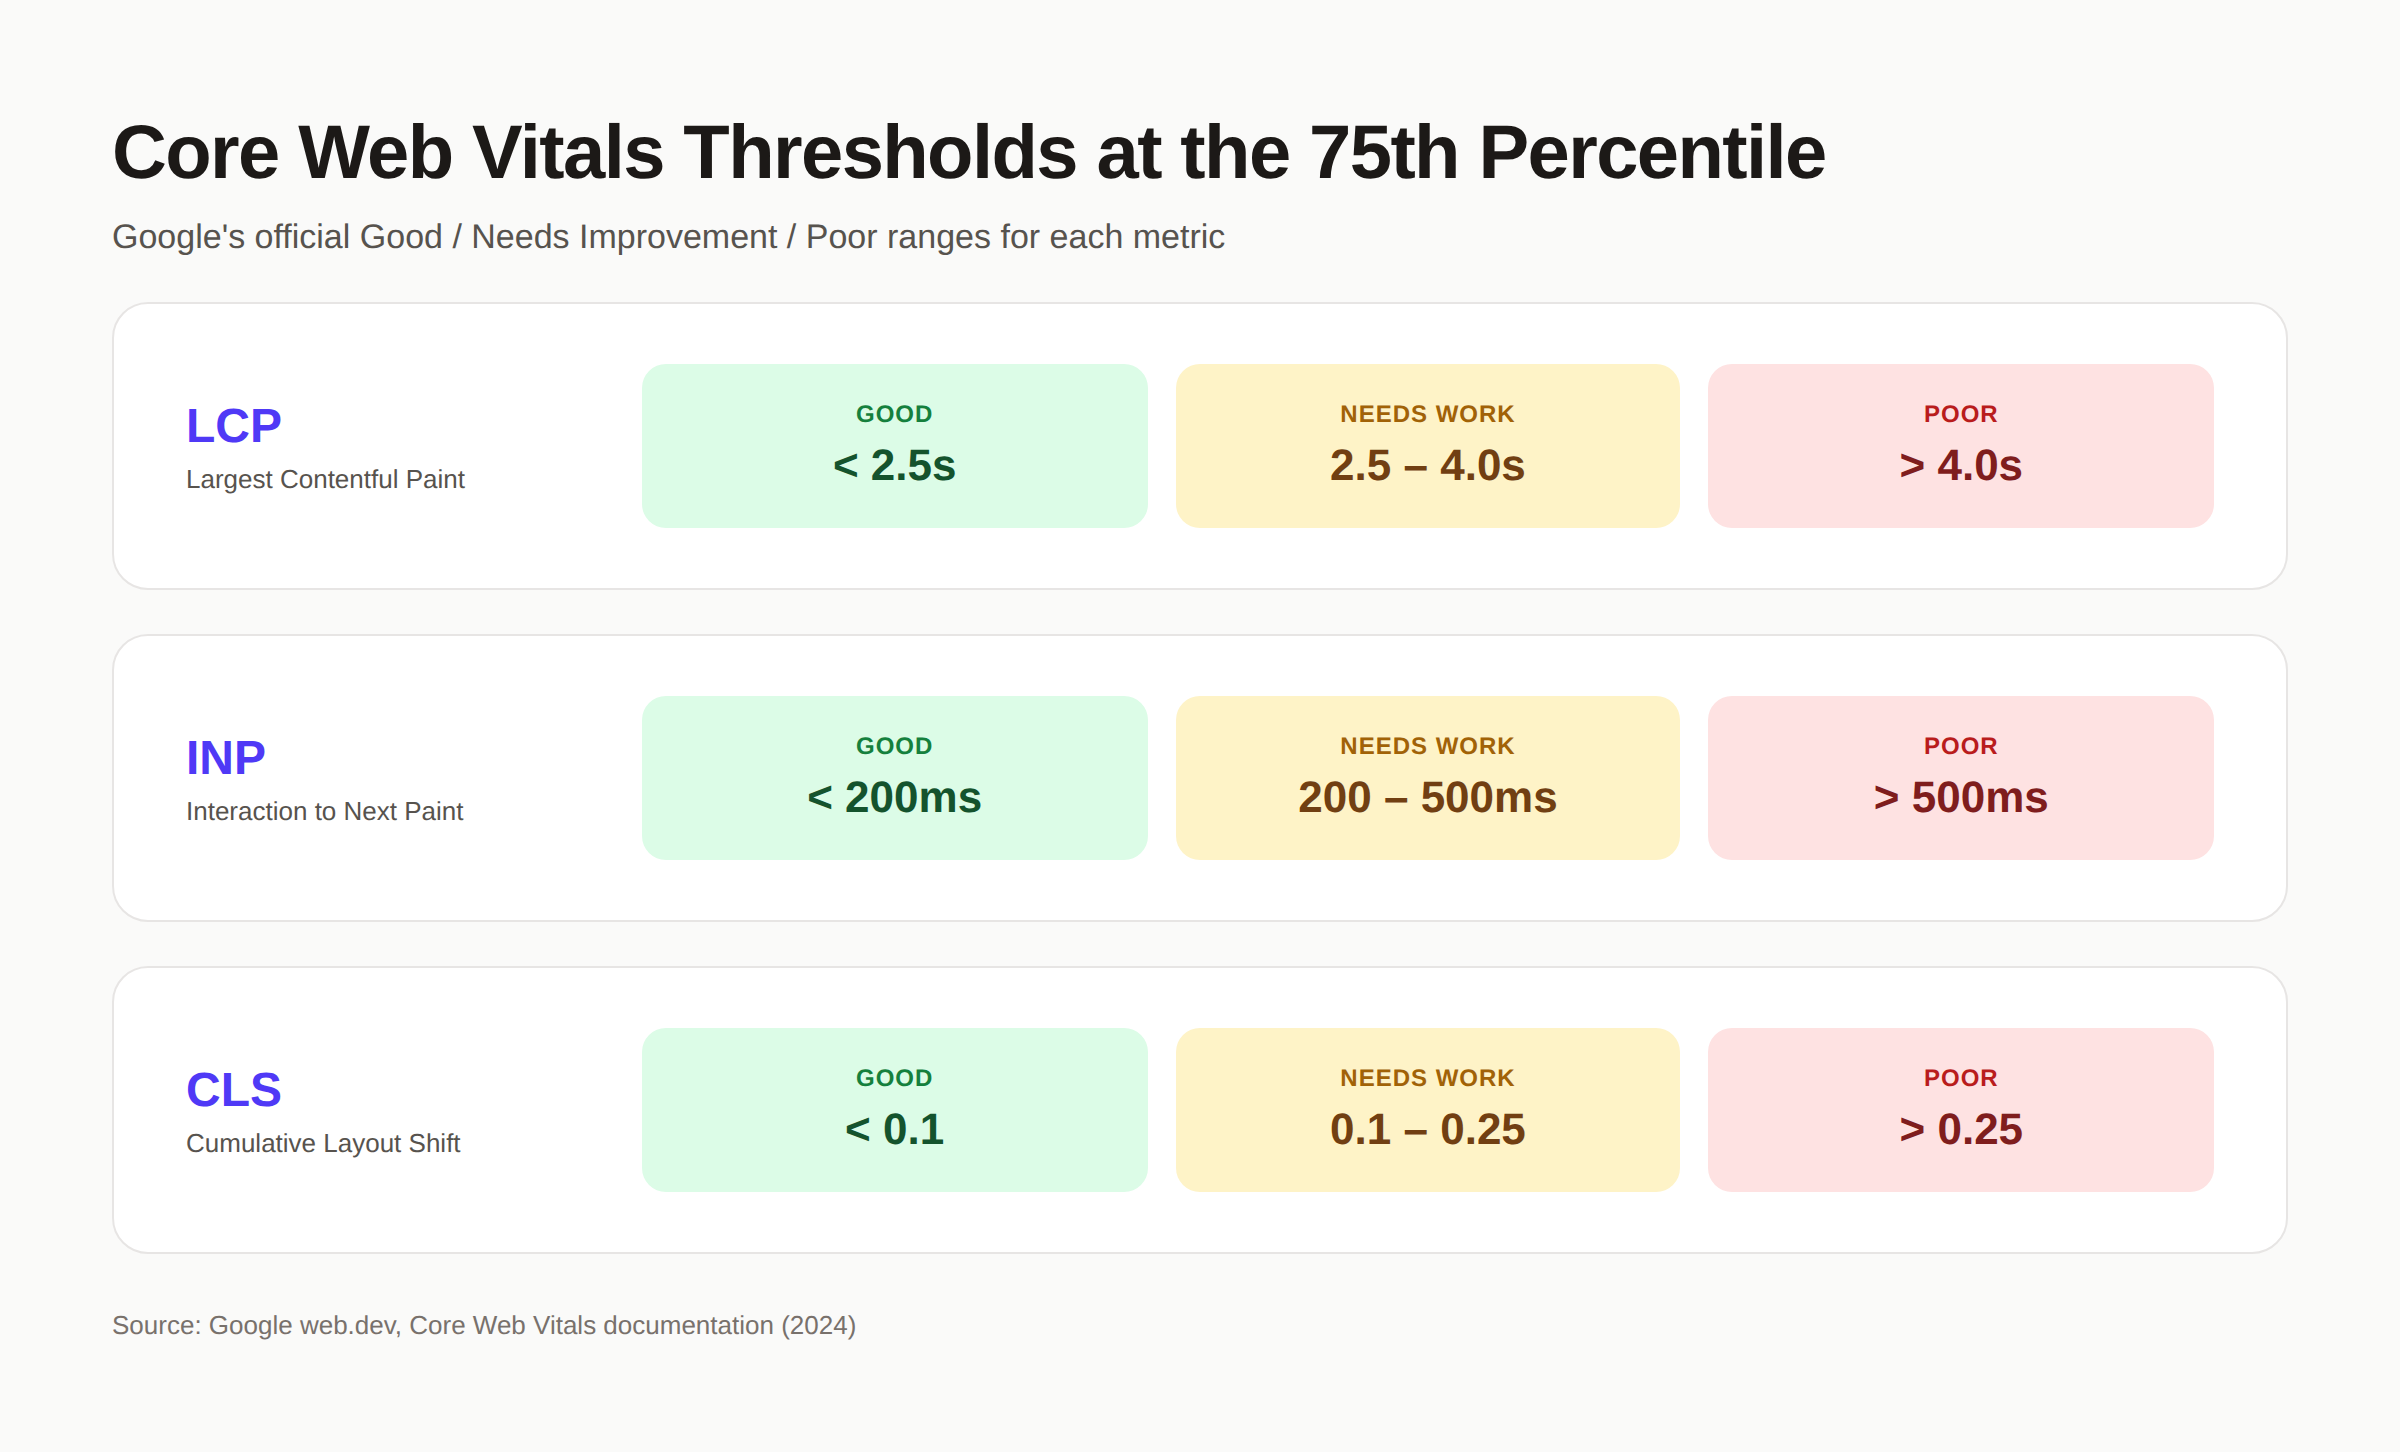
11. The “good” INP threshold is 200 milliseconds. Anything above 500ms is rated “poor” and anything between is “needs improvement.” (Source: Google / web.dev, 2024)
12. 87.1% of web origins globally have good INP scores in January 2026. Despite the difficulty, most pages clear the threshold once basic JavaScript optimization is applied. (Source: Shno.co / CrUX, 2026)
13. Mobile INP pass rates rose from 55% to 74% between 2022 and 2024. Sites adapted quickly once Google announced the FID-to-INP transition. (Source: HTTP Archive Web Almanac, 2024)
14. JavaScript-heavy frameworks score the worst on INP. Sites built on React, Angular, and Vue often fail INP due to long tasks blocking the main thread. (Source: HTTP Archive Web Almanac 2024, 2024)
15. WordPress sites hit 85.89% good INP scores in mid-2025. That is higher than the overall WordPress pass rate, which is dragged down by LCP. (Source: Search Engine Journal, 2025)
For a deeper look at how scripts affect performance, see our guide to JavaScript SEO.
Stop guessing. Start ranking. Stacc publishes 30 SEO articles per month for $99. Every post ships optimized for Core Web Vitals at publish. Start for $1 →
LCP Statistics: Largest Contentful Paint
LCP is the metric that fails most often on mobile. It measures how quickly the largest visible element loads, usually the hero image or main heading. The “good” threshold is 2.5 seconds. Cheap hosting, unoptimized images, and render-blocking scripts are the biggest reasons sites miss it.
16. The “good” LCP threshold is 2.5 seconds. Anything above 4.0 seconds is rated “poor.” (Source: Google / web.dev, 2024)
17. 68.3% of web origins have good LCP scores globally in January 2026. That is the lowest of the three Core Web Vitals. (Source: Shno.co / CrUX, 2026)
18. LCP is the hardest Core Web Vital to pass according to DebugBear’s 2025 analysis. Significantly less than half of mobile sites pass LCP cleanly. (Source: DebugBear, 2025)
19. Only 54% of mobile pages pass LCP on WordPress. Desktop fares better at 67%. The 13-point gap is the widest of any platform. (Source: HostingStep / CrUX, 2025)
20. The median LCP for mobile pages is 2.6 seconds. That is just above the “good” threshold of 2.5 seconds. (Source: HTTP Archive Web Almanac, 2024)
21. Images cause 71% of LCP elements on the web. The single largest opportunity for LCP improvement is image optimization. (Source: HTTP Archive Web Almanac, 2024)
22. B2B websites have an average mobile LCP of 7.05 seconds. That is nearly 3x Google’s 2.5-second threshold. (Source: Whitehat SEO, 2025)
For tactics that cut LCP fast, see our page speed optimization guide.
CLS Statistics: Cumulative Layout Shift
CLS is the easiest Core Web Vital to pass once you know what to look for. It measures unexpected visual movement during page load. The “good” threshold is 0.1. Most failures come from images without dimensions, web fonts swapping in, or ads injecting content after the page renders.
23. The “good” CLS threshold is 0.1. Anything above 0.25 is rated “poor.” CLS is a unitless score, not a time measurement. (Source: Google / web.dev, 2024)
24. 80.9% of web origins have good CLS scores globally in January 2026. That makes CLS the second-easiest Core Web Vital to pass after INP. (Source: Shno.co / CrUX, 2026)
25. Mobile CLS pass rates beat desktop CLS pass rates. WordPress mobile scores 84% good CLS vs 71% on desktop, a rare 13-point reversal of the usual pattern. (Source: HostingStep / CrUX, 2025)
26. 70% of users cite visual stability as critical to trust. A jumpy page is the single biggest predictor of bounce. (Source: aTeam Soft Solutions, 2025)
27. CLS issues account for 30% of all Core Web Vitals failures on news sites. Ad injection and lazy-loaded content are the top causes. (Source: HTTP Archive Web Almanac, 2025)
28. Adding explicit width and height to images cuts CLS by an average of 0.05. That is half the budget for a good score on a single optimization. (Source: Google Search Central, 2024)
For a complete fix list, read our guide on how to improve Core Web Vitals.
Mobile vs Desktop Core Web Vitals
The mobile-desktop gap is one of the clearest patterns in CrUX data. Desktop almost always passes more often. The gap is widest on LCP and narrowest on INP. Phones run slower processors, weaker connections, and smaller viewports, which is why mobile-first design matters so much.
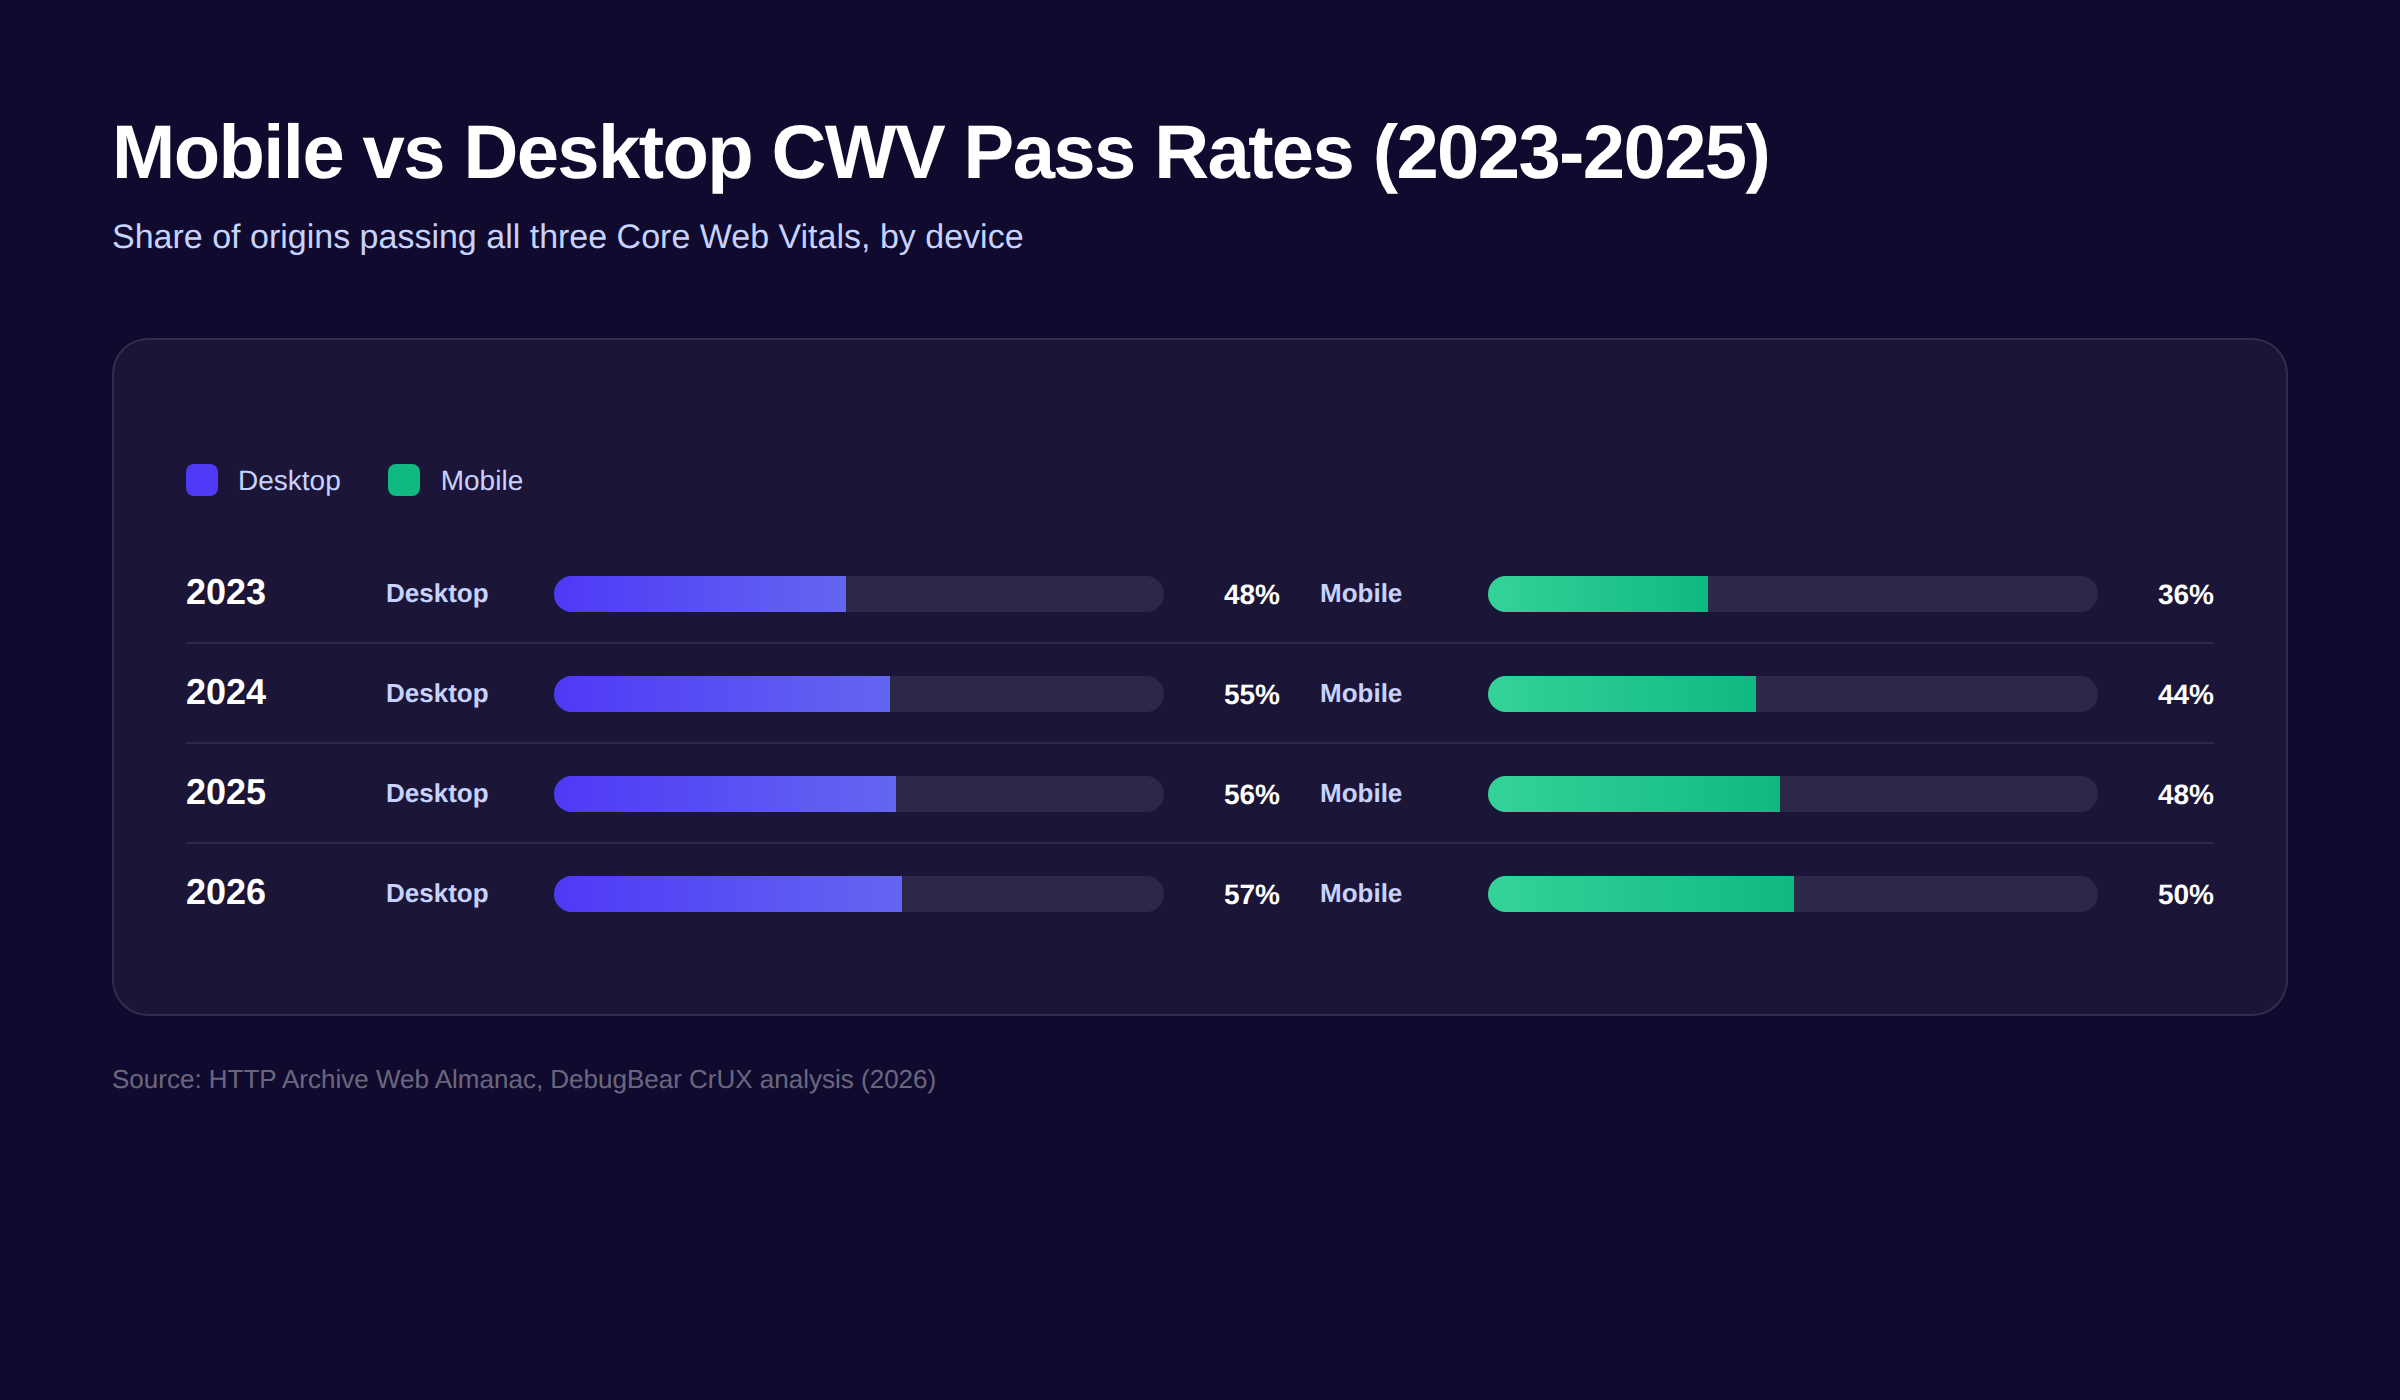
29. 57.1% of desktop origins pass Core Web Vitals vs 49.7% of mobile origins in 2025. The 7.4-point gap has narrowed from 12 points in 2023. (Source: DebugBear / HTTP Archive, 2026)
30. Mobile Core Web Vitals pass rates improved from 36% in 2023 to 48% in 2025. Annual gains have hovered around 6 percentage points. (Source: HTTP Archive Web Almanac, 2025)
31. Desktop Core Web Vitals pass rates improved from 48% in 2023 to 56% in 2025. Desktop gains have been smaller because the baseline was already higher. (Source: HTTP Archive Web Almanac, 2025)
32. 48% of mobile pages and 56% of desktop pages pass all three Core Web Vitals. Mobile remains the harder benchmark per the 2025 Web Almanac. (Source: CoreWebVitals.io / Web Almanac, 2025)
33. Median UK mobile page load is 1.8 seconds vs 1.6 seconds on desktop. The U.S. mobile median is 1.9 seconds vs 1.7 on desktop. (Source: HTTP Archive / Linkquest, 2025)
34. Mobile converts at 1.82% vs 3.90% on desktop despite carrying more traffic. Slow load times explain most of that conversion gap. (Source: Smart Insights / Omniconvert, 2025)
For a deeper dive on mobile performance, see our mobile SEO guide.
Core Web Vitals and SEO Rankings
Core Web Vitals are a confirmed Google ranking factor. The weight is small but real. In competitive niches, performance can be the tie-breaker between two sites with similar content authority. The numbers below quantify that impact.
35. Position 1 sites are 10% more likely to pass Core Web Vitals than position 9 sites. Speed correlates with ranking, though the cause-effect direction is debated. (Source: HostingStep, 2025)
36. Pages with LCP above 3 seconds lost 23% more traffic in the December 2025 core update. Performance penalties compound during algorithm shifts. (Source: Whitehat SEO, 2026)
37. 24% of top finance URLs in the U.S. would get a ranking boost from passing Core Web Vitals. Finance is the highest-impact vertical for performance optimization. (Source: HostingStep, 2025)
38. Less than 5% of education sites would receive a ranking boost from passing Core Web Vitals. The competitive moat in education is content, not speed. (Source: HostingStep, 2025)
39. UK search results have 70% good LCP scores. That is 4 points above the global average. (Source: HostingStep, 2025)
40. Sites where 40% or more of pages fail Core Web Vitals may face domain-wide ranking penalties. Google now evaluates performance at the origin level, not just per page. (Source: Google Search Central, 2026)
41. Core Web Vitals are a confirmed Google ranking factor since June 2021. Google folded them into the broader Page Experience update at that time. (Source: Google Search Central Blog, 2021)
For more on how Google ranks pages, read our complete guide to Google ranking factors.
Industry and CMS Benchmarks
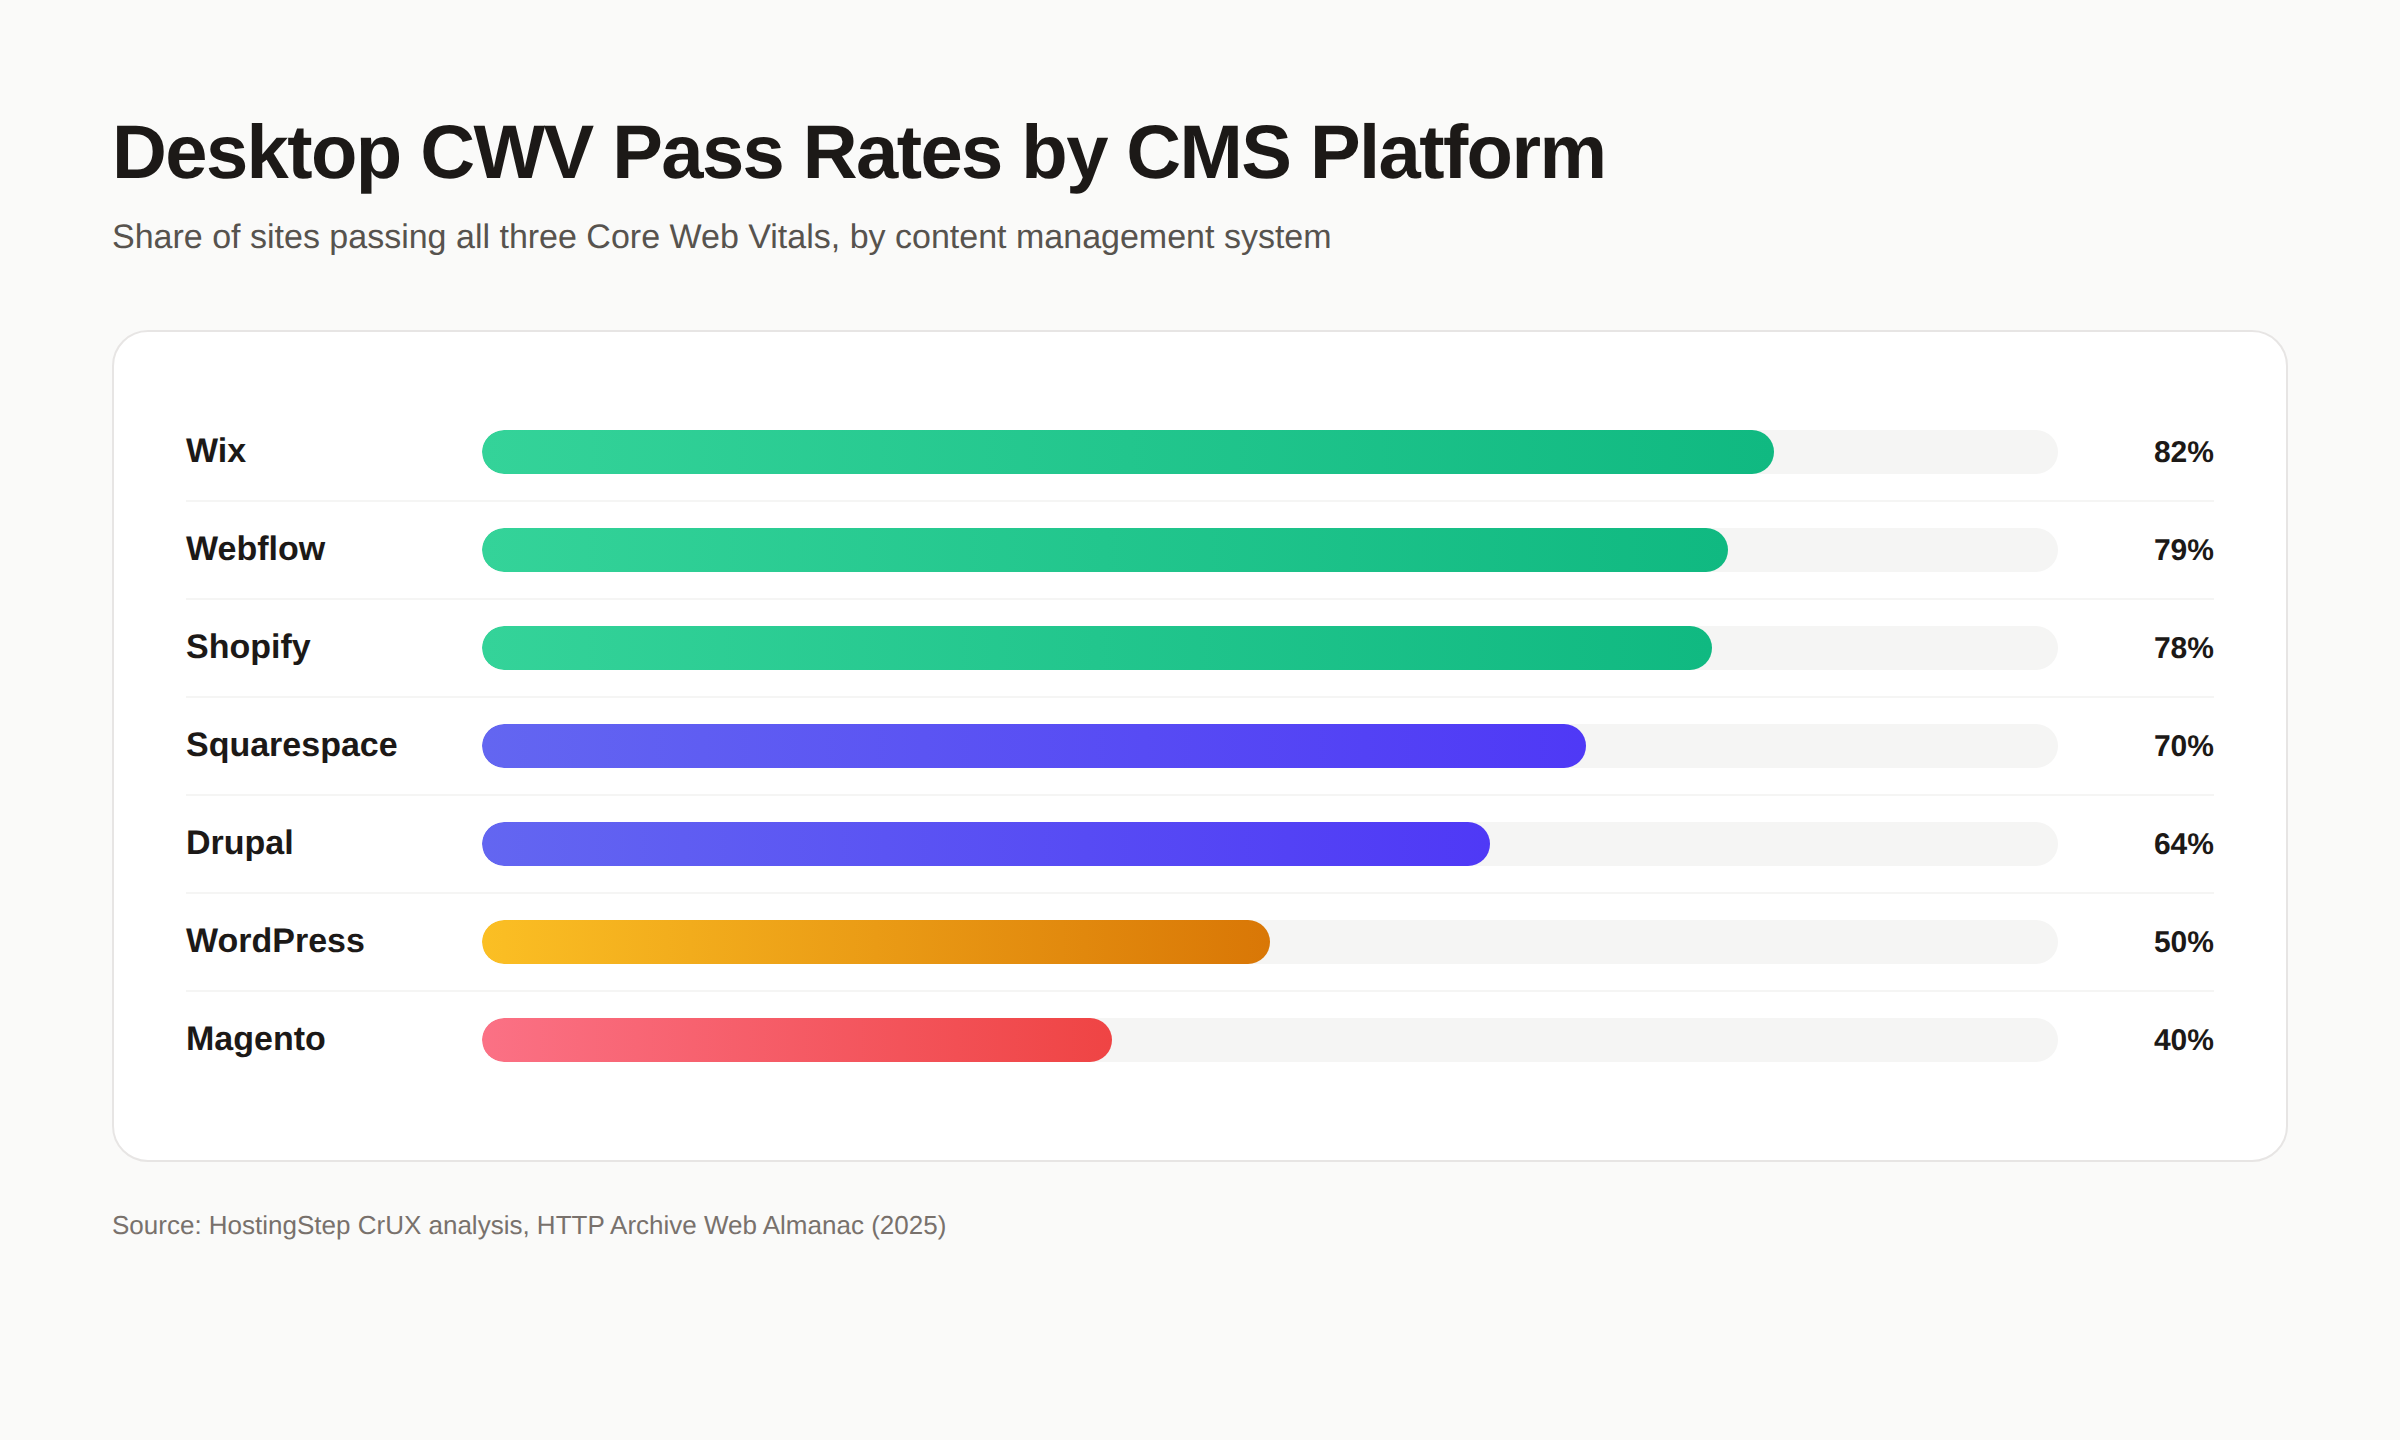
Performance is not equal across platforms. Hosted platforms like Wix, Webflow, and Shopify ship faster defaults. WordPress and Magento lag because they hand more performance control to the user. The data below shows the spread.
| Platform | Desktop CWV Pass Rate | Good TTFB |
|---|---|---|
| Wix | 82% | 65% |
| Webflow | 79% | 71% |
| Shopify | 78% | 95% |
| Squarespace | 70% | 94% |
| Drupal | 64% | 58% |
| WordPress | 50% | 32% |
| Magento | 40% | 19% |
42. Duda leads all major CMS platforms with 83.63% of sites passing all three Core Web Vitals. Hosted page builders dominate the top of the rankings. (Source: Search Engine Journal, 2025)
43. WordPress sits at 43.44% pass rate for all three Core Web Vitals. It is the most-used CMS yet ranks near the bottom for performance. (Source: Search Engine Journal, 2025)
44. Shopify has 95% good TTFB scores. Time to First Byte is the foundation that every other metric builds on. (Source: HostingStep, 2025)
45. Magento ranks last among major platforms at 40% desktop pass rate. E-commerce-heavy DOMs and self-hosted infrastructure pull down the numbers. (Source: HostingStep, 2025)
46. Technology sites have the highest pass rate at 65%. Developer-focused brands have a built-in performance advantage. (Source: HTTP Archive Web Almanac, 2025)
47. News and media sites have the lowest pass rate at 39%. Ads, third-party trackers, and content injection drive CLS failures. (Source: HTTP Archive Web Almanac, 2025)
48. 60% of e-commerce sites failed Core Web Vitals in 2024. Heavy product pages, dynamic pricing, and review widgets are the main causes. (Source: Semrush / SEOSandwich, 2024)
49. Squarespace has 95.85% good INP scores. Best-in-class for interactivity among major platforms. (Source: Search Engine Journal, 2025)
For platform-specific optimization, see our Shopify Core Web Vitals guide.
Business Impact of Core Web Vitals
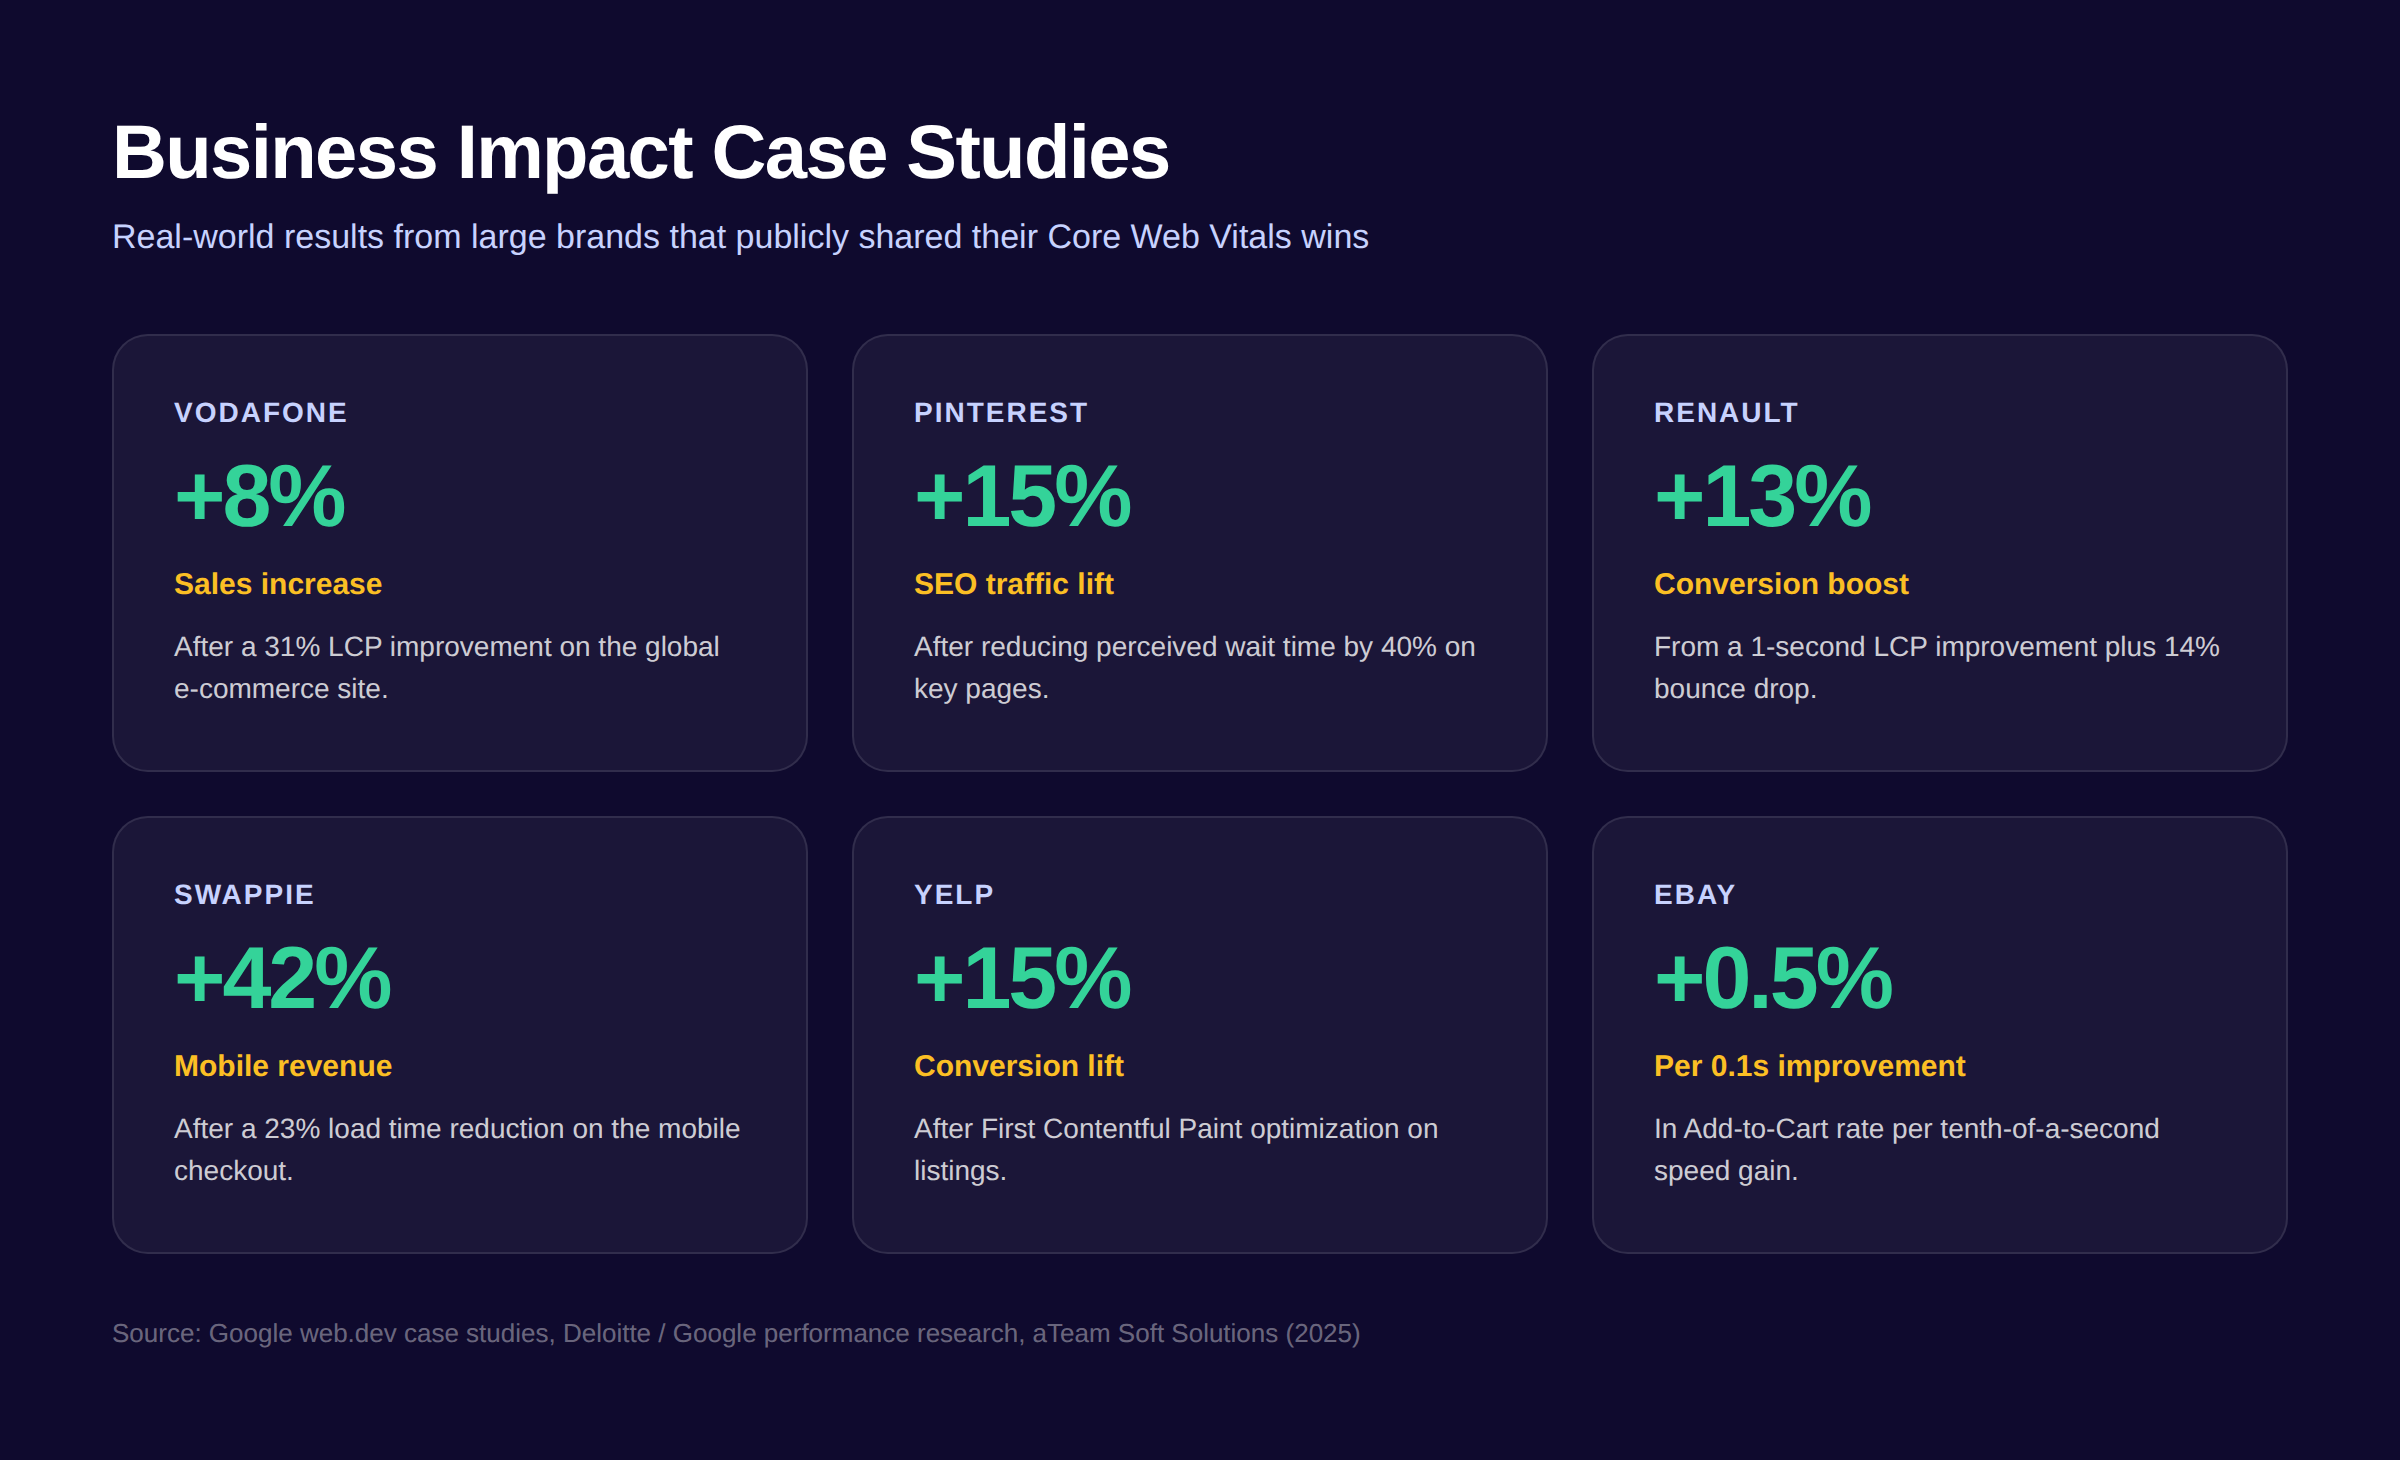
The case for Core Web Vitals is not just rankings. Faster sites convert better, retain more visitors, and earn more revenue per session. The case studies below come from Vodafone, Pinterest, Renault, and other large brands that publicly shared their results.
50. A 0.1-second load improvement drives an 8.4% conversion increase in e-commerce. The same delta drives a 10.1% lift in travel and 3.6% in luxury. (Source: Deloitte / Google, 2025)
51. Vodafone’s 31% LCP improvement drove an 8% sales increase. A single LCP optimization sprint paid for the entire performance program. (Source: Google / web.dev, 2024)
52. Pinterest reduced perceived wait time by 40% and increased SEO traffic by 15%. Performance gains stacked with organic visibility. (Source: aTeam Soft Solutions, 2025)
53. Renault cut bounce rate by 14% with a 1-second LCP improvement. Conversions rose 13% in the same window. (Source: aTeam Soft Solutions, 2025)
54. 53% of mobile users abandon a page if loading takes more than 3 seconds. That is the threshold below which most sites should target LCP. (Source: Google / Linkquest, 2025)
55. Sites failing all three Core Web Vitals face 8-35% losses in conversions, rankings, and revenue. The wider the failure, the bigger the cost. (Source: aTeam Soft Solutions, 2025)
Frequently Asked Questions
What is a good Core Web Vitals score? A good Core Web Vitals score means passing all three metrics at the 75th percentile of page loads. LCP must be under 2.5 seconds. INP must be under 200 milliseconds. CLS must be under 0.1. Sites that hit all three thresholds qualify as “good” in Google’s reporting and may receive a small ranking benefit.
Are Core Web Vitals still relevant in 2026? Yes. Core Web Vitals remain a confirmed Google ranking factor in 2026, and Google now evaluates performance at the origin level rather than just per page. Beyond rankings, faster sites convert 8-15% better and reduce bounce rates by double-digit percentages. The data does not support ignoring them.
What do Core Web Vitals measure? Core Web Vitals measure three real-world user experiences: loading performance via Largest Contentful Paint, interactivity via Interaction to Next Paint, and visual stability via Cumulative Layout Shift. All three pull data from real Chrome users through the Chrome User Experience Report, not lab simulations.
What causes poor Core Web Vitals scores? The top causes are slow server response times, unoptimized images that bloat LCP, render-blocking JavaScript and CSS, third-party scripts that delay interactivity, layout shifts from unsized images and late-loading fonts, and inadequate mobile optimization. Most sites have one or two dominant bottlenecks rather than all five at once.
Is 75 a good SEO score? A 75 in PageSpeed Insights or Lighthouse is borderline. Google rates performance scores 0-49 as poor, 50-89 as needs improvement, and 90-100 as good. A 75 falls in the middle band, which means real users likely experience friction but not catastrophic failure. Aim for 90+ on mobile to qualify as “good” by Google’s own definition.
How often does CrUX data update? The Chrome User Experience Report updates monthly. The dataset is calculated over a rolling 28-day window, so changes you make today show up in Search Console roughly 28 days later. That lag is why most performance teams pair CrUX with real-user monitoring or synthetic testing for faster feedback.
Key Takeaways
Core Web Vitals statistics in 2026 paint a clear picture. The web is faster than it was in 2020. INP is harder than FID was. Mobile still lags desktop. Hosted platforms outpace self-hosted ones. The performance gap between leaders and laggards is widening, not narrowing.
The most actionable lesson from this data: focus on LCP first. It fails most often, has the largest ranking impact in competitive niches, and is the easiest to move with image and font optimization. INP and CLS are usually downstream of architectural decisions you make once and inherit forever.
Performance is a content distribution problem in 2026. The fastest sites publish more, get crawled more, and rank more. If you are spending hours on content but losing to slower competitors, the Core Web Vitals dashboard is the first place to look.
Your SEO team. $99/month. Stacc publishes 30 SEO articles every month, fully optimized for Core Web Vitals at publish. No writers to hire. No briefs to fill out. Start for $1 →
For the full performance playbook, read our Core Web Vitals guide and our technical SEO checklist.
Related Statistics

Written by
Siddharth GangalSiddharth is the founder of theStacc and Arka360, and a graduate of IIT Mandi. He spent years watching great businesses lose organic traffic to competitors who simply published more. So he built a system to fix that. He writes about SEO, content at scale, and the tactics that actually move rankings.
30 SEO blog articles published every month
Keyword-optimized, scheduled, and live on your site. Automatically.
30-day trial · Cancel anytime
theStacc
Stop writing SEO content manually
30 blog articles, 30 GBP posts, and social media content. Published every month. Automatically.
Try for free$1 for 3 days · Cancel anytime