Page Speed Optimization (2026): Strategies, Tactics & Examples
page speed optimization guide for 2026: strategies, tactics, real examples, and implementation steps to get results faster.
Your website is losing visitors right now. Not because of bad content or weak branding. Because it loads too slowly.
53% of mobile users abandon sites that take over 3 seconds to load. A 1-second delay in page load time results in 7% fewer conversions. Page speed optimization is not optional in 2026. It is a ranking factor, a revenue factor, and a user experience factor all at once.
Google uses Core Web Vitals as a direct ranking signal. Sites that fail these thresholds lose visibility in search results. Sites that pass them rank higher, convert better, and keep visitors on the page longer.
This guide covers everything you need to speed up your website. You will learn how to measure your current performance, fix the biggest bottlenecks, and maintain fast load times over the long term.
We have published 3,500+ blog posts across 70+ industries. Our average SEO score is 92%. The performance standards in this guide are the ones we apply to every page we publish.
Here is what you will learn:
- Why page speed directly affects your Google rankings
- How to audit your site with free tools
- The image optimization changes that cut load times in half
- Server and hosting fixes that reduce response time by 60%+
- How to eliminate layout shifts and pass CLS
- A full optimization checklist you can follow step by step
Table of Contents
- Why Page Speed Matters for SEO
- Understanding Core Web Vitals
- How to Measure Page Speed
- Image Optimization
- Code Optimization
- Server and Hosting
- Layout and Rendering
- WordPress-Specific Optimization
- Advanced Techniques
- Page Speed Optimization Checklist
- FAQ
Why Page Speed Matters for SEO {#why-page-speed-matters}
Google confirmed site speed as a ranking factor in 2010. In 2021, Core Web Vitals became part of the page experience ranking system. In 2024, Interaction to Next Paint replaced First Input Delay as the responsiveness metric. Speed has only grown more important over time.
Speed Is a Direct Ranking Signal
Pages that pass all 3 Core Web Vitals thresholds rank higher than pages that fail them. Google’s own data shows sites meeting these benchmarks see 24% fewer page abandonments. One case study found that fixing Core Web Vitals increased page 1 rankings by 28%.
The effect is strongest when 2 pages have similar content quality and authority. Speed becomes the tiebreaker. If your competitor’s page loads in 1.8 seconds and yours loads in 4.2, Google has a clear signal about which page delivers a better user experience.
Mobile-First Indexing Amplifies the Impact
Google uses your mobile site for indexing and ranking. 63% of all web traffic now comes from mobile devices. Mobile connections are slower and less stable than desktop connections. A page that loads fine on desktop fiber may crawl on a 4G phone.
This makes mobile page speed optimization even more critical. Your mobile load time is the load time Google evaluates. If you only test on desktop, you are missing the version that actually determines your rankings.
Bounce Rate and Conversion Data
The numbers tell a clear story. The probability of a bounce increases 32% when load time goes from 1 to 3 seconds. At 5 seconds, the bounce probability doubles compared to a 1-second load.
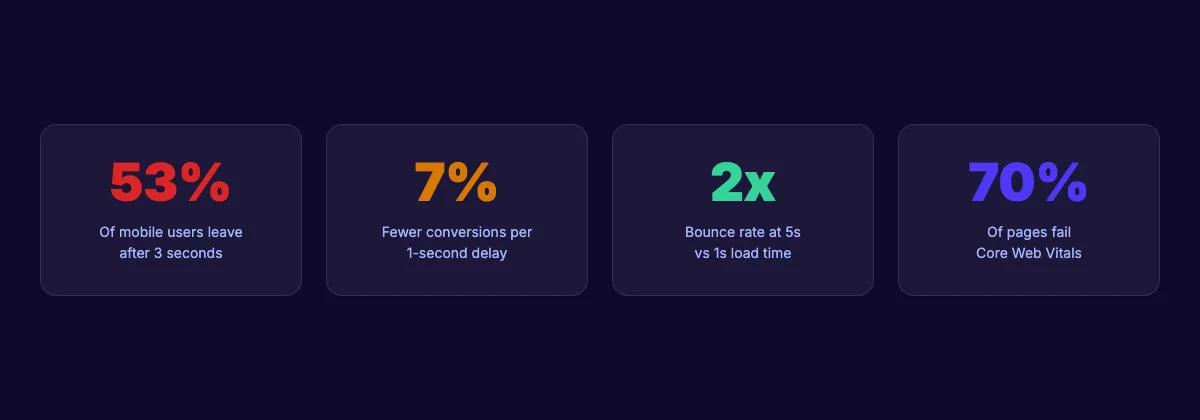
For ecommerce sites, every second matters even more. Amazon found that each 100-millisecond delay cost them 1% in sales. Walmart reported a 2% conversion increase for every 1-second improvement. These are not small numbers at scale.
Your SEO team. $99/month. 30 optimized articles published automatically on fast, SEO-friendly pages. Start for $1 →
Understanding Core Web Vitals {#core-web-vitals}
Core Web Vitals are 3 specific metrics Google uses to evaluate real-user experience. Each metric measures a different dimension of page performance. Passing all 3 is the goal. Here are the current thresholds.
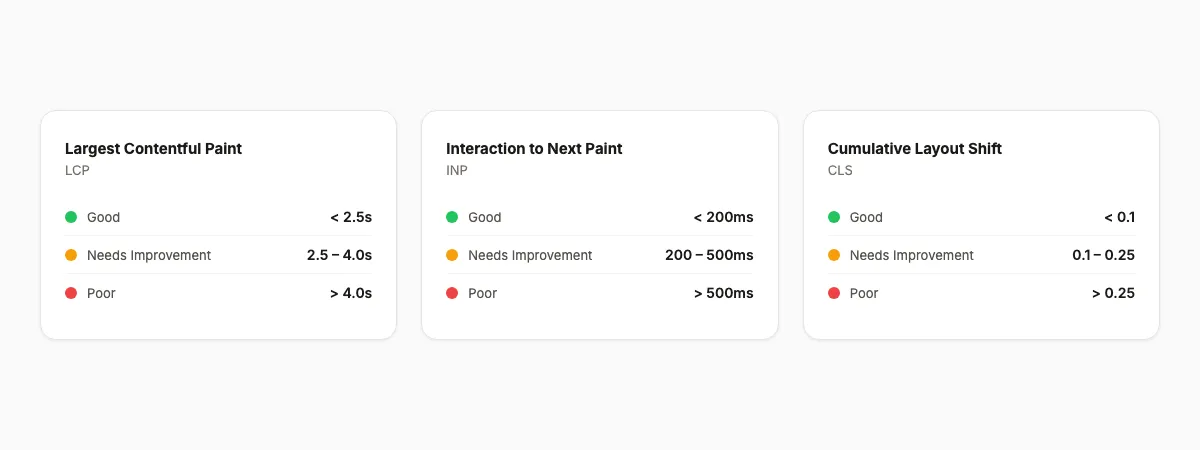
Largest Contentful Paint (LCP)
LCP measures how long it takes for the largest visible element to render. This is usually a hero image, a heading, or a large text block. Google considers LCP good when it is under 2.5 seconds. Anything over 4.0 seconds is rated poor.
The most common LCP killers are unoptimized images, slow server response, and render-blocking JavaScript. Fixing LCP often delivers the single biggest improvement in your overall page speed score. Focus here first.
Interaction to Next Paint (INP)
INP measures responsiveness. It tracks the delay between a user interaction (click, tap, keypress) and the next visual update. Good INP is under 200 milliseconds. Poor INP is over 500 milliseconds.
INP replaced First Input Delay in March 2024. Unlike FID, which only measured the first interaction, INP measures every interaction on the page. Heavy JavaScript, long main-thread tasks, and excessive third-party scripts are the primary causes of poor INP scores.
Cumulative Layout Shift (CLS)
CLS measures visual stability. It tracks unexpected layout movements during the page load. A good CLS score is below 0.1. A poor score is above 0.25.
Layout shifts happen when images load without defined dimensions, ads inject themselves into the page, or fonts swap after rendering. Users find layout shifts frustrating. They click the wrong button, lose their reading position, or accidentally move through away. Fixing CLS is often the quickest Core Web Vital to pass.
How to Measure Page Speed {#measure-page-speed}
You cannot improve what you do not measure. Start with a baseline audit of your current performance. Use at least 2 of these tools for a complete picture.
Google PageSpeed Insights
PageSpeed Insights is the starting point for any page speed audit. Enter any URL and get scores for both mobile and desktop. The tool shows your Core Web Vitals scores using real field data from the Chrome User Experience Report (CrUX). It also runs a Lighthouse lab test and provides specific fix recommendations.
Field data matters more than lab data. Field data comes from real users on real devices. Lab data comes from a simulated environment. If your field data shows poor scores, that is what Google sees when evaluating your page.
Google Search Console Core Web Vitals Report
Search Console shows Core Web Vitals performance across your entire site, not just one page. It groups URLs into Good, Needs Improvement, and Poor categories. This report helps you find patterns. Maybe all your blog posts have poor LCP. Maybe your product pages have high CLS.
Check this report monthly. It updates as Google collects new field data. After making fixes, watch for URLs to move from Poor to Good over 2 to 4 weeks.
Other Useful Tools
| Tool | Best For | Cost |
|---|---|---|
| Google PageSpeed Insights | Quick per-page audits | Free |
| Lighthouse (Chrome DevTools) | Detailed lab analysis | Free |
| Google Search Console | Site-wide CWV tracking | Free |
| GTmetrix | Waterfall analysis, history | Free / Pro |
| WebPageTest | Multi-location testing | Free |
| DebugBear | Continuous monitoring | Paid |
For a thorough SEO audit, combine PageSpeed Insights with Search Console. PageSpeed Insights tells you what is wrong on a single page. Search Console tells you which pages across your site need attention.
You can also run a quick check with our SEO audit tool or website SEO score checker to see how your overall site performance stacks up.
Image Optimization {#image-optimization}
Images are the largest single contributor to page weight on most websites. The average web page is over 2 MB, and images account for roughly 50% of that. Optimizing images is the highest-impact change you can make for page speed.
For a deep dive, read our full guide on blog image optimization for SEO.
Convert to WebP or AVIF
Modern image formats produce smaller files with equal or better visual quality. WebP files are 25 to 35% smaller than equivalent JPEGs. AVIF files are 30 to 50% smaller. Both formats are supported by all major browsers in 2026.
Use WebP as your default format. Use AVIF when your build pipeline supports it and you want maximum compression. Keep JPEG or PNG fallbacks for the rare older browser that does not support modern formats.
Compress Before Uploading
Even after converting to WebP, compression matters. Use a quality setting of 75 to 85 for most images. Blog hero images can go to 80. Decorative backgrounds can drop to 60. The human eye rarely notices the difference below 85 quality.
Tools like Squoosh, ShortPixel, and ImageOptim automate this process. Set up compression in your build pipeline so every image gets optimized before it reaches your server.
Use Responsive Images with srcset
Do not serve a 2400-pixel image to a 375-pixel phone screen. The srcset attribute tells the browser which image size to download based on viewport width and device pixel ratio. This alone can cut image transfer size by 60% on mobile.
<img
  src="hero-800.webp"
  srcset="hero-400.webp 400w, hero-800.webp 800w, hero-1200.webp 1200w"
  sizes="(max-width: 600px) 400px, (max-width: 1000px) 800px, 1200px"
  alt="Page speed optimization illustration"
  width="1200"
  height="630"
  loading="lazy"
/>
Lazy Load Below-Fold Images
Add loading="lazy" to every image that is not visible on initial page load. This tells the browser to skip downloading those images until the user scrolls near them. The result is a faster initial page render and lower LCP.
Do not lazy load your hero image or LCP element. Those need to load immediately. Use fetchpriority="high" on your LCP image to tell the browser it is the most important resource to download first.
Set Explicit Dimensions
Always include width and height attributes on every <img> tag. Without them, the browser does not know how much space to reserve. The image loads, pushes content down, and creates a layout shift. This directly hurts your CLS score.
3,500+ blogs published. 92% average SEO score. See what Stacc can do for your site. Start for $1 →
Code Optimization {#code-optimization}
After images, JavaScript and CSS are the next biggest performance bottlenecks. Unoptimized code blocks rendering, delays interactivity, and bloats page weight.
Minify CSS and JavaScript
Minification removes whitespace, comments, and unnecessary characters from code files. It reduces file size by 10 to 30% with zero impact on functionality. Every modern build tool (Vite, Webpack, esbuild) has minification built in.
If you are not using a build tool, online minifiers like Terser for JavaScript and cssnano for CSS do the same job. Run them on every file before deployment.
Remove Unused Code
Most websites load far more CSS and JavaScript than any single page needs. Chrome DevTools has a Coverage tab that shows exactly which lines of code run on a given page. Red lines are unused. Remove or defer them.
Tree shaking eliminates dead code at build time. If you use ES modules and a bundler like Vite or Webpack, tree shaking happens automatically. For CSS, tools like PurgeCSS scan your HTML and remove unused selectors.
Defer Non-Critical JavaScript
JavaScript blocks HTML parsing by default. Every <script> tag without defer or async forces the browser to stop building the page, download the script, execute it, then continue. This is the primary cause of slow initial render times.
Add defer to all non-essential scripts. This tells the browser to download the file in parallel but wait until HTML parsing finishes before executing. For third-party scripts like analytics or chat widgets, async works better since execution order does not matter.
Inline Critical CSS
Critical CSS is the minimum CSS needed to render the above-the-fold content. Extract it and inline it directly in the <head> of your HTML. This eliminates a render-blocking network request and lets the browser start painting immediately.
Tools like Critical and Critters automate this extraction. The rest of your CSS loads asynchronously after the initial paint. Users see content faster while the remaining styles load in the background.
Reduce Third-Party Scripts
Third-party scripts (analytics, ads, chat widgets, social embeds) are the silent performance killers. Each one adds DNS lookups, connections, and main-thread work. Audit your third-party scripts quarterly. Remove anything that does not directly drive revenue or provide essential data.
For scripts you must keep, load them with async or defer. Move non-essential ones below the fold or load them on user interaction (for example, load the chat widget only when someone clicks “Chat with us”).
Server and Hosting {#server-hosting}
Your server response time sets the floor for page speed. No amount of front-end optimization can fix a slow server. If your time to first byte (TTFB) is over 800 milliseconds, start here.
Choose Fast Hosting
Shared hosting plans often have TTFB over 1 second. A virtual private server (VPS) or managed hosting platform cuts that to 100 to 300 milliseconds. The difference is dramatic. For WordPress sites, managed hosts like Cloudways, Kinsta, or SiteGround optimized plans deliver significantly faster TTFB.
The cheapest hosting plan is not the cheapest in the long run. If slow hosting costs you 7% of conversions on every page, the revenue loss dwarfs the hosting savings.
Set Up a CDN
A Content Delivery Network caches your static files on servers around the world. When a visitor in London requests your page, they get files from a London server instead of your origin server in Dallas. This cuts latency by 50 to 200 milliseconds per request.
Cloudflare offers a free CDN tier that works well for most sites. BunnyCDN and Fastly are paid options with better performance for high-traffic sites. Set up your CDN before doing any other server optimization. The impact is immediate.
Enable Compression
GZIP compression reduces text-based file transfers by 60 to 80%. Brotli compression does even better, with 15 to 25% smaller files than GZIP. Most modern servers and CDNs support both.
Enable Brotli as the primary compression method. Use GZIP as a fallback for older clients. Check your response headers to verify compression is active. If you see content-encoding: br or content-encoding: gzip, you are set.
Use HTTP/2 or HTTP/3
HTTP/2 allows multiple files to download simultaneously over a single connection. HTTP/1.1 requires a separate connection for each file, which creates bottlenecks. HTTP/3 adds QUIC protocol support for even faster connections on unreliable networks.
Most modern hosting providers and CDNs support HTTP/2 by default. HTTP/3 requires Cloudflare, Fastly, or a similar provider. Check your server configuration to verify you are not still on HTTP/1.1.
Optimize Server Caching
Set proper cache headers for static assets. Images, fonts, CSS, and JavaScript files rarely change. Give them a Cache-Control: max-age=31536000 header (1 year). Use cache-busting filenames (adding a hash to the filename) so browsers fetch new versions when files actually change.
For HTML pages, use shorter cache durations or no-cache with validation. This ensures users always get fresh content while static assets load instantly from the browser cache.
Layout and Rendering {#layout-rendering}
Layout shifts frustrate users and hurt your CLS score. A page that jumps around while loading feels broken, even if it eventually renders correctly. Fixing CLS is often the easiest Core Web Vital to improve.
Set Image and Video Dimensions
Every <img> and <video> tag needs explicit width and height attributes. The browser uses these to reserve the correct space before the media loads. Without them, the element starts at 0 pixels and expands when the file arrives, pushing everything below it down.
Modern CSS frameworks handle this with the aspect-ratio property. But HTML attributes remain the most reliable method. Use both for maximum browser compatibility.
Reserve Space for Ads and Embeds
Ads are the worst CLS offenders. They load asynchronously, often seconds after the page renders, and inject themselves into the layout. Reserve a fixed-height container for each ad slot. Use min-height in CSS to prevent the collapse-and-expand pattern.
The same approach works for embedded content like YouTube videos, tweets, and maps. Wrap each embed in a container with a defined aspect ratio. The container holds space while the embed loads.
Optimize Font Loading
Custom fonts cause layout shifts when they swap in after the page renders. Text rendered in a fallback font suddenly changes to the custom font, moving content around. The fix is font-display: swap in your @font-face declaration.
Preload your most important font file. Add <link rel="preload" href="/fonts/main.woff2" as="font" type="font/woff2" crossorigin> to your <head>. This tells the browser to start downloading the font immediately, reducing the swap delay.
Limit your site to 2 or 3 font files total. Each additional font file is another network request. System fonts (-apple-system, BlinkMacSystemFont, "Segoe UI") are the fastest option with zero download time.
Avoid Layout Shifts From Dynamic Content
Content that loads after initial render (lazy-loaded sections, infinite scroll, accordion panels) can cause layout shifts. Use CSS contain: layout on dynamic sections to isolate their layout calculations. Set minimum heights for containers that will receive dynamic content.
For on-page SEO elements like sticky headers and floating CTAs, use position: fixed or position: sticky instead of injecting elements into the document flow. Fixed and sticky elements do not cause layout shifts because they exist outside the normal flow.
Rank everywhere. Do nothing. Blog SEO, Local SEO, and Social on autopilot. Stacc starts at $49/mo. Start for $1 →
WordPress-Specific Optimization {#wordpress-optimization}
WordPress powers over 40% of all websites. Its plugin architecture makes it flexible but also makes it vulnerable to performance bloat. These optimizations apply specifically to WordPress sites.
Audit Your Plugins
Every active plugin adds PHP execution time, database queries, and often front-end scripts. Deactivate and delete plugins you do not use. For the ones you keep, test their performance impact one at a time using Query Monitor or the P3 Profiler plugin.
A typical WordPress site has 20 to 30 plugins. Many of those load scripts on every page, even pages where the plugin is not needed. Use an asset manager plugin to conditionally load scripts only on the pages that require them.
Install a Caching Plugin
WordPress generates pages dynamically by default. Every page visit triggers PHP execution and database queries. A caching plugin generates static HTML versions of your pages and serves those instead. The speed difference is massive.
WP Rocket is the best commercial option with built-in minification, lazy loading, and CDN integration. LiteSpeed Cache is the best free option if your host runs the LiteSpeed server. W3 Total Cache and WP Super Cache are other reliable free alternatives.
Optimize Your Theme
Many premium WordPress themes load hundreds of kilobytes of CSS and JavaScript for features you never use. Carousel sliders, animation libraries, icon fonts, and page builder frameworks all add weight. Choose a performance-focused theme like GeneratePress, Kadence, or Astra.
If you are stuck with a heavy theme, disable features you do not use in the theme settings. Remove Google Fonts if you use system fonts. Disable unused widget areas and sidebars. Every feature you turn off removes code from the page.
Clean Your Database
WordPress databases accumulate clutter over time. Post revisions, spam comments, transient options, and orphaned metadata slow down database queries. Use WP-Optimize or Advanced Database Cleaner to remove this clutter monthly.
Limit post revisions to 5 by adding define('WP_POST_REVISIONS', 5); to your wp-config.php file. This prevents the revisions table from growing indefinitely.
Advanced Techniques {#advanced-techniques}
After handling the fundamentals, these advanced techniques push your performance even further. Most of these require some development knowledge or build tool configuration.
Preload Critical Resources
The <link rel="preload"> tag tells the browser to start downloading a resource immediately, before it discovers the resource through normal parsing. Use preload for your LCP image, critical fonts, and above-the-fold CSS.
<link rel="preload" href="/hero.webp" as="image" type="image/webp">
<link rel="preload" href="/fonts/inter-var.woff2" as="font" type="font/woff2" crossorigin>
Do not overuse preload. Every preloaded resource competes with other downloads. Limit preload to 3 to 5 critical resources.
Prefetch Next-Page Resources
If you know which page a user is likely to visit next, <link rel="prefetch"> downloads that page in the background during idle time. When the user clicks, the page loads nearly instantly because the resources are already cached.
Use prefetch on navigation links that get high click-through rates. Product pages can prefetch the cart page. Blog posts can prefetch the next post in the series. Use data from your analytics to determine which pages are most likely to be visited next.
Use Resource Hints
Beyond preload and prefetch, <link rel="dns-prefetch"> and <link rel="preconnect"> speed up third-party resource loading. DNS prefetch resolves the domain name ahead of time. Preconnect goes further and establishes the full connection (DNS + TCP + TLS).
<link rel="preconnect" href="https://fonts.googleapis.com" crossorigin>
<link rel="dns-prefetch" href="https://www.google-analytics.com">
Add preconnect for any third-party domain that loads above-the-fold resources. Use dns-prefetch for third-party domains that load below the fold.
Service Workers for Offline and Speed
Service workers act as a programmable proxy between your site and the network. They can cache resources, serve pages offline, and respond to requests faster than a network round trip. For repeat visitors, a service worker can make your site feel instant.
Workbox by Google simplifies service worker implementation. It handles caching strategies, precaching, and runtime caching with a clean API. Use a cache-first strategy for static assets and a network-first strategy for HTML pages.
Edge Computing
Edge functions run server-side code at CDN edge locations instead of your origin server. Cloudflare Workers, Vercel Edge Functions, and Deno Deploy all support this pattern. Edge functions reduce TTFB to under 50 milliseconds for dynamic content.
Use edge functions for personalization, A/B testing, redirects, and authentication checks. Moving this logic to the edge eliminates the round trip to your origin server and reduces total page load time.
Page Speed Optimization Checklist {#checklist}
Print this checklist and work through it top to bottom. Quick wins come first. Tackle advanced fixes after the basics are in place.
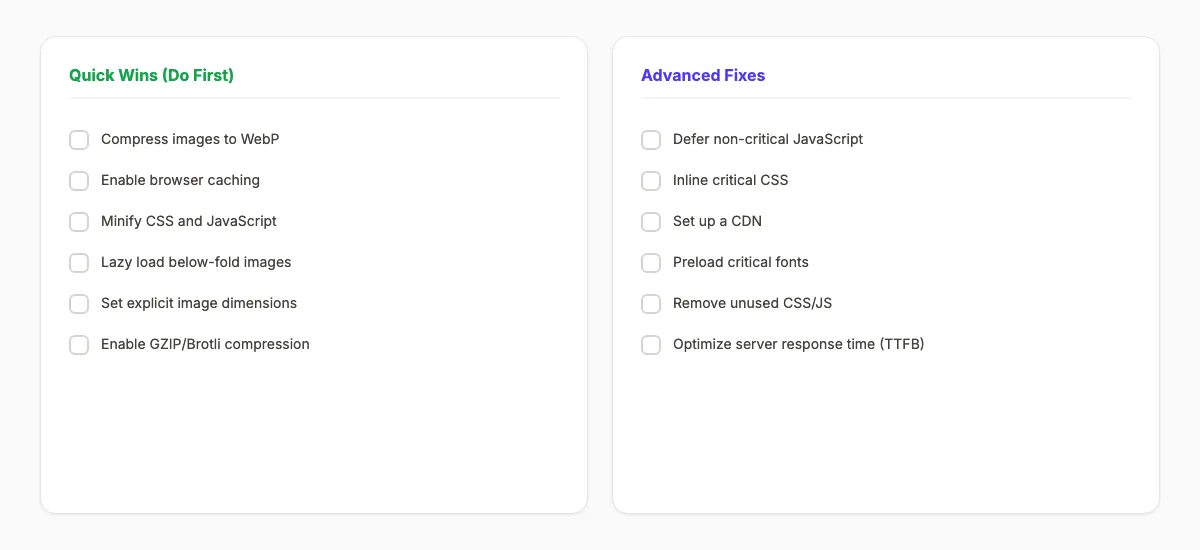
Quick Wins (Do First)
- Convert images to WebP format
- Compress all images to quality 75 to 85
- Add
loading="lazy"to below-fold images - Set
widthandheighton every image - Minify all CSS and JavaScript files
- Enable GZIP or Brotli compression on your server
- Set cache headers for static assets (1-year max-age)
- Remove unused plugins (WordPress)
- Install and configure a caching plugin (WordPress)
- Test with PageSpeed Insights and record baseline scores
Intermediate Fixes
- Add
deferorasyncto non-critical scripts - Set up a CDN (Cloudflare free tier is a good start)
- Use
font-display: swapfor all custom fonts - Limit custom fonts to 2 to 3 files
- Reserve space for ads and embeds with min-height
- Use responsive images with srcset
- Remove unused CSS with PurgeCSS or similar tool
Advanced Fixes
- Inline critical CSS for above-the-fold content
- Preload LCP image and critical fonts
- Prefetch likely next-page resources
- Add preconnect for third-party domains
- Implement a service worker for repeat visitors
- Upgrade to HTTP/2 or HTTP/3
- Move dynamic logic to edge functions
- Optimize server TTFB to under 200 milliseconds
- Set up continuous monitoring with Search Console CWV report
After completing each section, re-run PageSpeed Insights. Compare your new scores against the baseline. Track improvements in Google Search Console over the following 2 to 4 weeks to confirm the impact on real-user data.
For a broader site health check, use our SEO audit tool or follow our full SEO audit guide.
FAQ {#faq}
What is a good page speed score?
A PageSpeed Insights score of 90 or above is considered good. Scores between 50 and 89 need improvement. Below 50 is poor. Focus on passing all 3 Core Web Vitals (LCP under 2.5 seconds, INP under 200 milliseconds, CLS under 0.1) rather than chasing a perfect 100 score.
Does page speed directly affect Google rankings?
Yes. Google confirmed page speed as a ranking factor in 2010 and expanded its impact with Core Web Vitals in 2021. Sites that pass all 3 Core Web Vitals thresholds rank higher than those that do not, especially in competitive niches where content quality is similar. Read more in our guide to ranking higher on Google.
How fast should a website load in 2026?
Your page should load in under 2.5 seconds (measured by LCP) for a “good” rating. Under 1.5 seconds is excellent. Anything over 4 seconds is rated poor by Google. For mobile users, aim for the fastest possible load time since mobile connections are less stable than desktop.
What is the biggest factor affecting page speed?
Images are the single largest factor for most websites. They account for roughly 50% of total page weight. Converting images to WebP, compressing them, lazy loading below-fold images, and using responsive srcset can cut page load time by 40 to 60%. Start with image optimization before moving to code and server fixes.
How do I check my Core Web Vitals?
Use Google PageSpeed Insights for per-page scores. Check Google Search Console under Experience and then Core Web Vitals for site-wide data. Chrome DevTools (Lighthouse tab) provides detailed lab analysis. You can also use our website SEO score tool for a quick overview.
How long does it take to see results after page speed optimization?
Most fixes take effect immediately for new visitors. Google’s field data (CrUX) updates on a rolling 28-day window. You will see Core Web Vitals improvements reflected in Search Console within 2 to 4 weeks. Ranking improvements from better page experience signals typically follow within 4 to 8 weeks, though this varies by competition level. Learn about timelines in our SEO for new websites guide.
Speed Is a Competitive Advantage
Most websites are slow. 70% of pages fail Core Web Vitals according to current data. Every page you optimize gives you an edge over competitors who ignore performance. That edge compounds over time as Google continues to weight user experience in its ranking algorithm.
Page speed optimization is not a one-time project. It is an ongoing practice. New features, updated plugins, and additional content can all degrade performance. Build speed checks into your monthly workflow. Re-run PageSpeed Insights after every major site change. Monitor Search Console for regressions.
The fastest way to publish speed-optimized content is to let someone else handle it. Stacc publishes 30 optimized blog posts per month on pages built for performance. Every article scores 92% or higher on SEO benchmarks, including page speed.
Start with the checklist above. Fix the quick wins this week. Then work through the intermediate and advanced items over the next month. Your rankings, your conversions, and your visitors will thank you.

Written by
Siddharth GangalSiddharth is the founder of theStacc and Arka360, and a graduate of IIT Mandi. He spent years watching great businesses lose organic traffic to competitors who simply published more. So he built a system to fix that. He writes about SEO, content at scale, and the tactics that actually move rankings.
30 SEO blog articles published every month
Keyword-optimized, scheduled, and live on your site. Automatically.
30-day trial · Cancel anytime
theStacc
Stop writing SEO content manually
30 blog articles, 30 GBP posts, and social media content. Published every month. Automatically.
Start Your $1 Trial$1 for 3 days · Cancel anytime