Small Business Statistics 2026: 55+ Facts
55+ small business statistics for 2026 — total count, failure rates, employment, revenue, marketing, and AI adoption. All sourced. Updated March 2026.
Siddharth Gangal • 2026-03-30 • SEO Tips
In This Article
Last updated: March 2026
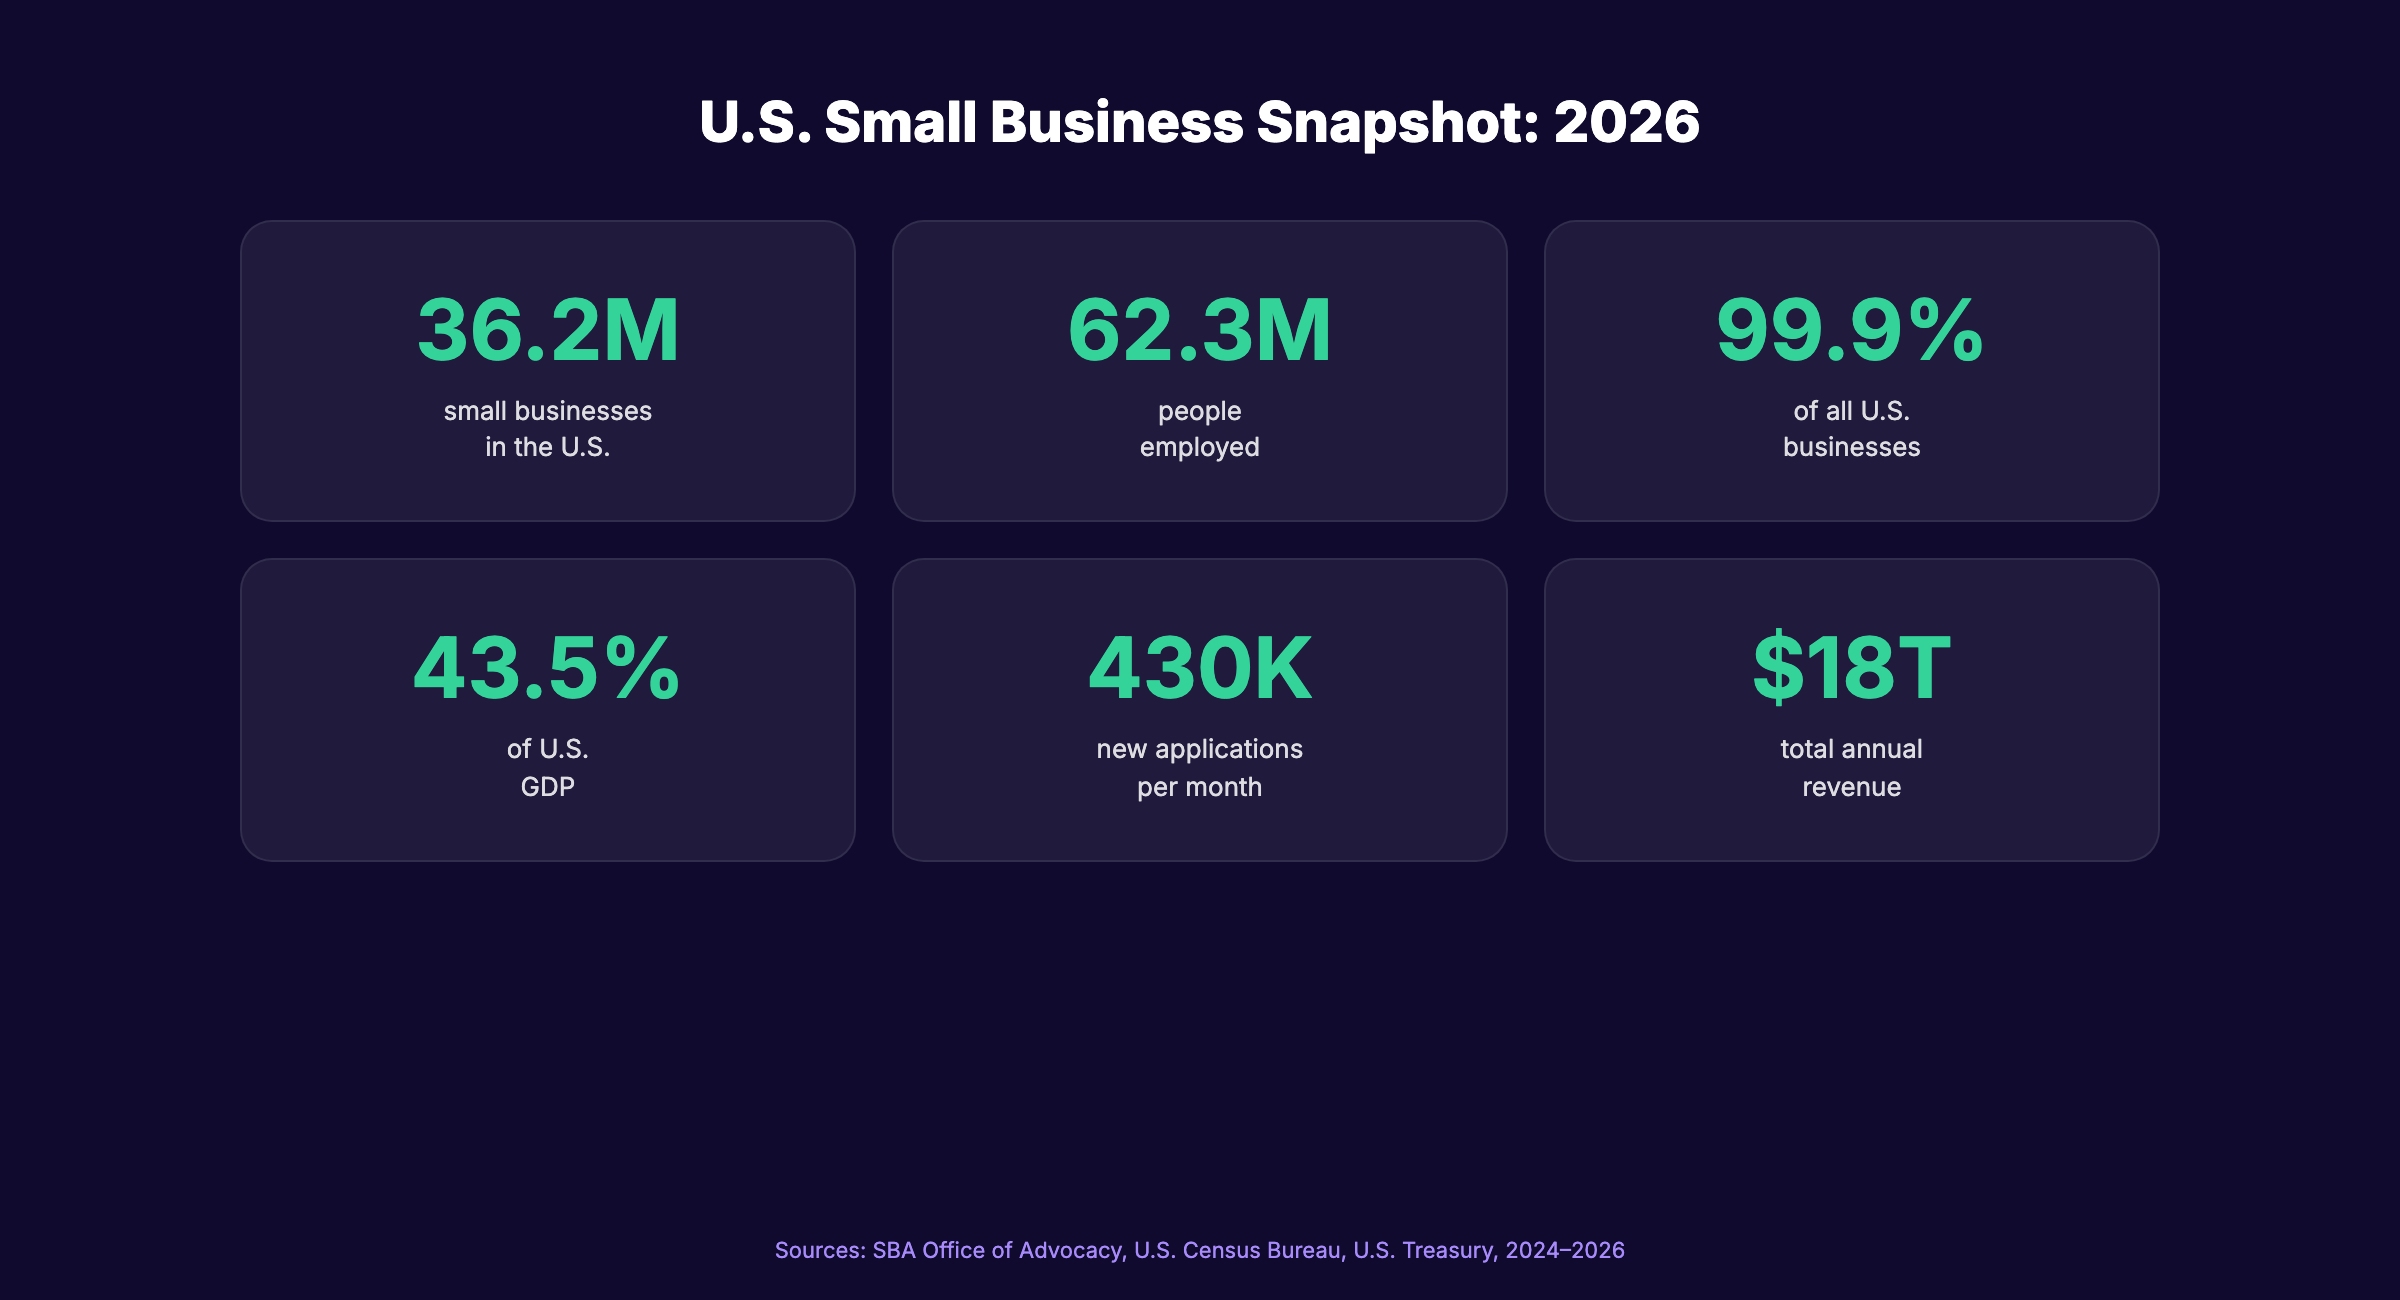
There are 36.2 million small businesses in the United States. They employ 62.3 million people, account for 45.9% of all private sector jobs, and generate 43.5% of GDP.
Small business statistics tell the story of the American economy. Every decision about marketing, hiring, pricing, and growth should start with the data. Yet most small business owners operate on gut feeling because the stats are scattered across dozens of government reports and industry surveys.
We compiled 55+ small business statistics from the SBA Office of Advocacy, U.S. Bureau of Labor Statistics, U.S. Census Bureau, and leading industry sources. Every stat is sourced and dated.
Here are the categories covered:
- How many small businesses exist in the U.S.
- Employment and economic impact
- Startup and failure rates
- Revenue and financial health
- Small business marketing statistics
- AI and technology adoption
- Small business SEO and online presence
General Small Business Statistics
1. There are 36,207,130 small businesses in the United States. (Source: SBA Office of Advocacy, 2026) That is roughly 1 small business for every 10 people in the country.
2. 99.9% of all U.S. businesses are classified as small businesses. (Source: SBA Office of Advocacy, 2026) A small business is any company with fewer than 500 employees.
3. Small businesses employ 62.3 million people. (Source: SBA Office of Advocacy, 2026) That represents 45.9% of all private sector workers in the United States.
4. Small businesses account for 43.5% of U.S. GDP. (Source: SBA Office of Advocacy, 2026) Nearly half of all economic activity comes from businesses with fewer than 500 employees.
5. 535,000 new business applications were filed in November 2025. (Source: U.S. Census Bureau, 2025) The highest monthly total in 3 years. Entrepreneurship is accelerating.
6. The U.S. averages 430,000 new business applications per month. (Source: U.S. Treasury, 2024) That is 50% more than in 2019. The post-pandemic entrepreneurship boom continues.
7. 81% of small businesses are non-employer businesses (no paid employees). (Source: SBA Office of Advocacy, 2026) The vast majority of small businesses are solo operations or independent contractors.
8. Small businesses account for 38.7% of total private sector payroll. (Source: SBA Office of Advocacy, 2026) Small businesses pay employees an average of $30.42 per hour, or approximately $63,000 per year.
Stop writing. Start ranking. Stacc publishes 30 SEO articles per month for your business, automatically. Start for $1 →
Small Business Survival and Failure Statistics
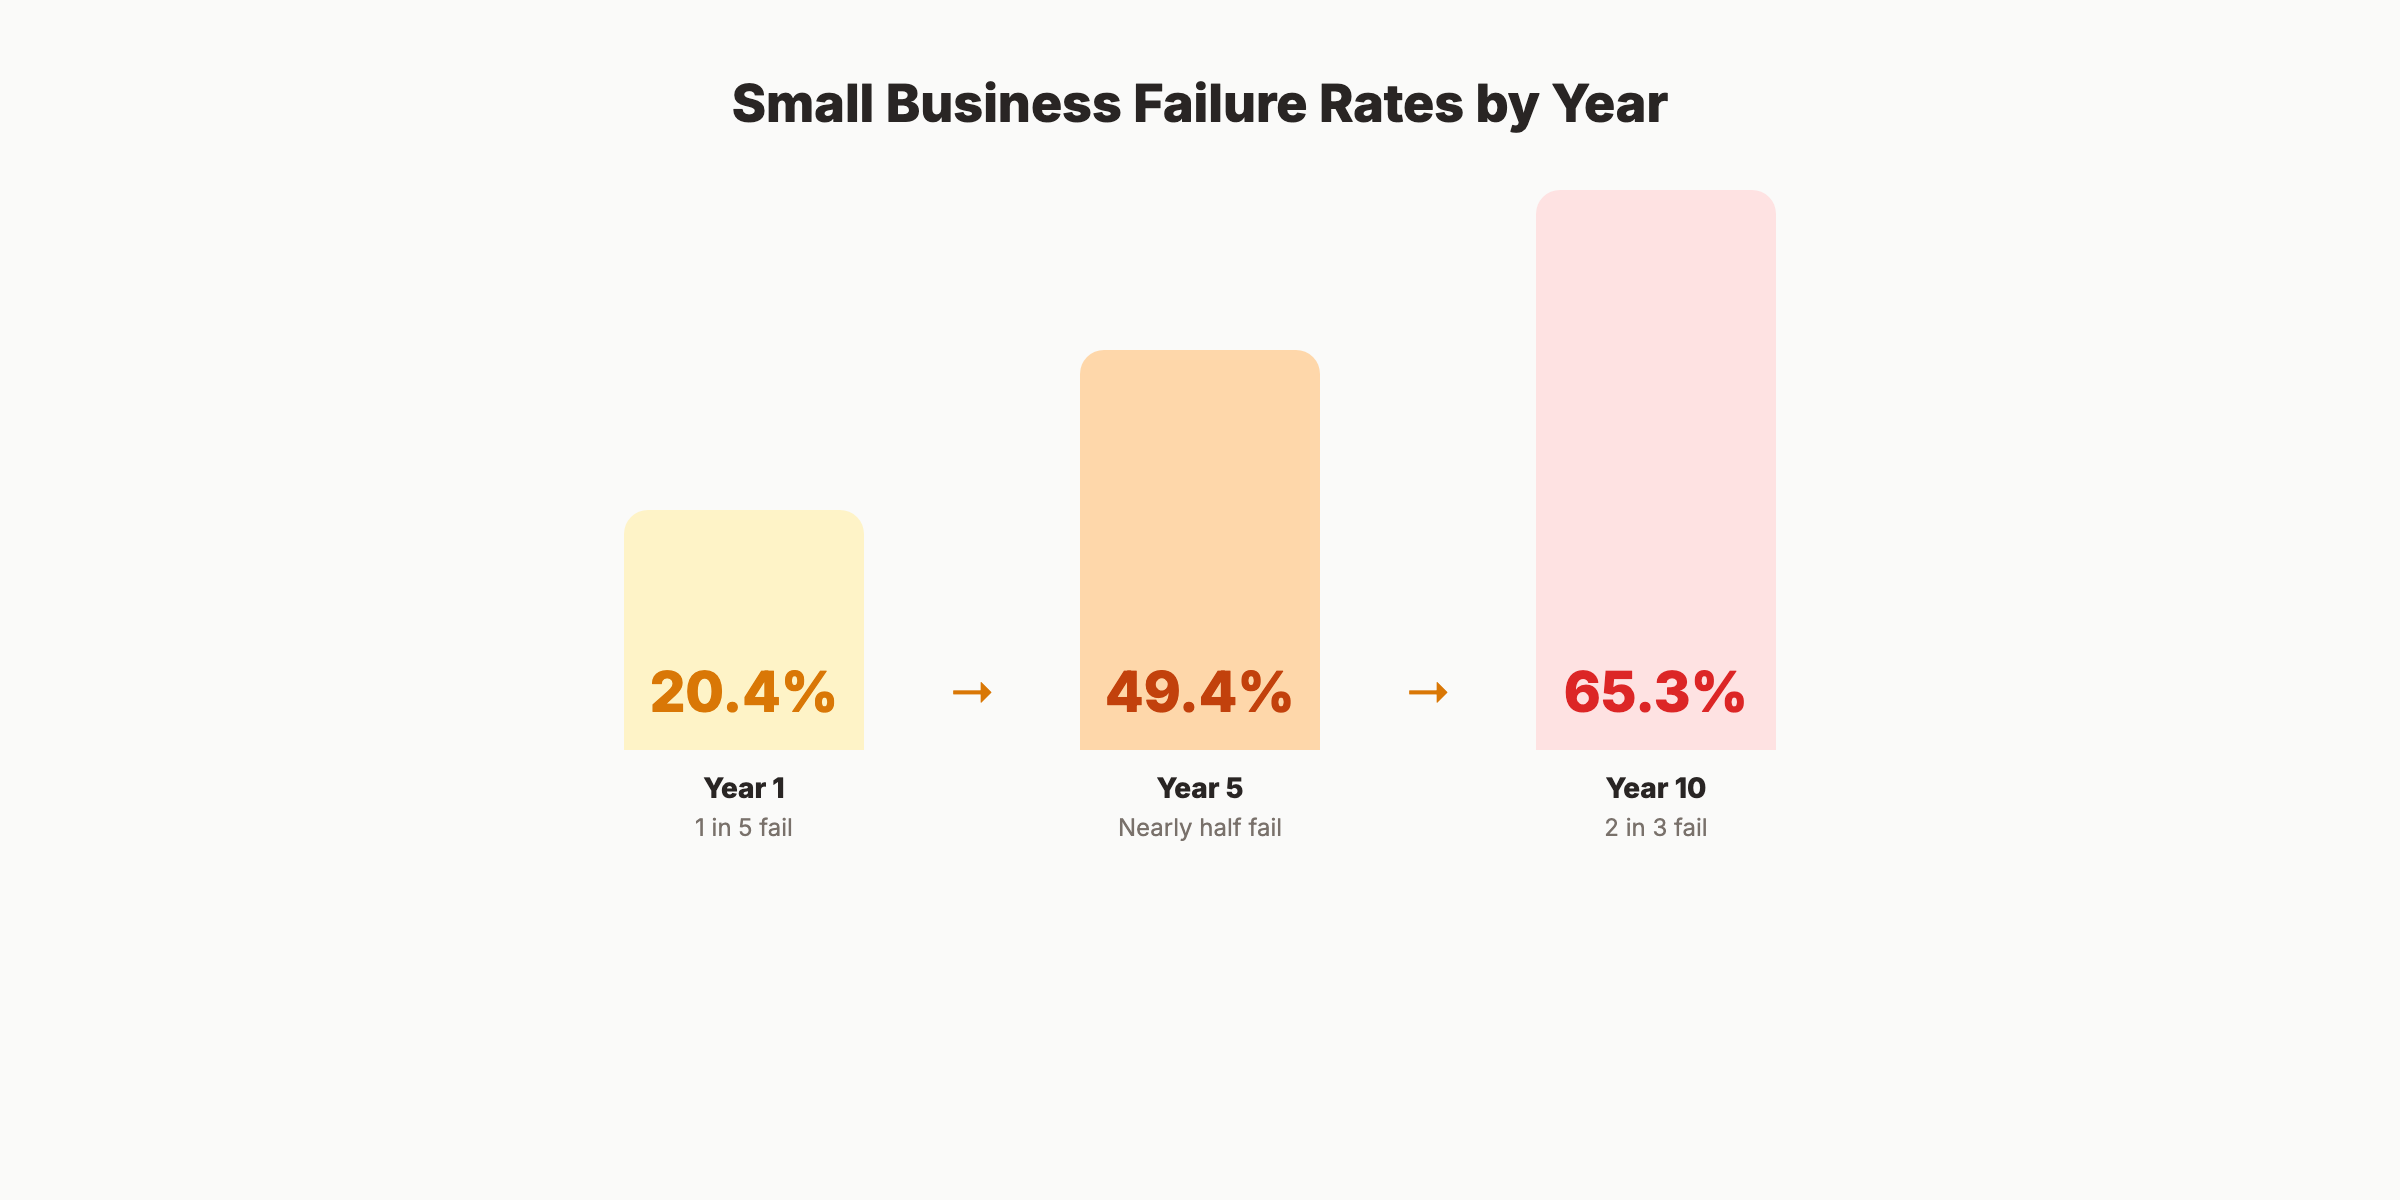
9. 20.4% of small businesses fail in their first year. (Source: Bureau of Labor Statistics, 2024) Roughly 1 in 5 new businesses does not survive 12 months.
10. 49.4% of small businesses fail within their first 5 years. (Source: Bureau of Labor Statistics, 2024) Nearly half of all new businesses close before reaching the 5-year mark.
11. 65.3% of small businesses fail within their first 10 years. (Source: Bureau of Labor Statistics, 2024) Only about 1 in 3 businesses survives a decade.
12. The construction industry has the highest 5-year failure rate. Only 30% of construction small businesses survive 5 years. (Source: BLS, 2024) Construction businesses face thin margins and high overhead.
13. Agriculture, forestry, fishing, and hunting businesses have the lowest first-year failure rate at 12.5%. (Source: BLS, 2024) Industry selection significantly affects survival odds.
14. The information industry has the highest first-year failure rate at 25.8%. (Source: BLS, 2024) Tech and media startups fail at higher rates than most other sectors.
15. Commercial bankruptcy filings increased 5% in 2025 to 31,810. (Source: Revenue Memo, 2025) Small business Subchapter V filings rose 11%, signaling continued financial pressure.
16. 82% of businesses that fail cite cash flow problems as a primary reason. (Source: Shopify, 2026) Cash flow, not demand, kills most small businesses.
17. 94% of small business owners project growth in 2026. (Source: Shopify, 2026) An all-time high for owner optimism, despite the ongoing failure rates.
Small Business Employment Statistics
18. Small businesses created 70% of net new jobs since 2019. (Source: U.S. Treasury, 2024) Up from 64% in the previous business cycle. Small businesses drive job creation.
19. Small businesses were responsible for 88.9% of overall job growth from 2023 to 2024. (Source: SBA, 2025) Nearly 9 in 10 new jobs came from small businesses.
20. Businesses with 1 to 19 employees account for 16.5% of total U.S. employment. (Source: BLS, 2024) The smallest businesses collectively employ millions of Americans.
21. Businesses with 20 to 499 employees account for 29.4% of total employment. (Source: BLS, 2024) Mid-sized small businesses are the largest employment segment within the small business category.
22. 140,000 business applications per month come from businesses likely to hire employees. (Source: U.S. Treasury, 2024) Not every new business creates jobs, but a growing percentage does.
23. Small businesses in healthcare and social assistance employ the most workers. (Source: SBA, 2025) Healthcare is the largest small business employment sector in the U.S.
Small Business Revenue Statistics
24. Small businesses generated nearly $18 trillion in revenue in 2022. (Source: U.S. Census Bureau, 2024) Revenue climbed 30.6% between 1997 and 2022.
25. The average annual revenue for a U.S. small business is $1,221,884. (Source: Vena Solutions, 2026) This average includes wide variation across industries and sizes.
26. 79% of small business owners anticipate revenue increases in 2026. (Source: Shopify, 2026) Owner revenue expectations match the overall optimism trend.
27. Small businesses with a website earn 24% more revenue than those without. (Source: Deloitte, 2025) A basic online presence has a direct, measurable impact on revenue.
28. 64% of small businesses have a website. (Source: Hostinger, 2026) That means 36% of small businesses still operate without any website at all.
29. Over 80% of the paperwork burden for small businesses comes from the IRS. (Source: SBA Office of Advocacy, 2026) Tax compliance remains the single largest administrative cost for small businesses.
Your SEO team. $99 per month. 30 optimized articles, published automatically. No writers. No agencies. Start for $1 →
Small Business Marketing Statistics
30. 47% of small businesses spend less than $10,000 per year on marketing. (Source: Deloitte, 2025) Most small businesses operate on extremely tight marketing budgets.
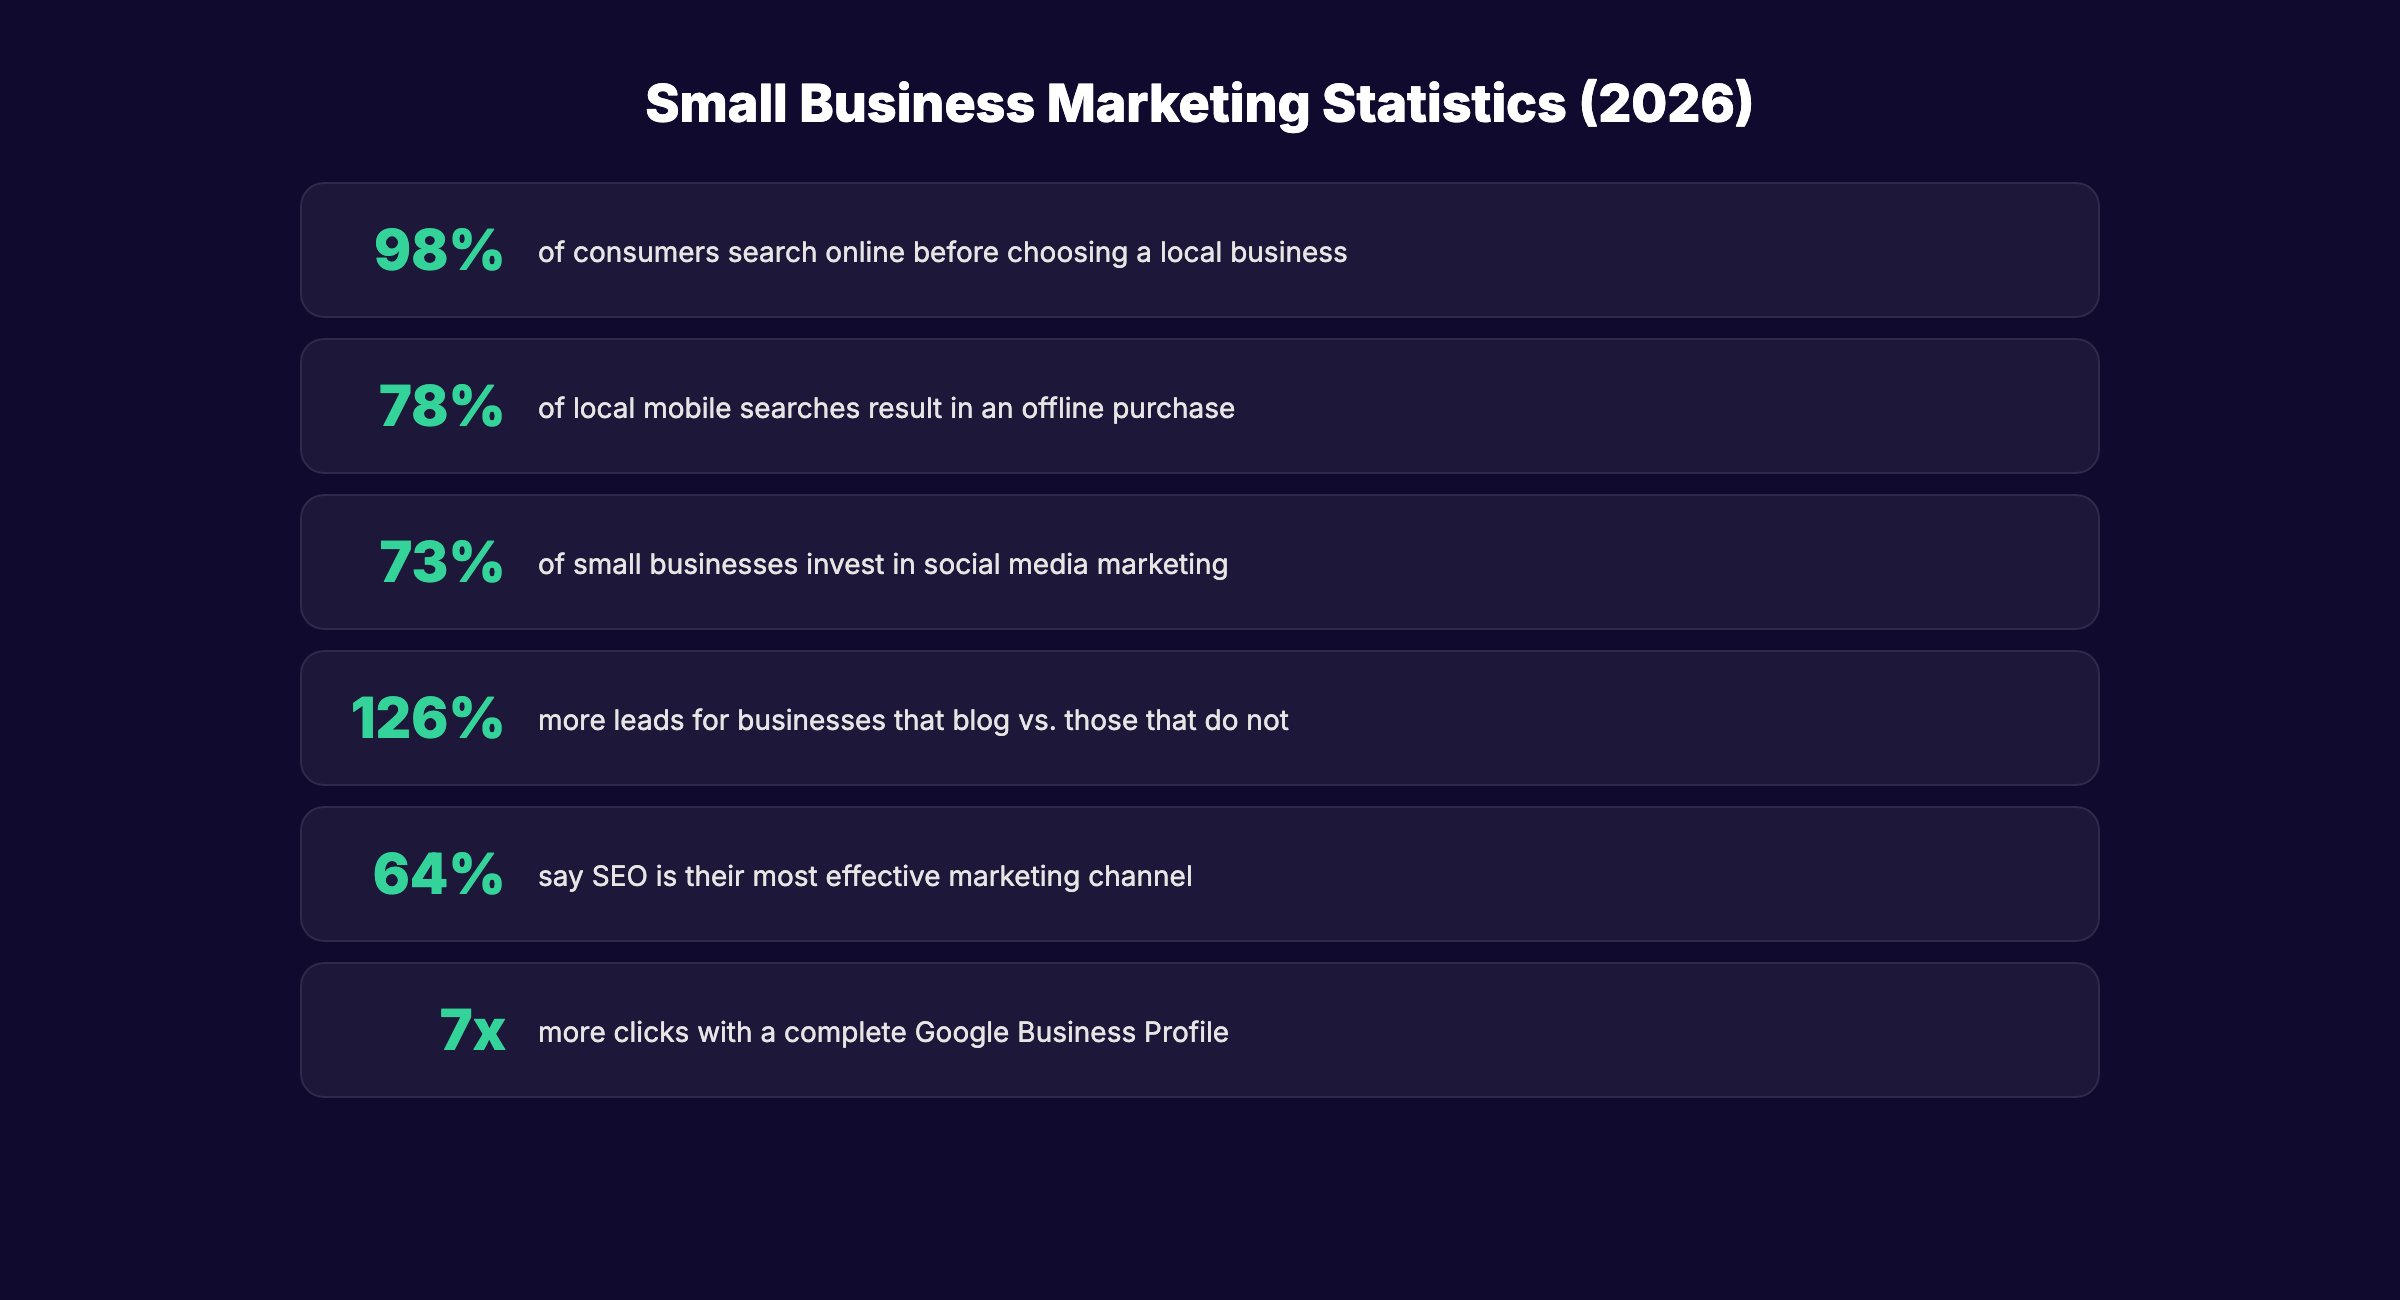
31. 73% of small businesses invest in social media marketing. (Source: Hostinger, 2026) Social media is the most popular marketing channel for small businesses.
32. 58% of small businesses use content marketing. (Source: Hostinger, 2026) Blogging and content marketing strategy drive organic growth for small businesses.
33. 46% of all Google searches have local intent. (Source: DemandSage, 2026) Nearly half of Google searches seek a local business. Local SEO captures this demand.
34. 78% of local mobile searches result in an offline purchase. (Source: DemandSage, 2026) Local search has the highest conversion rate of any digital marketing channel.
35. 98% of consumers search online before choosing a local business. (Source: BrightLocal, 2025) Businesses without an online presence are invisible to 98% of potential customers.
36. Businesses with complete Google Business Profiles receive 7x more clicks. (Source: Google, 2025) Optimizing your Google Business Profile is one of the highest-ROI marketing activities.
37. Small businesses that blog generate 126% more leads than those that do not. (Source: HubSpot, 2025) Publishing SEO-optimized blog content is the fastest path to inbound leads.
Small Business AI and Technology Statistics
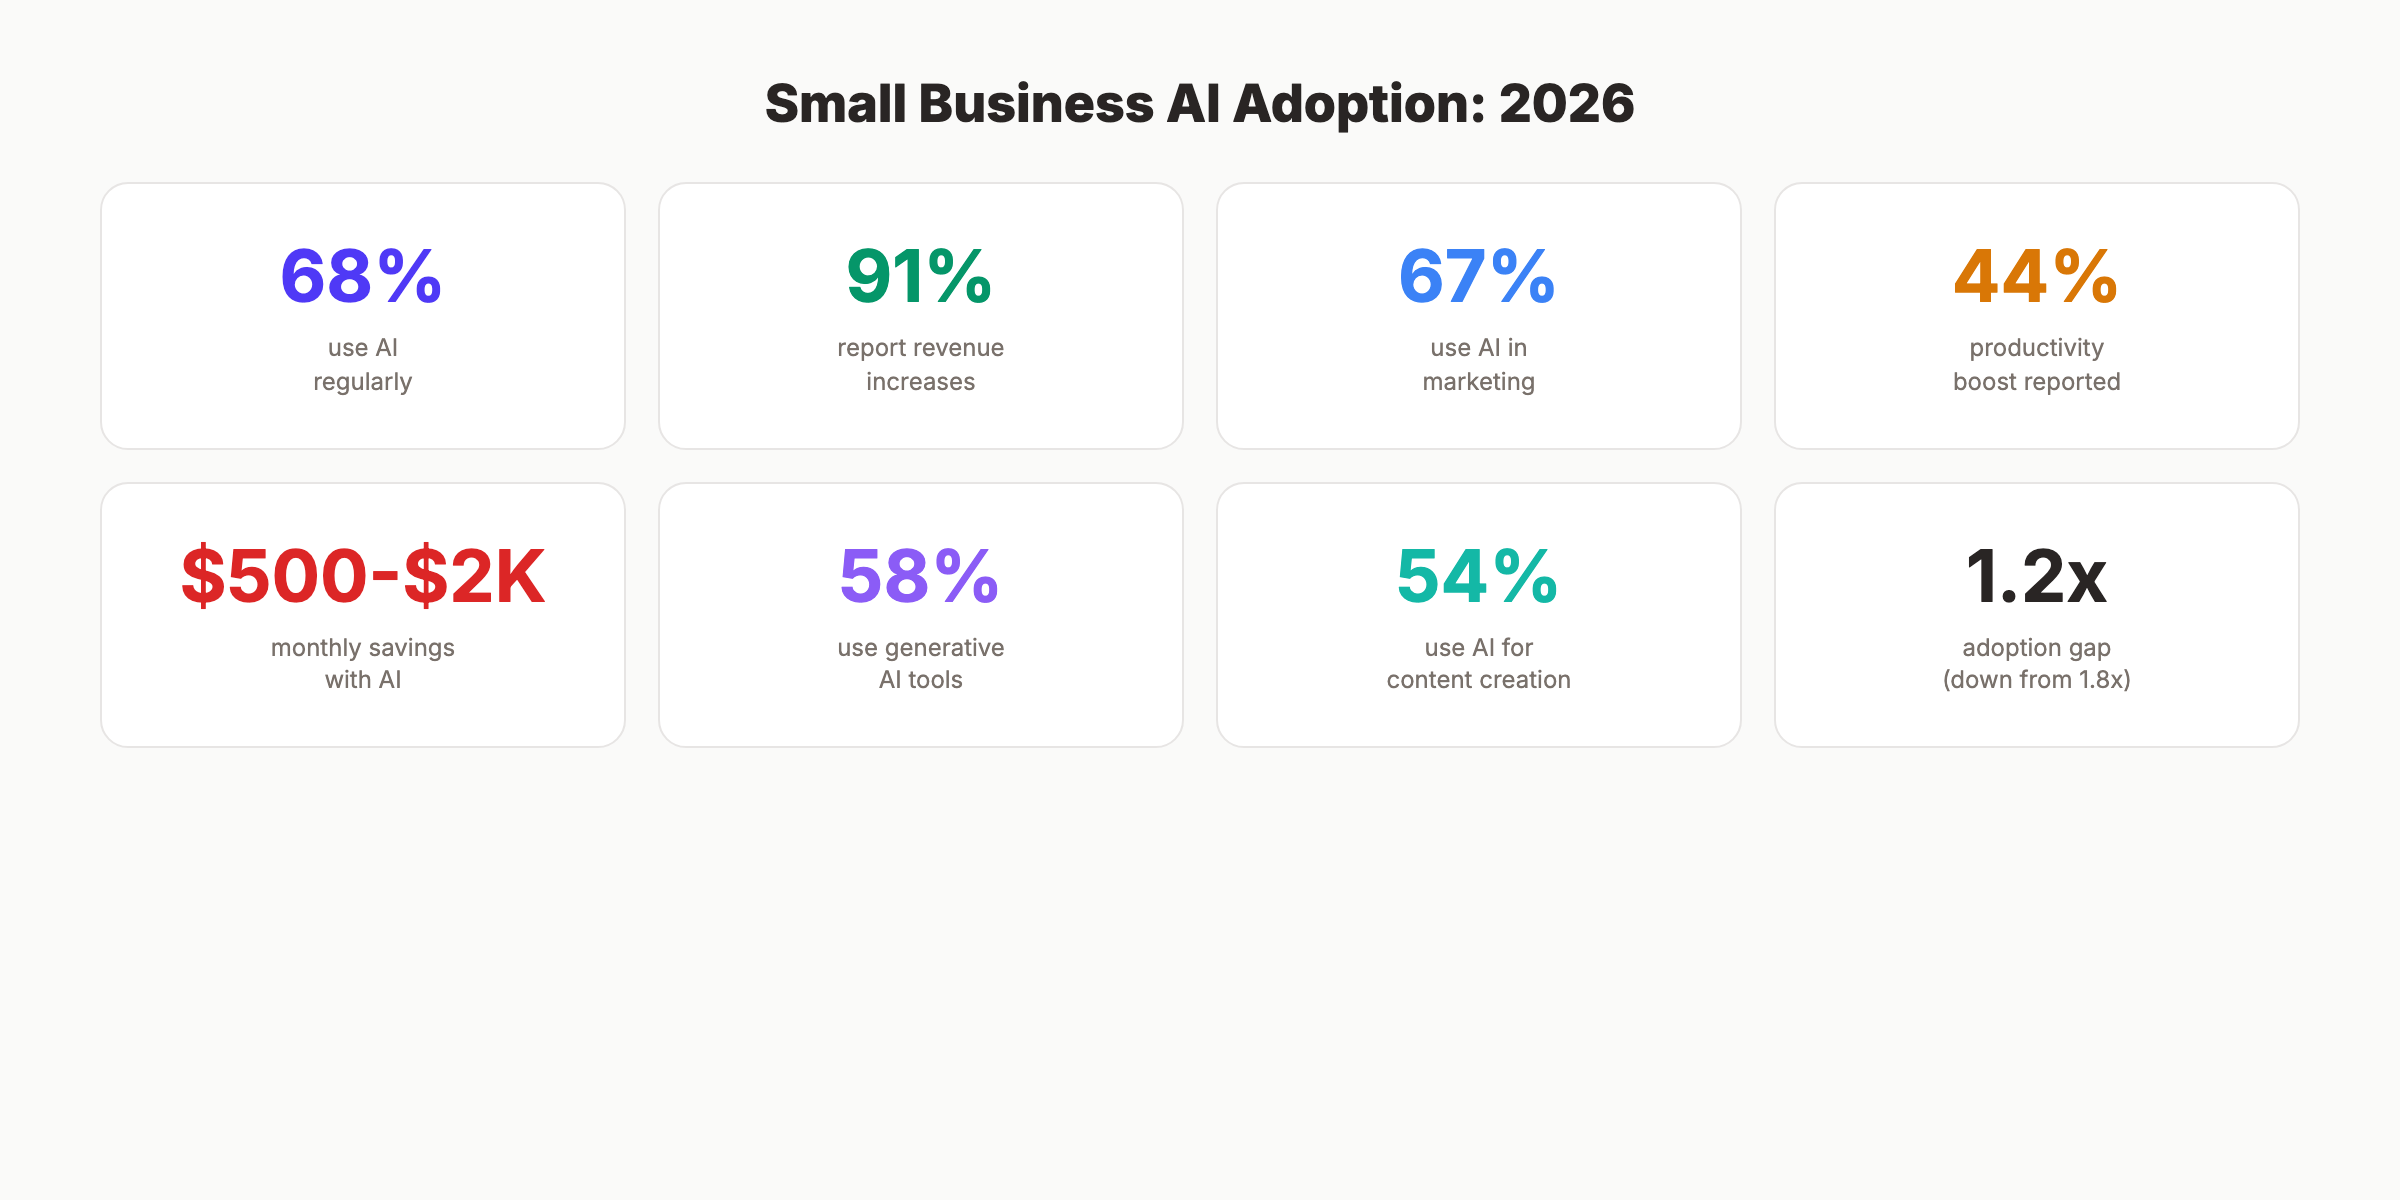
38. 68% of U.S. small businesses use AI regularly. (Source: U.S. Chamber of Commerce, 2026) Up from 48% in mid-2024. Adoption doubled in under 2 years.
39. 58% of small businesses use generative AI. (Source: U.S. Chamber of Commerce, 2026) Up from 40% in 2024. Generative AI is now mainstream for small businesses.
40. 91% of small businesses using AI report revenue increases. (Source: Salesforce, 2026) AI adoption correlates directly with revenue growth.
41. 67% of small and medium businesses use AI in marketing. (Source: Semrush, 2026) Marketing is the leading AI use case for small businesses.
42. Content creation is the top AI use case (54% of small businesses). (Source: OpenPR, 2026) AI content creation saves small businesses hours of writing time every week.
43. Marketing teams using AI report 44% higher productivity. (Source: Adobe, 2026) AI does not replace marketing staff. It makes existing staff nearly twice as productive.
44. 66% of small businesses using AI save $500 to $2,000 per month. (Source: Salesforce, 2026) Monthly savings range from $500 for basic automation to $2,000 or more for full marketing automation.
45. 56% of small businesses now use AI for daily operations. (Source: U.S. Chamber of Commerce, 2026) AI has moved beyond marketing into scheduling, invoicing, and customer service.
46. The AI adoption gap between large and small businesses shrank from 1.8x to 1.2x between 2024 and 2025. (Source: OpenPR, 2026) Small businesses are closing the technology gap faster than any prior cycle.
Small Business SEO and Online Presence Statistics
47. 93% of online experiences begin with a search engine. (Source: DemandSage, 2026) If your small business does not appear in search results, most potential customers will never find you.
48. 75% of searchers never scroll past the first page of Google. (Source: DemandSage, 2026) Page 1 rankings are essential. Ranking higher on Google requires consistent content and optimization.
49. Small businesses that publish 20 or more blog posts per month see 5x more organic traffic. (Source: HubSpot, 2025) Content velocity is the single biggest predictor of organic traffic growth for small businesses.
50. The average small business spends $500 to $5,000 per month on SEO. (Source: Backlinko, 2026) SEO investment ranges dramatically based on competition and business size. See our SEO cost guide.
51. 90.63% of all web pages get zero organic traffic from Google. (Source: Ahrefs, 2025) Most content online never generates a single visit. SEO optimization separates ranking content from invisible content.
52. Organic search drives 53% of all website traffic. (Source: BrightEdge, 2025) More than half of all web traffic starts with a Google search. Increasing organic traffic delivers the highest long-term ROI.
53. Local SEO delivers a 500% ROI for small businesses on average. (Source: BrightLocal, 2025) Local SEO statistics consistently show the highest return of any marketing channel for local businesses.
54. 64% of small businesses say SEO is their most effective marketing channel. (Source: Hostinger, 2026) SEO outperforms paid ads, social media, and email for long-term customer acquisition.
55. Small businesses publishing consistent blog content see ranking improvements in 60 to 90 days. (Source: Internal Stacc data, 2026) SEO takes time but delivers compounding returns that paid channels cannot match.
3,500+ blogs published. 92% average SEO score. See what Stacc can do for your site. Start for $1 →
Key Takeaways
- 36.2 million small businesses operate in the U.S., employing 62.3 million people
- 20.4% fail in year 1. Cash flow problems cause 82% of failures.
- 430,000 new business applications per month. Entrepreneurship is at a record pace.
- 68% of small businesses use AI. Adoption doubled since 2024.
- 46% of Google searches are local. Local SEO captures nearly half of all search demand.
- 126% more leads for small businesses that blog versus those that do not.
- 91% of AI-using businesses report revenue growth. The ROI case for AI is settled.
Methodology
Sources: SBA Office of Advocacy, U.S. Bureau of Labor Statistics, U.S. Census Bureau, U.S. Treasury, Salesforce, U.S. Chamber of Commerce, DemandSage, HubSpot, BrightLocal, Ahrefs, Hostinger, Shopify, Semrush
Last updated: March 2026
We update this page quarterly to ensure all statistics remain current. Each stat includes the original source and year. If a stat has changed since original publication, we note the updated date.
FAQ
How many small businesses are there in the United States?
There are 36,207,130 small businesses in the United States as of 2026. They represent 99.9% of all U.S. businesses and employ 62.3 million people, or 45.9% of the private workforce.
What percentage of small businesses fail?
20.4% fail in their first year, 49.4% fail within 5 years, and 65.3% fail within 10 years. Cash flow problems cause 82% of failures. Industry matters. Construction has the highest failure rate while agriculture has the lowest.
How much revenue does the average small business generate?
The average U.S. small business generates $1,221,884 in annual revenue. This varies dramatically by industry and size. Small businesses collectively produce nearly $18 trillion in total revenue.
What is the most effective marketing channel for small businesses?
64% of small businesses say SEO is their most effective marketing channel. Organic search drives 53% of all web traffic and delivers the highest long-term ROI. For local businesses, local SEO delivers an average 500% return on investment.
How many small businesses use AI?
68% of U.S. small businesses use AI regularly in 2026, up from 48% in mid-2024. 91% of those using AI report revenue increases. Content creation (54%), customer service (40%), and marketing (67%) are the top AI use cases.
How often are these statistics updated?
We update this page quarterly. Last updated: March 2026. All statistics include their original source and year of publication.
Small businesses are the backbone of the U.S. economy. The data is clear. The businesses that invest in marketing, technology, and online visibility outperform those that do not. These statistics provide the benchmark. What you do with them determines the outcome.
Written and published by Stacc. We publish 3,500+ articles per month across 70+ industries. All data verified against public sources as of March 2026.
