Log File Analysis for SEO (2026): Strategies, Tactics & Examples
Practical log file analysis seo strategies for 2026: step-by-step tactics, real examples, and tools to improve rankings and drive organic traffic.
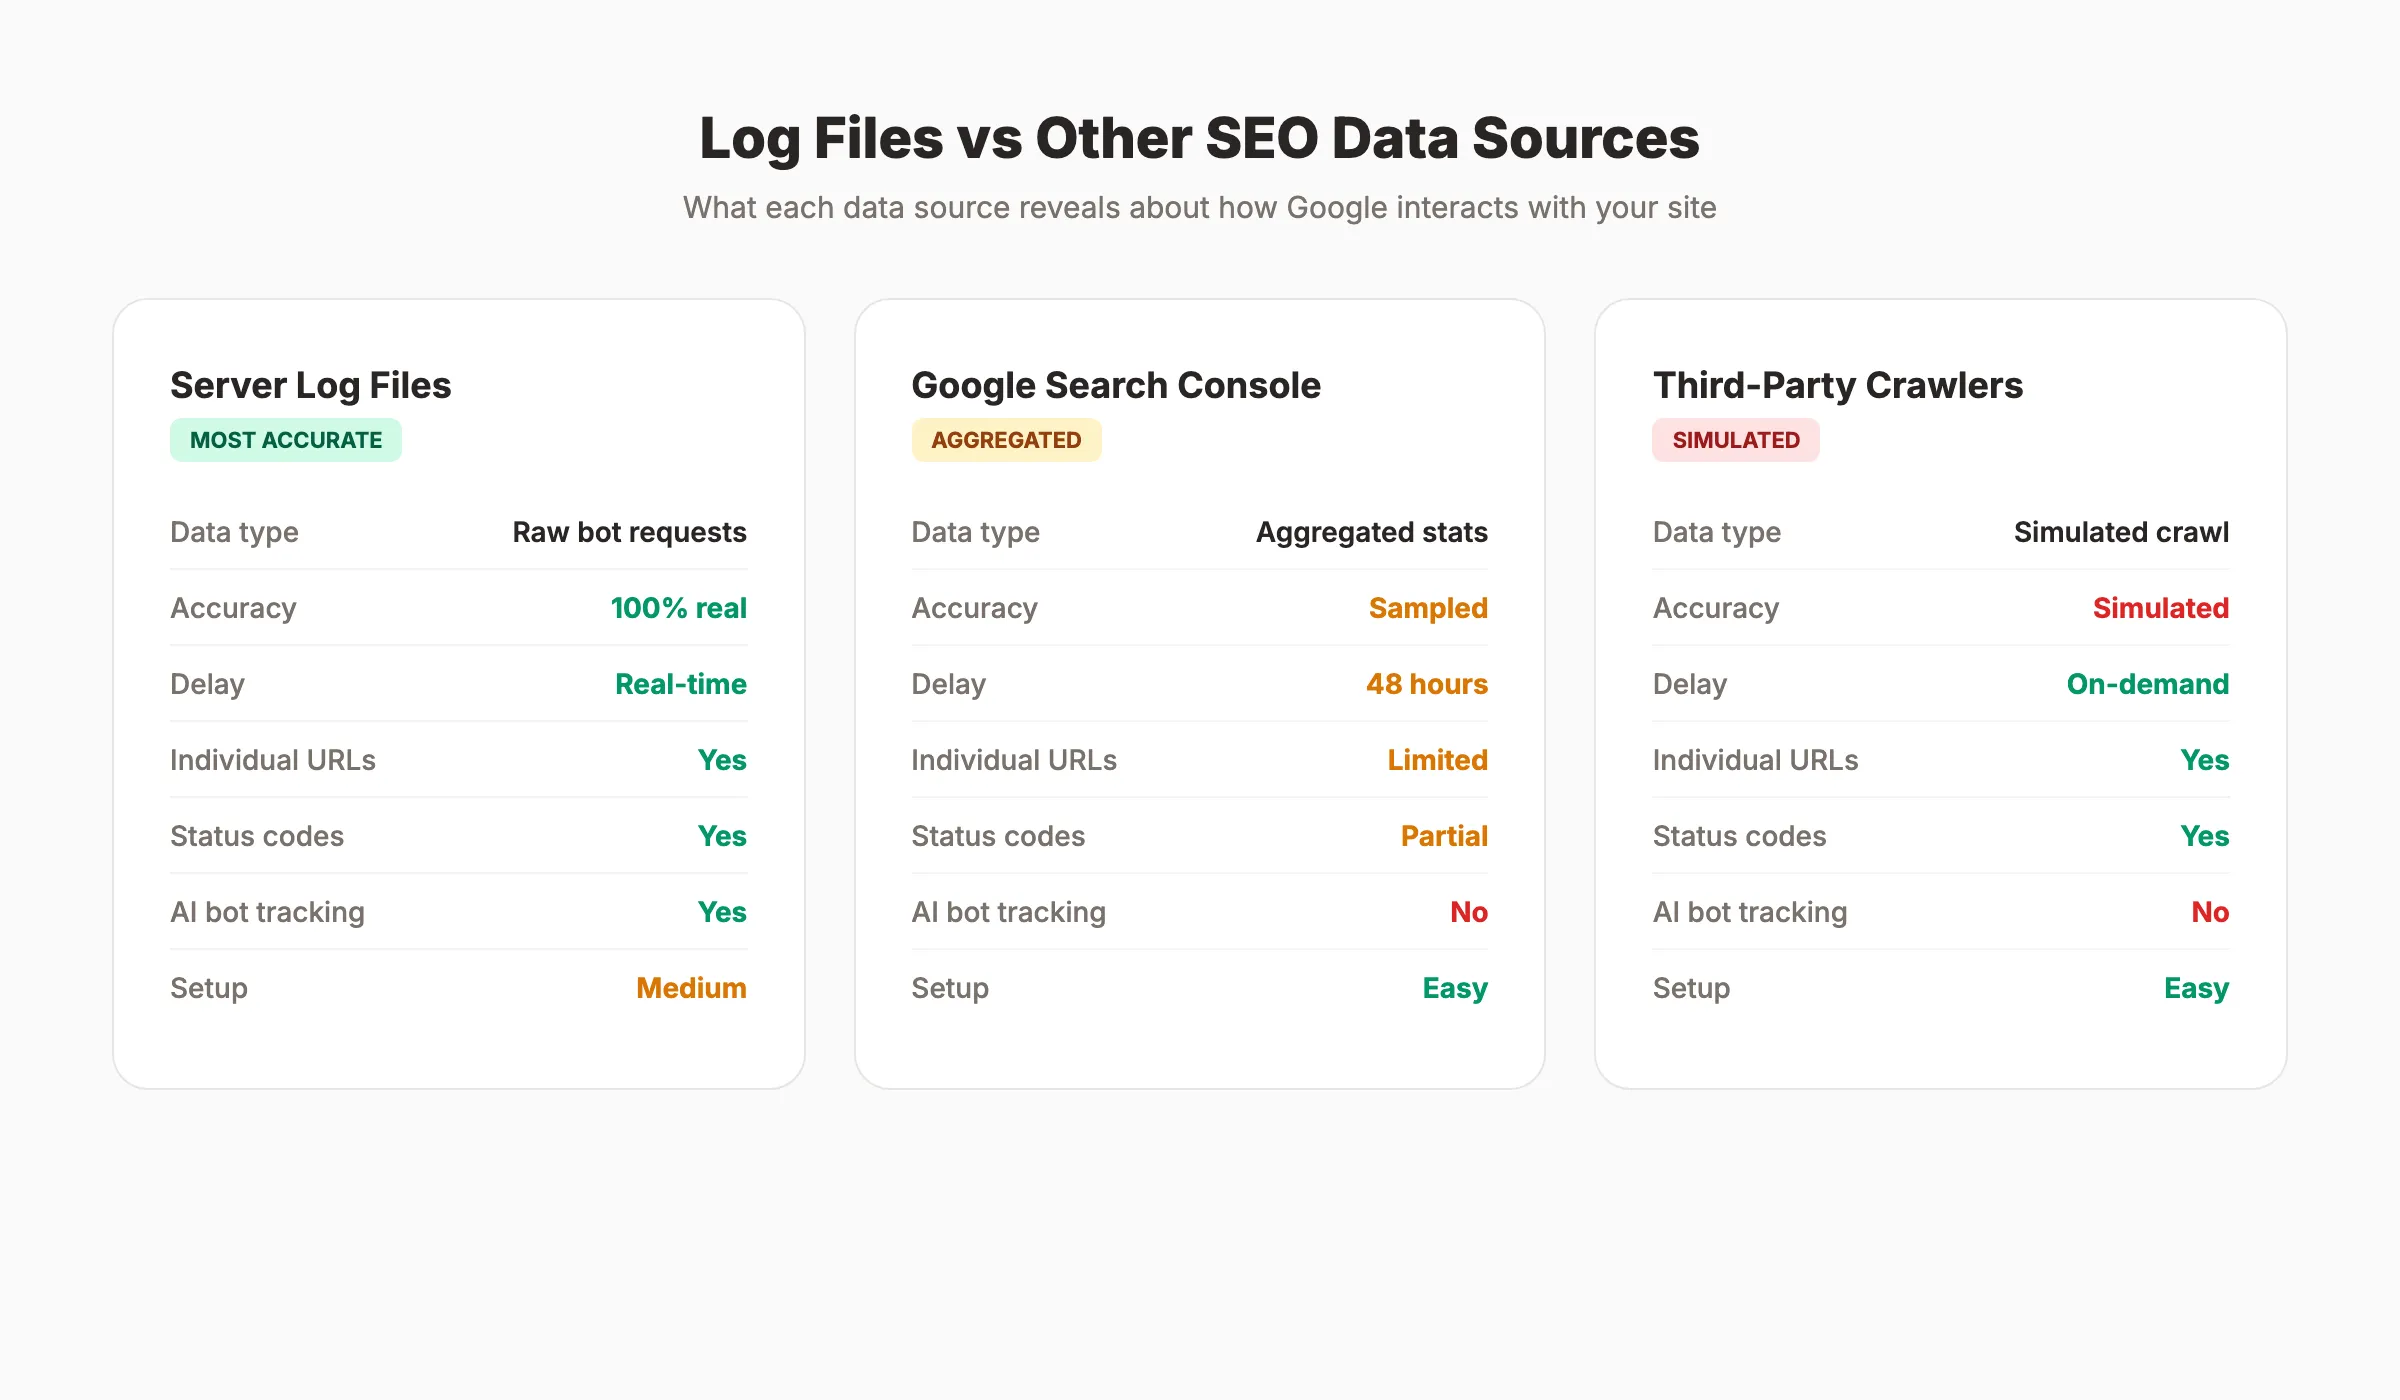
Most SEO teams never look at their server logs. They rely on Google Search Console, third-party crawlers, and ranking trackers. Those tools show what Google reports. Log files show what Google actually does.
The gap between the two is where hidden problems live. Crawl budget wasted on 404 pages. Important URLs that Googlebot has not visited in 90 days. AI bots like GPTBot hitting your server 48,000 times in a single month. None of this shows up in your standard SEO dashboard.
Log file analysis for SEO is the process of reading your server access logs to see exactly how search engine crawlers interact with your site. Every request, every status code, every URL. Raw, unfiltered truth about what gets crawled and what gets ignored.
We have published 3,500+ blog posts across 70+ industries. Every technical SEO audit we run starts with log file data. It is the single most underused technique in SEO, and this guide covers everything you need to start using it.
Here is what you will learn:
- What server log files contain and why they matter for SEO
- How to access and prepare log files for analysis
- What Googlebot behavior reveals about your site health
- How to identify crawl budget waste and fix it
- How to track AI bot activity on your site
- The best log file analysis tools and how to choose one
- How to turn log insights into ranking improvements
What Are Server Log Files?
Every time a browser, bot, or crawler requests a page from your server, the server records that request in a log file. This happens for every single hit. Human visitors, Googlebot, Bingbot, GPTBot, and hundreds of other user agents all generate log entries.
A typical log entry looks like this:
66.249.66.1 - - [29/Mar/2026:10:15:32 +0000] "GET /blog/seo-tips HTTP/1.1" 200 8452 "-" "Googlebot/2.1"
That single line tells you:
| Field | Value | What It Means |
|---|---|---|
| IP address | 66.249.66.1 | The crawler’s IP (Google’s range) |
| Timestamp | 29/Mar/2026:10:15:32 | Exact date and time of the request |
| Request | GET /blog/seo-tips | The URL that was requested |
| Status code | 200 | Server response (200 = success) |
| Bytes | 8452 | Size of the response |
| User agent | Googlebot/2.1 | Which bot made the request |
Most hosting platforms store these logs automatically. Apache servers use the Combined Log Format. Nginx uses a similar structure. Cloud platforms like AWS, Cloudflare, and Vercel store logs in their own dashboards or export formats.
Why Log Files Beat Other Data Sources
Third-party crawl tools simulate bot behavior. They guess what Googlebot sees. Log files record what Googlebot actually requests.
Google Search Console shows aggregated crawl stats with a 48-hour delay. Log files show individual requests in real time. GSC tells you “Google crawled 500 pages yesterday.” Log files tell you which 500 pages, in what order, at what speed, and what status codes they received.
This distinction matters for diagnosing indexing problems. When a page is not appearing in search results, there are two possible causes: Google is not crawling it, or Google is crawling it but choosing not to index it. Log files answer the first question definitively.
How to Access Your Server Log Files
Getting your hands on log files depends on your hosting setup. The process varies, but the data is always there.
Shared Hosting and cPanel
Most shared hosting providers store logs in a /logs or .logs directory. Open your cPanel file manager. Look for “Raw Access Logs” or “Metrics.” Download the access log file for your domain. Most hosts retain 30 days of data by default.
WordPress Hosting
Managed WordPress hosts like WP Engine, Kinsta, and SiteGround offer log access through their dashboards. WP Engine stores logs under “Access Logs” in the user portal. Kinsta provides log exports under “Analytics.” Check your host documentation for the exact path.
Cloud and CDN Platforms
AWS stores logs in S3 buckets via CloudFront. Cloudflare logs are available through Logpush (Enterprise plan) or the dashboard analytics. Vercel provides function logs through its CLI. Google Cloud uses Cloud Logging with BigQuery export options.
VPS and Dedicated Servers
Full server access gives you the most control. Apache logs typically live at /var/log/apache2/access.log. Nginx logs live at /var/log/nginx/access.log. Use scp, rsync, or your server panel to download them.
How Much Data Do You Need?
A minimum of 30 days gives you a solid baseline. For large sites with seasonal traffic, 90 days provides more context. Sites with fewer than 1,000 pages can work with 7 to 14 days of data.
The file sizes can be large. A site with 50,000 daily visitors generates roughly 500 MB of log data per month. Plan your storage and processing accordingly.
Stop guessing what Google sees. Stacc publishes 30 SEO articles per month and monitors technical SEO signals automatically. Start for $1 →
How to Prepare Log Files for Analysis
Raw log files contain every request, not just search engine crawlers. Before analysis, you need to filter and structure the data.
Step 1: Filter for Bot Traffic Only
Remove all human visitor entries. You only want search engine and AI bot requests. Filter by user-agent strings:
| Bot | User-Agent String |
|---|---|
| Googlebot | Googlebot/2.1 |
| Googlebot Mobile | Googlebot-Mobile |
| Google Images | Googlebot-Image/1.0 |
| Bingbot | bingbot/2.0 |
| GPTBot (OpenAI) | GPTBot/1.0 |
| ClaudeBot (Anthropic) | ClaudeBot/1.0 |
| PerplexityBot | PerplexityBot |
| Amazonbot | Amazonbot |
Keep entries from these bots. Discard everything else.
Step 2: Verify Bot Identity
Not every request claiming to be Googlebot is actually from Google. Spammers and scrapers fake user-agent strings. Verify legitimacy by checking IP addresses against Google’s published IP ranges. The Screaming Frog Log File Analyser does this automatically. You can also run a reverse DNS lookup on suspicious IPs.
Step 3: Structure the Data
Parse each log line into columns: timestamp, IP, URL, status code, bytes, user agent. Most log analysis tools handle this parsing automatically. If you are working in a spreadsheet, use text-to-columns to split each field.
Step 4: Remove Static Assets
Filter out requests for CSS, JavaScript, images, and font files unless you specifically need to audit resource crawling. Focus on HTML page requests. This reduces noise and makes patterns easier to spot.
How to Analyze Googlebot Crawl Behavior
This is where log file analysis for SEO delivers its highest value. Googlebot crawl patterns reveal exactly what Google thinks about your site.
Crawl Frequency by URL
Group all Googlebot requests by URL. Sort by crawl count. The pages Google crawls most frequently are the pages it considers most important. Compare this list against your actual priority pages.
Red flags to watch for:
- High-priority pages with zero crawls. If your money pages are not getting crawled, they cannot rank. Check for internal linking issues, noindex tags, or robots.txt blocks.
- Low-value pages with high crawl counts. Faceted navigation, parameter URLs, internal search results, and paginated archives often consume 30 to 50% of total crawl budget. One retailer found that 95% of its crawl budget went to error pages and non-indexable URLs.
- Orphaned pages getting crawled. Pages with no internal links that still receive crawl visits. Google found them through old sitemaps or external links, but they are disconnected from your site structure.
Crawl Frequency Over Time
Plot daily Googlebot hits over your 30-day window. A healthy site shows consistent, steady crawling. Sudden drops indicate server issues, robots.txt changes, or penalties. Sudden spikes often follow sitemap submissions or major content updates.
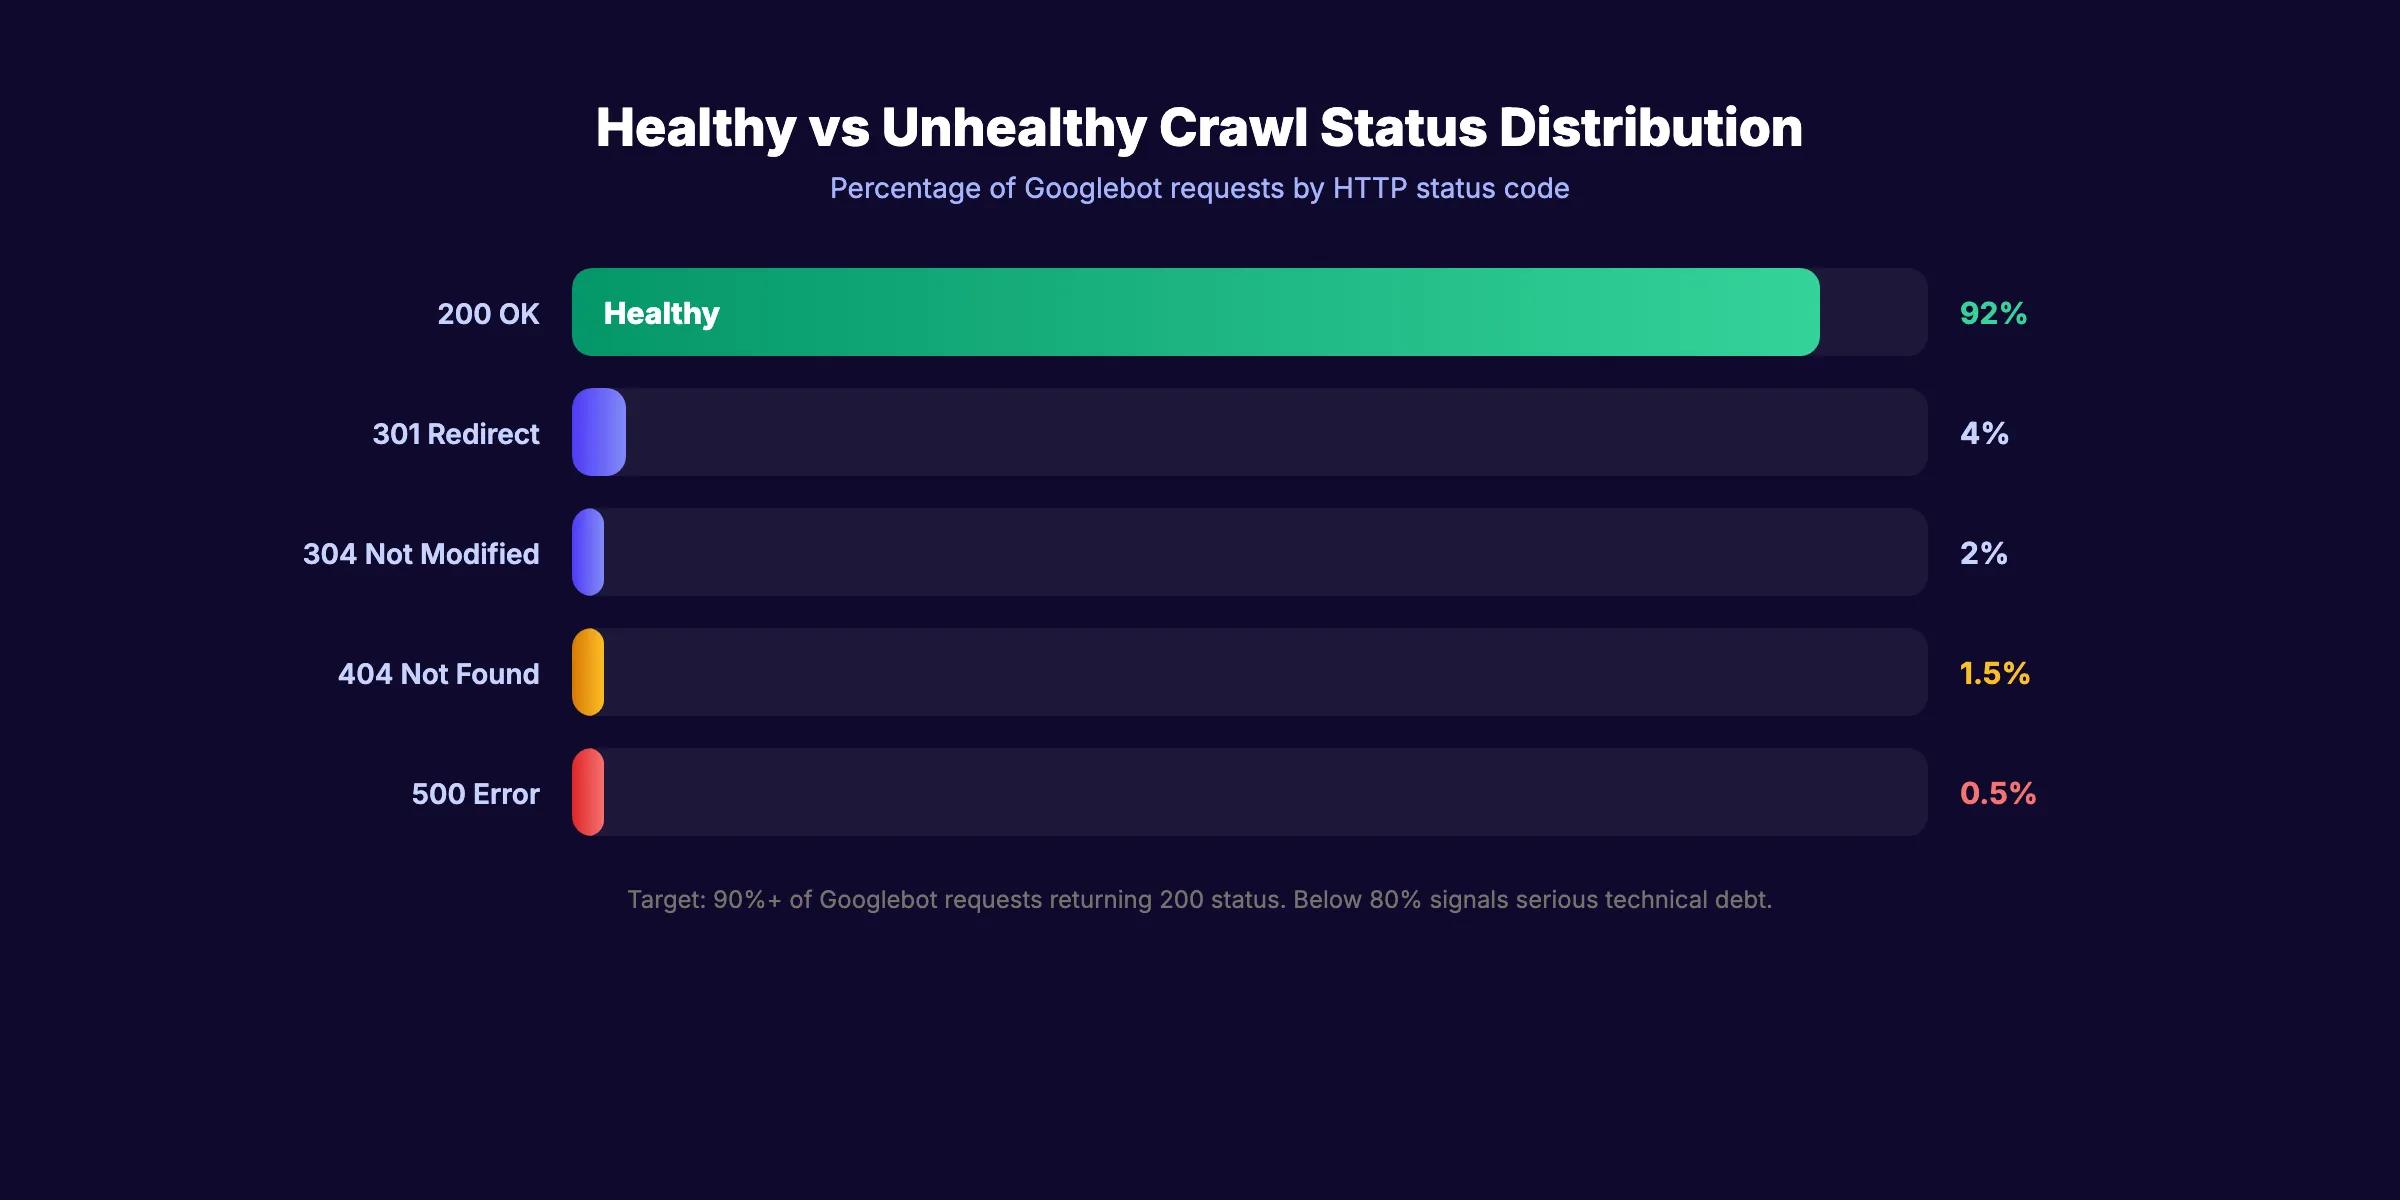
Status Code Distribution
Group all crawled URLs by HTTP status code:
| Status Code | Meaning | Action |
|---|---|---|
| 200 | Success | Good. Verify the content is correct. |
| 301 | Permanent redirect | Update internal links to point to the final URL. |
| 302 | Temporary redirect | Convert to 301 if the redirect is permanent. |
| 304 | Not modified | Normal. The page has not changed since the last crawl. |
| 404 | Not found | Fix or redirect broken URLs. |
| 410 | Gone | Intentional removal. Google will de-index faster. |
| 500 | Server error | Fix immediately. Repeated 500s reduce crawl rate. |
| 503 | Service unavailable | Temporary. If persistent, investigate server load. |
A healthy site returns 200 for 90%+ of Googlebot requests. Anything below 80% signals serious technical debt.
How to Optimize Crawl Budget With Log Data
Google allocates limited crawling resources to every website. Large sites with 10,000+ pages need to manage this budget carefully. Log files show exactly where those resources go.
Identify Crawl Waste
Crawl waste happens when Googlebot spends time on URLs that do not belong in the index. Common culprits:
- Parameter URLs:
/products?sort=price&page=3and its 500 variations - Faceted navigation:
/shoes?color=red&size=10&brand=nike - Internal search results:
/search?q=blue+widget - Tag and archive pages:
/tag/seoand/author/admin/page/47 - Soft 404s: Pages that return a 200 status but display “no results found”
Fix Crawl Waste
Once you identify the waste, apply these fixes in order:
- Block non-indexable URL patterns in robots.txt. Use
Disallowrules for parameter URLs and internal search. This is the fastest fix. - Add canonical tags. Point parameter variations to the clean URL. This tells Google which version to index.
- Remove internal links to low-value pages. Every link to a faceted URL is a crawl invitation. Clean up your internal link structure.
- Submit an updated XML sitemap. Only include URLs you want indexed. Remove everything else.
- Use the URL Parameters tool in GSC. Tell Google how to handle specific parameters.
Measure the Impact
After implementing fixes, wait 2 to 4 weeks. Pull fresh log data and compare:
- Total Googlebot requests (should stay the same or increase)
- Requests to priority pages (should increase)
- Requests to blocked or non-indexable pages (should decrease)
- Average crawl rate (pages per day)
A successful crawl budget optimization shifts Googlebot attention from waste pages to revenue pages. The ranking impact follows within 60 to 90 days for most sites.
Your SEO team. $99 per month. 30 optimized articles, published automatically. No crawl waste in your content. Start for $1 →
How to Track AI Bot Activity in Log Files
AI crawlers are now a significant presence in server logs. GPTBot, ClaudeBot, PerplexityBot, and Amazonbot visit sites regularly to gather training data and power AI search results.
Why AI Bot Tracking Matters
One case study from Semrush found ChatGPT-User hitting a single site 48,000+ times across 7,000 URLs in 30 days. That is substantial server load. Without log analysis, the site owner had no idea it was happening.
AI bot traffic matters for two reasons:
- Server resources. Aggressive AI crawling consumes bandwidth and CPU cycles. High-traffic sites may need rate limiting to prevent performance degradation.
- AI search visibility. If you want your content cited in AI Overviews, ChatGPT, or Perplexity results, those bots need access. Blocking them means your content disappears from AI search results.
How to Analyze AI Bot Behavior
Filter your log files for AI bot user agents. For each bot, track:
- Total requests per day. Is the volume reasonable or excessive?
- URLs crawled. Are AI bots hitting your important content or wasting time on parameter pages?
- Crawl patterns. Do they respect your robots.txt directives?
- Response times. Are AI crawlers causing latency for real users?
How to Control AI Crawler Access
Use your robots.txt file to allow or block specific AI bots:
## Allow Googlebot (required for search)
User-agent: Googlebot
Allow: /

## Allow GPTBot (for AI Overview visibility)
User-agent: GPTBot
Allow: /

## Block aggressive crawlers
User-agent: CCBot
Disallow: /
Read the full guide on managing AI crawlers for detailed setup instructions.
How to Do Log File Analysis for SEO: Step-by-Step
Log file analysis feels intimidating until you reduce it to a repeatable process. Here is the exact sequence to follow with any site, from pulling the raw data to fixing the issues it surfaces.
Step 1: Access your server logs. Where your logs live depends on your setup. Apache stores access logs at /var/log/apache2/access.log. Nginx uses /var/log/nginx/access.log. cPanel hosts offer Raw Access Logs through the dashboard. Managed WordPress hosts like Kinsta and WP Engine provide log exports through their admin portals. Cloudflare logs require a Logpush configuration. Download at minimum 30 days of data — 90 days for larger sites with seasonal patterns.
Step 2: Filter for Googlebot user-agent specifically. Raw logs contain every request: human visitors, image requests, bots, crawlers, and scrapers. For SEO purposes, filter to keep only requests with Googlebot/2.1 in the user-agent field. Also retain Googlebot-Mobile and Googlebot-Image if you want to analyze mobile-first indexing and image crawl behavior separately. Discard all other entries.
Step 3: Look at crawl frequency by URL. Group all Googlebot requests by URL and sort by request count. The pages Google crawls most are the ones it values most. Compare this list to your actual priority pages — product pages, service pages, money pages. A mismatch between what Google crawls most and what you care about most is the central diagnosis log analysis provides.
Step 4: Identify crawl budget waste. Look for URL patterns that consume crawl budget without adding index value. Typical offenders include faceted navigation URLs (/shoes?color=red&size=10), paginated archive pages beyond page 3 or 4, internal search result pages (/search?q=keyword), and tag or author archive pages on thin content. One retailer discovered that URL parameter variants were consuming over 60% of their daily crawl budget, leaving new product pages waiting days to be indexed.
Step 5: Check crawl patterns over time. Plot daily Googlebot request volume across your 30-day window. A steady baseline with occasional spikes (after a sitemap submission or major update) is normal. A sudden sustained drop in crawl rate often signals a robots.txt change that blocked too aggressively, a server availability problem, or a manual or algorithmic penalty. A drop in crawl rate typically precedes a drop in rankings by 2–4 weeks — catching it early matters.
Step 6: Compare crawled URLs against your priority pages. Pull a list of your top 50–100 most important URLs (use revenue, conversion data, or your editorial priority list). Cross-reference against your filtered Googlebot log. If important URLs appear with zero crawls over 30 days, investigate: check for accidental noindex tags, robots.txt blocks, or missing internal links. Pages Google cannot crawl cannot rank.
Step 7: Fix the top issues. After diagnosing, act on findings in this order. First, block non-indexable URL patterns in robots.txt using Disallow rules for parameter URLs and thin archive pages. Second, fix redirect chains — every chain step (301 → 301 → 301) wastes crawl budget; flatten to a single hop. Third, remove or noindex low-value pages consuming crawl budget. Fourth, add internal links from high-authority pages to important URLs that are not getting crawled. Fifth, submit a cleaned XML sitemap containing only indexable URLs.
Step 8: Re-check after 4–6 weeks. Pull a fresh log export and run the same analysis. Measure whether priority pages now receive more frequent crawling and whether crawl budget waste URLs show reduced request counts. For most sites, a well-executed crawl budget optimization shifts meaningful crawl volume to priority pages within 4–8 weeks. The ranking impact follows 4–8 weeks after that as Google re-evaluates the newly prioritized pages.
Best Log File Analysis Tools for SEO
The right tool depends on your site size and technical resources. Here are the most widely used options, from entry-level to enterprise.
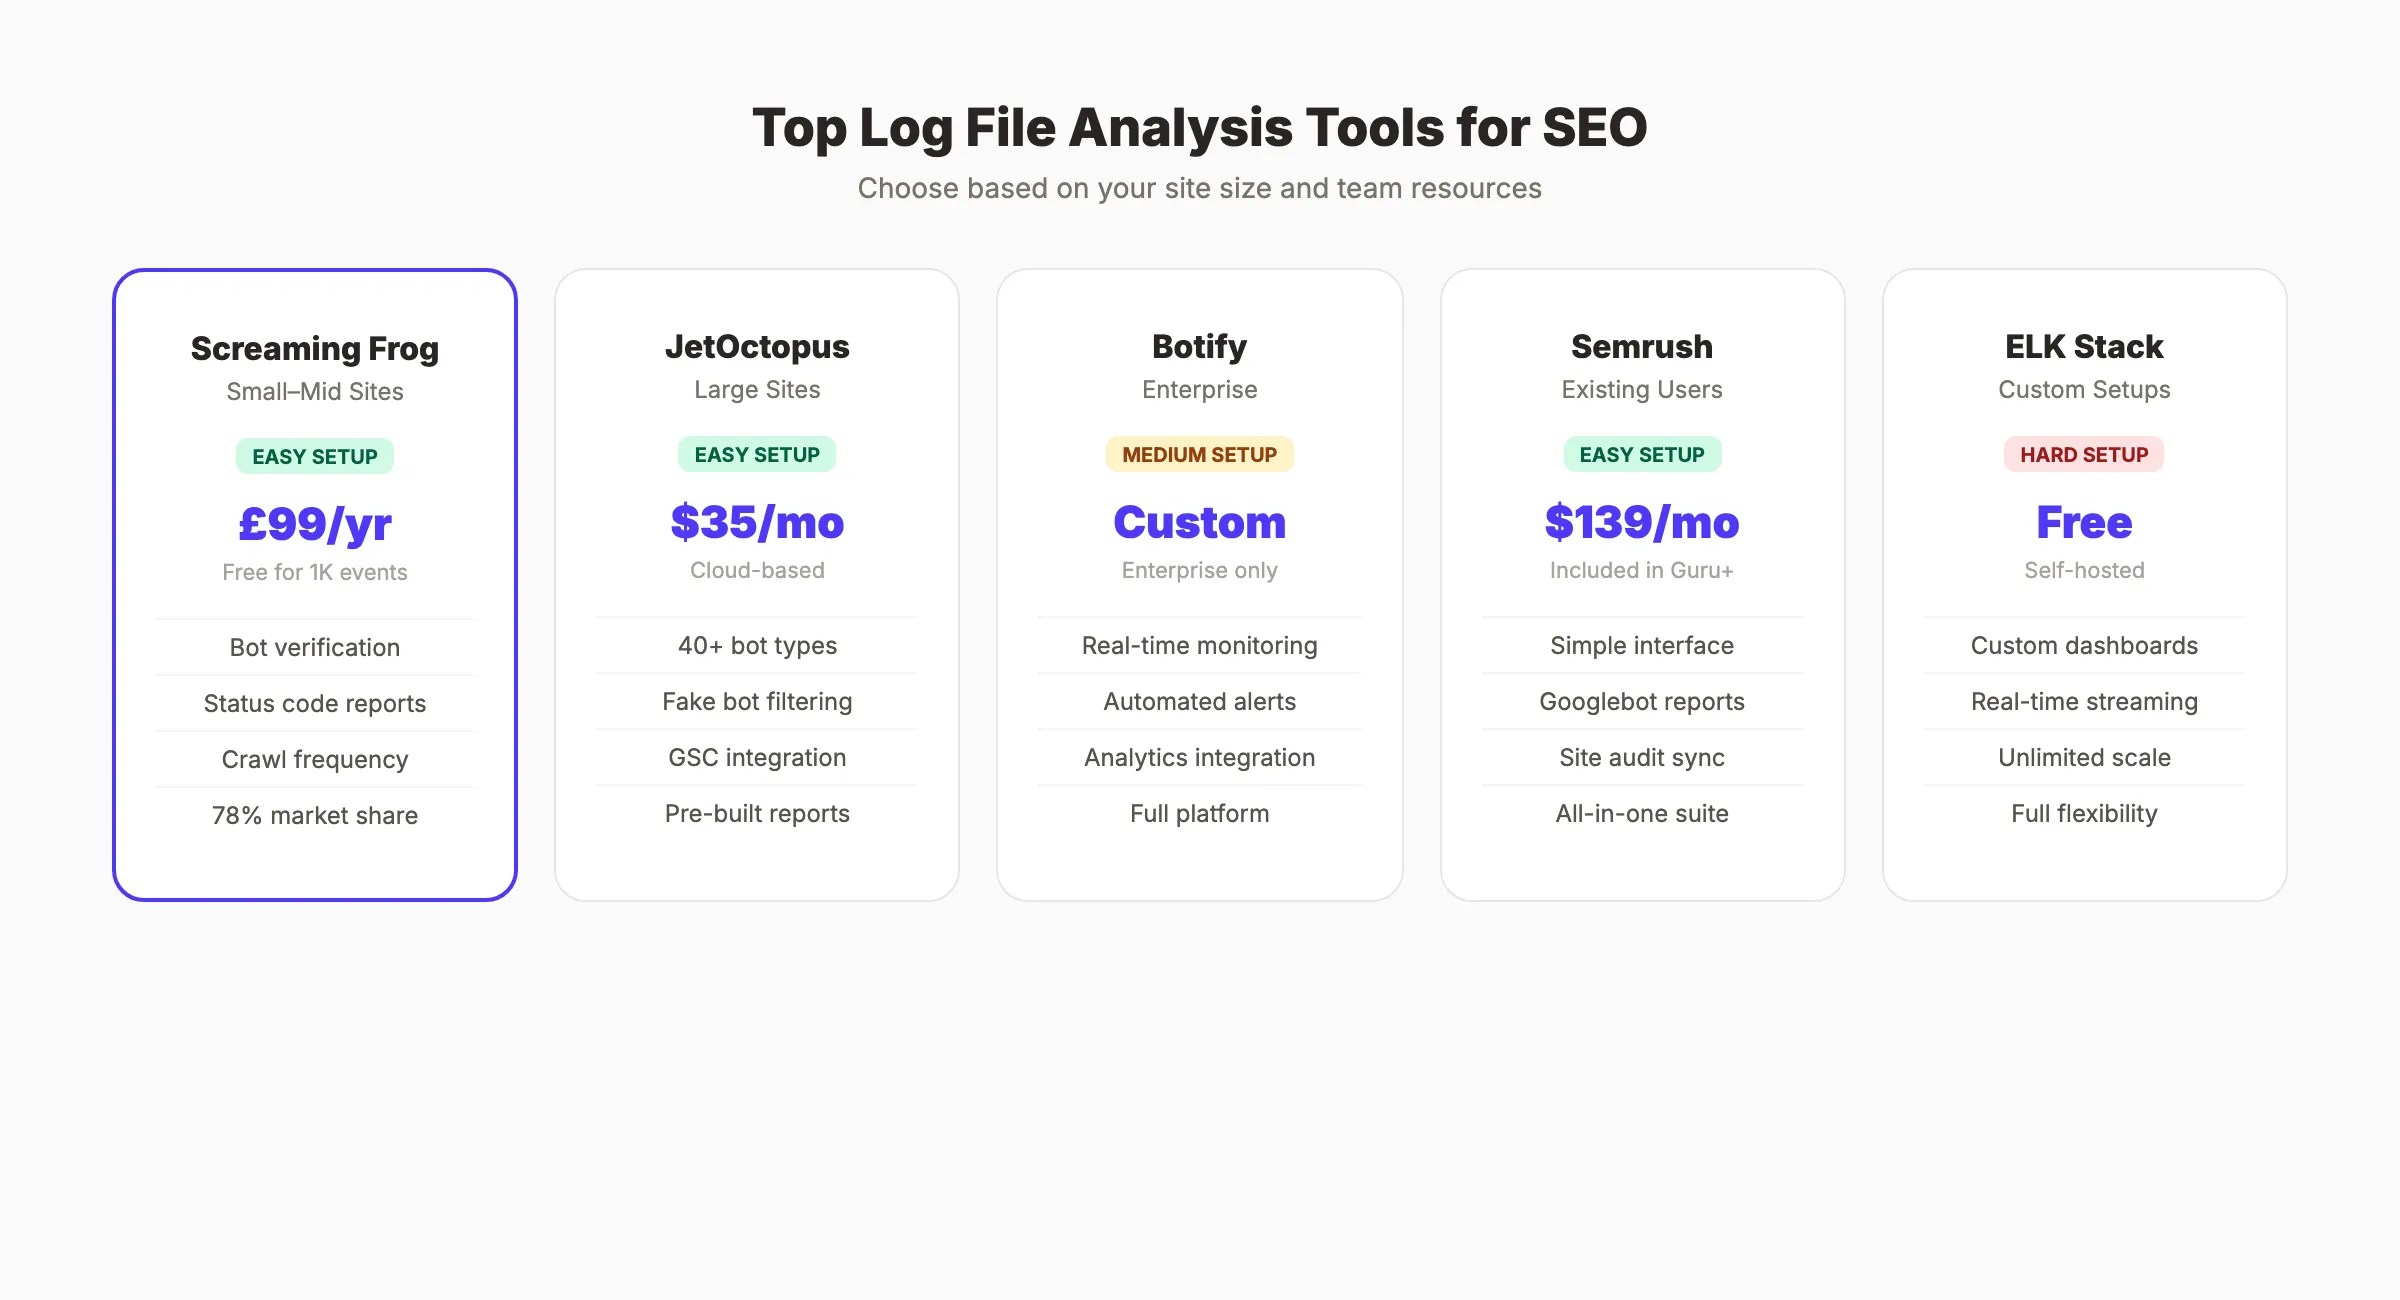
Screaming Frog Log File Analyser is the most widely adopted dedicated log analysis tool in the SEO industry. It is a desktop application that parses log files locally, handles bot verification by checking IPs against published ranges, and produces clear reports on crawl frequency, status code distribution, and URL patterns. The free version handles up to 1,000 log events. The paid version costs £259 per year and handles unlimited data. For most small to mid-size sites, it is the practical first choice.
Botify is an enterprise crawl intelligence platform that combines log analysis, technical crawling, and keyword data in one system. It monitors logs in near-real time and can alert you to crawl rate drops, emerging error patterns, or new AI bot activity before they affect rankings. Pricing is custom and positioned at large enterprise sites. It is overkill for sites under 500,000 pages but genuinely powerful above that threshold.
JetOctopus is a cloud-based log analyzer built specifically for sites with 100,000+ pages. It integrates directly with most hosting platforms, analyzes over 40 bot types, filters fake user agents, and lets you combine log data with Google Search Console data in one dashboard. Pricing starts at $35/mo, making it significantly more affordable than Botify for mid-market sites.
Splunk / ELK Stack (Elasticsearch, Logstash, Kibana) are developer-oriented solutions for teams that need custom dashboards, real-time streaming, or very large data volumes. The ELK Stack is free to self-host. Splunk charges based on data volume. Both require technical setup that most SEO teams will need engineering support to configure, but they offer flexibility that purpose-built SEO tools cannot match.
Google Cloud Logging is the natural choice if your site is already hosted on Google Cloud Platform. It stores, queries, and exports server logs natively within the GCP console. BigQuery integration enables SQL-based analysis of log data at scale. If your infrastructure already runs on GCP, this avoids adding a separate tool entirely.
| Tool | Best For | Price | Setup Difficulty |
|---|---|---|---|
| Screaming Frog Log File Analyser | Small to mid sites | £259/year | Easy |
| JetOctopus | Mid-market (100k+ pages) | $35/mo | Easy |
| Botify | Enterprise | Custom | Medium |
| ELK Stack | Custom / developer-led | Free (self-hosted) | Hard |
| Google Cloud Logging | GCP-hosted sites | Usage-based | Medium |
Best Log File Analysis Tools
You do not need to read raw log files in a text editor. Dedicated tools parse, filter, and visualize the data for you.
Screaming Frog Log File Analyser
The most widely used tool in the industry. 78% of technical SEOs use Screaming Frog for log analysis according to the State of Technical SEO report.
- Pricing: Free for 1,000 log events. 99 GBP per year for unlimited.
- Strengths: Bot verification, status code reports, crawl frequency charts, integration with the Screaming Frog SEO Spider.
- Best for: Small to mid-size sites. Desktop-based processing.
JetOctopus
Cloud-based log analyzer built for large sites. Two-click integration with most hosting platforms.
- Pricing: Starts at $35 per month.
- Strengths: Analyzes 40+ bot types, filters fake bots, combines log data with GSC data, pre-built issue reports.
- Best for: Enterprise sites with 100,000+ pages.
Botify
Enterprise-grade platform that combines crawling, log analysis, and keyword data.
- Pricing: Custom (enterprise only).
- Strengths: Real-time log monitoring, automated alerts, deep integration with analytics platforms.
- Best for: Large enterprises with dedicated SEO teams.
Semrush Log File Analyzer
Part of the Semrush suite. Upload log files directly through the dashboard.
- Pricing: Included with Semrush Guru ($139.95 per month) and Business plans.
- Strengths: Simple interface, Googlebot activity reports, integration with Semrush site audit.
- Best for: Teams already using Semrush for SEO.
ELK Stack (Elasticsearch, Logstash, Kibana)
Open-source stack for custom log analysis. Requires technical setup but offers unlimited flexibility.
- Pricing: Free (self-hosted). Elastic Cloud starts at $95 per month.
- Strengths: Custom dashboards, real-time streaming, handles massive log volumes.
- Best for: Engineering teams with DevOps resources.
| Tool | Best For | Price | Setup Difficulty |
|---|---|---|---|
| Screaming Frog | Small to mid sites | 99 GBP/year | Easy |
| JetOctopus | Large sites | $35/month | Easy |
| Botify | Enterprise | Custom | Medium |
| Semrush | Existing users | $139.95/month | Easy |
| ELK Stack | Custom setups | Free (self-hosted) | Hard |
How to Turn Log Insights Into Ranking Improvements
Data without action is a wasted SEO audit. Here is how to translate log file findings into measurable ranking gains.
Priority 1: Fix Crawl Errors
Every 404 and 500 error in your logs is a missed opportunity. Redirect broken URLs to relevant live pages using 301 redirects. Fix server errors immediately. Monitor logs weekly to catch new errors before they accumulate.
Priority 2: Recover Orphaned Pages
Pages that Googlebot finds through old sitemaps or external links but that have zero internal links are orphaned. They rank poorly because Google cannot determine their importance. Add internal links from relevant content. Update your sitemap to reflect your current site structure.
Priority 3: Redirect Crawl Budget
After removing waste URLs, guide Googlebot toward your priority pages. Strengthen internal linking to money pages. Submit a cleaned-up sitemap with only indexable URLs. Update robots.txt to block parameter URLs and low-value paths.
Priority 4: Validate Site Migrations
Log files are essential during site migrations. Compare pre-migration and post-migration crawl patterns. Verify that old URLs return proper 301 redirects. Confirm that new URLs receive consistent crawl visits. A successful migration shows redirected URLs losing crawl volume while new URLs gain it.
Priority 5: Monitor Ongoing Health
Set up monthly log reviews. Track these metrics:
- Total Googlebot requests per day (trend line)
- Percentage of 200 status responses
- Percentage of crawl budget on priority pages
- Average time between crawls for key pages
- AI bot request volume and patterns
Consistent monitoring catches problems early. A sudden drop in crawl rate often precedes a ranking drop by 2 to 4 weeks. Catching it in the logs gives you time to fix the issue before traffic suffers.
3,500+ blogs published. 92% average SEO score. See what Stacc can do for your site. Start for $1 →
FAQ
What is log file analysis in SEO?
Log file analysis is the process of reviewing server access logs to understand how search engine crawlers actually interact with your site. It records every URL request, the HTTP status code returned, the timestamp, and the user agent making the request. For SEO, filtering these logs to Googlebot traffic reveals which pages get crawled, how often, and whether crawl budget is being spent on URLs that add no ranking value.
How do I find my server log files?
The location depends on your hosting setup. Apache servers store logs at /var/log/apache2/access.log. Nginx uses /var/log/nginx/access.log. cPanel hosts provide Raw Access Logs through the dashboard. Managed WordPress hosts like Kinsta and WP Engine offer log exports through their admin portals. Cloud platforms like AWS, Cloudflare, and Google Cloud have their own log storage and export interfaces — check the platform documentation for the exact path.
What is Googlebot’s normal crawl frequency?
There is no universal baseline — it varies by site size, authority, and update frequency. Google adjusts its crawl rate based on how often your content changes and how much server load it observes. A fast-loading, frequently updated site with strong authority will be crawled more often. For most small to mid-size sites, priority pages get crawled every 3–7 days. Breaking news sites and large ecommerce catalogs may see daily crawls on key pages. Your log files will show you the actual cadence for your specific site.
Can log file analysis improve crawl budget?
Yes, and it is often the most direct way to do it. Log analysis reveals exactly where Googlebot spends its crawl allocation. By identifying and blocking non-indexable URL patterns in robots.txt, fixing redirect chains, removing internal links to low-value pages, and submitting a cleaned sitemap, you redirect Googlebot’s attention toward the URLs that matter for rankings. The impact is typically visible in logs within 2–4 weeks and in rankings 4–8 weeks after that.
Do small websites need log file analysis?
For sites with fewer than 500 pages and no complex URL architecture (no faceted navigation, no parameter URLs, no large archives), log file analysis has limited incremental value. Standard crawl tools and Search Console provide sufficient diagnostic coverage at that scale. Log analysis becomes genuinely valuable when a site has more pages than Google crawls in a given day, has complex URL structures that could waste crawl budget, or is experiencing unexplained ranking or indexing problems that other data sources cannot explain.
Log file analysis separates reactive SEO from proactive SEO. Every ranking problem leaves a trace in your logs. The teams that read those traces fix issues before they become traffic losses. Start with 30 days of data, filter for bot traffic, and let the logs tell you what your site really needs.
Related Tools & Resources
Free SEO Tools:
Best Lists:

Written by
Siddharth GangalSiddharth is the founder of theStacc and Arka360, and a graduate of IIT Mandi. He spent years watching great businesses lose organic traffic to competitors who simply published more. So he built a system to fix that. He writes about SEO, content at scale, and the tactics that actually move rankings.
30 SEO blog articles published every month
Keyword-optimized, scheduled, and live on your site. Automatically.
30-day trial · Cancel anytime
theStacc
Stop writing SEO content manually
30 blog articles, 30 GBP posts, and social media content. Published every month. Automatically.
Start Your $1 Trial$1 for 3 days · Cancel anytime