35 SEO ROI Statistics for 2026 (Industry Data)
35 SEO ROI statistics for 2026 with industry benchmarks, SEO vs PPC data, and timeline projections. All sourced and verified. Updated March 2026.
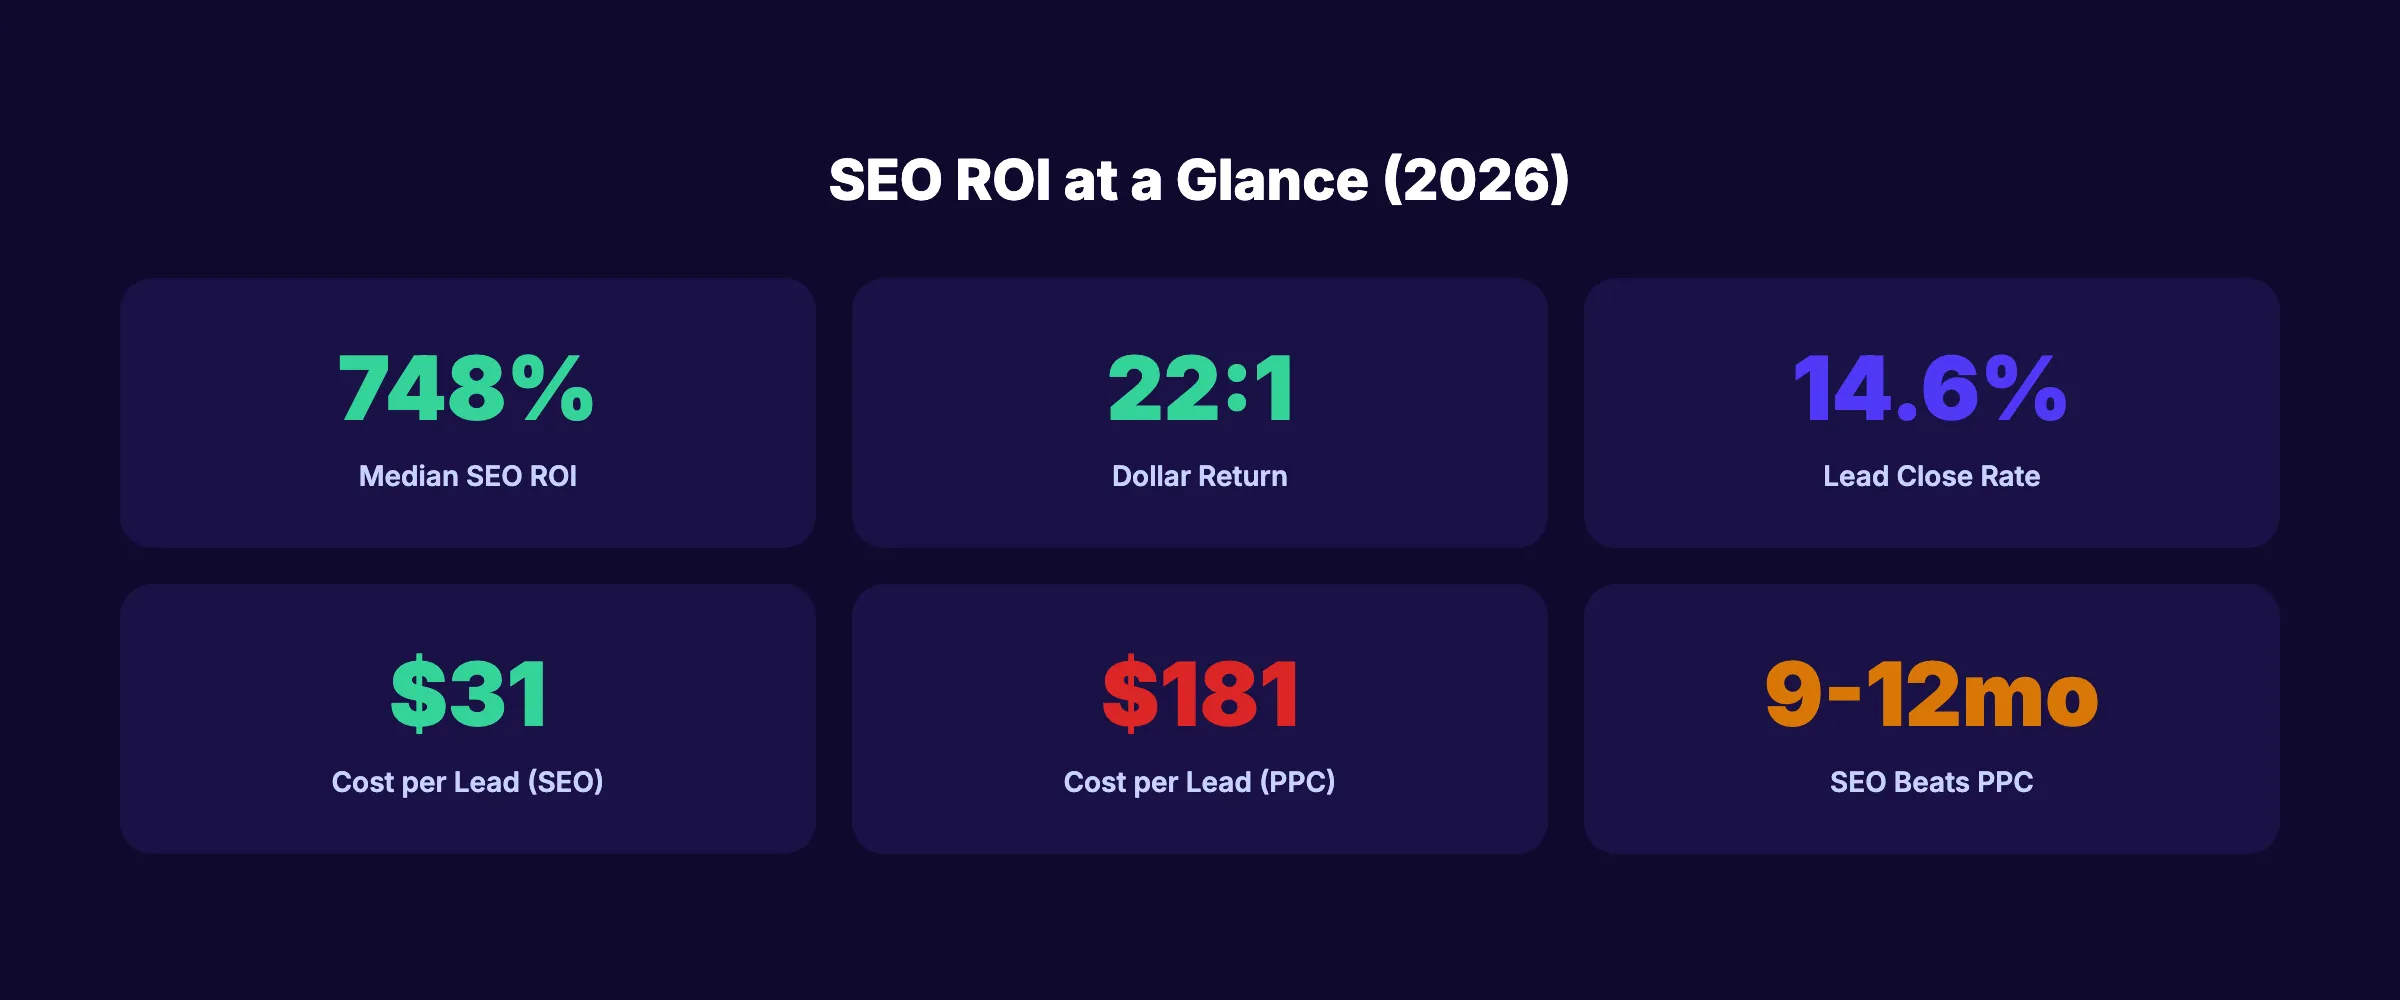
The median SEO ROI is 748%. That means businesses earn $7.48 for every $1 invested in SEO. The average across all industries is even higher at 22:1. SEO leads close at 14.6% compared to 1.7% for outbound marketing.
Every marketing budget conversation starts with the same question: what is the return? SEO ROI statistics answer that question with data, not opinions.
We compiled 35 SEO ROI statistics from First Page Sage, Ahrefs, HubSpot, and other primary research sources. Every stat is sourced and dated.
Here is what the data covers:
- Overall SEO return on investment benchmarks
- SEO ROI broken down by industry
- SEO vs PPC performance and cost comparisons
- Content marketing ROI and organic search revenue
- Budget allocation and investment trends
- Timeline to profitability and compounding effects
Overall SEO ROI Statistics
1. The median SEO ROI is 748%. (Source: First Page Sage, 2026) A thought leadership SEO campaign with 6-8 pages per month delivers the strongest returns. The 748% figure accounts for content creation, optimization, and link building costs.
2. The average SEO return is $22 for every $1 invested. (Source: SeoProfy, 2026) The 22:1 ratio makes SEO one of the highest-returning marketing channels available. Paid advertising averages $2 for every $1 invested by comparison.
3. SEO leads close at 14.6%. (Source: HubSpot, 2025) Outbound leads (cold calls, direct mail) close at just 1.7%. That is an 8.6x difference in close rate. SEO targets people actively searching for what you sell.
4. 49% of marketers identify organic search as the top ROI-driving channel. (Source: Genesys Growth, 2026) Organic search beats paid ads, social media, and email marketing as the highest-ROI channel in marketer surveys.
5. 88% of marketers maintain or increase SEO budgets year-over-year. (Source: SeoProfy, 2026) Budget confidence reflects consistent returns. Channels that do not deliver ROI lose budget. SEO keeps growing.
6. 60% of marketers say inbound strategies like SEO generate the highest-quality leads. (Source: HubSpot, 2025) Lead quality matters more than lead volume. SEO attracts buyers with purchase intent. Paid ads attract browsers.
7. Organic search drives 53.3% of all website traffic. (Source: BrightEdge, 2025) More than half of all website visits come from organic search. No other channel comes close.
SEO ROI by Industry
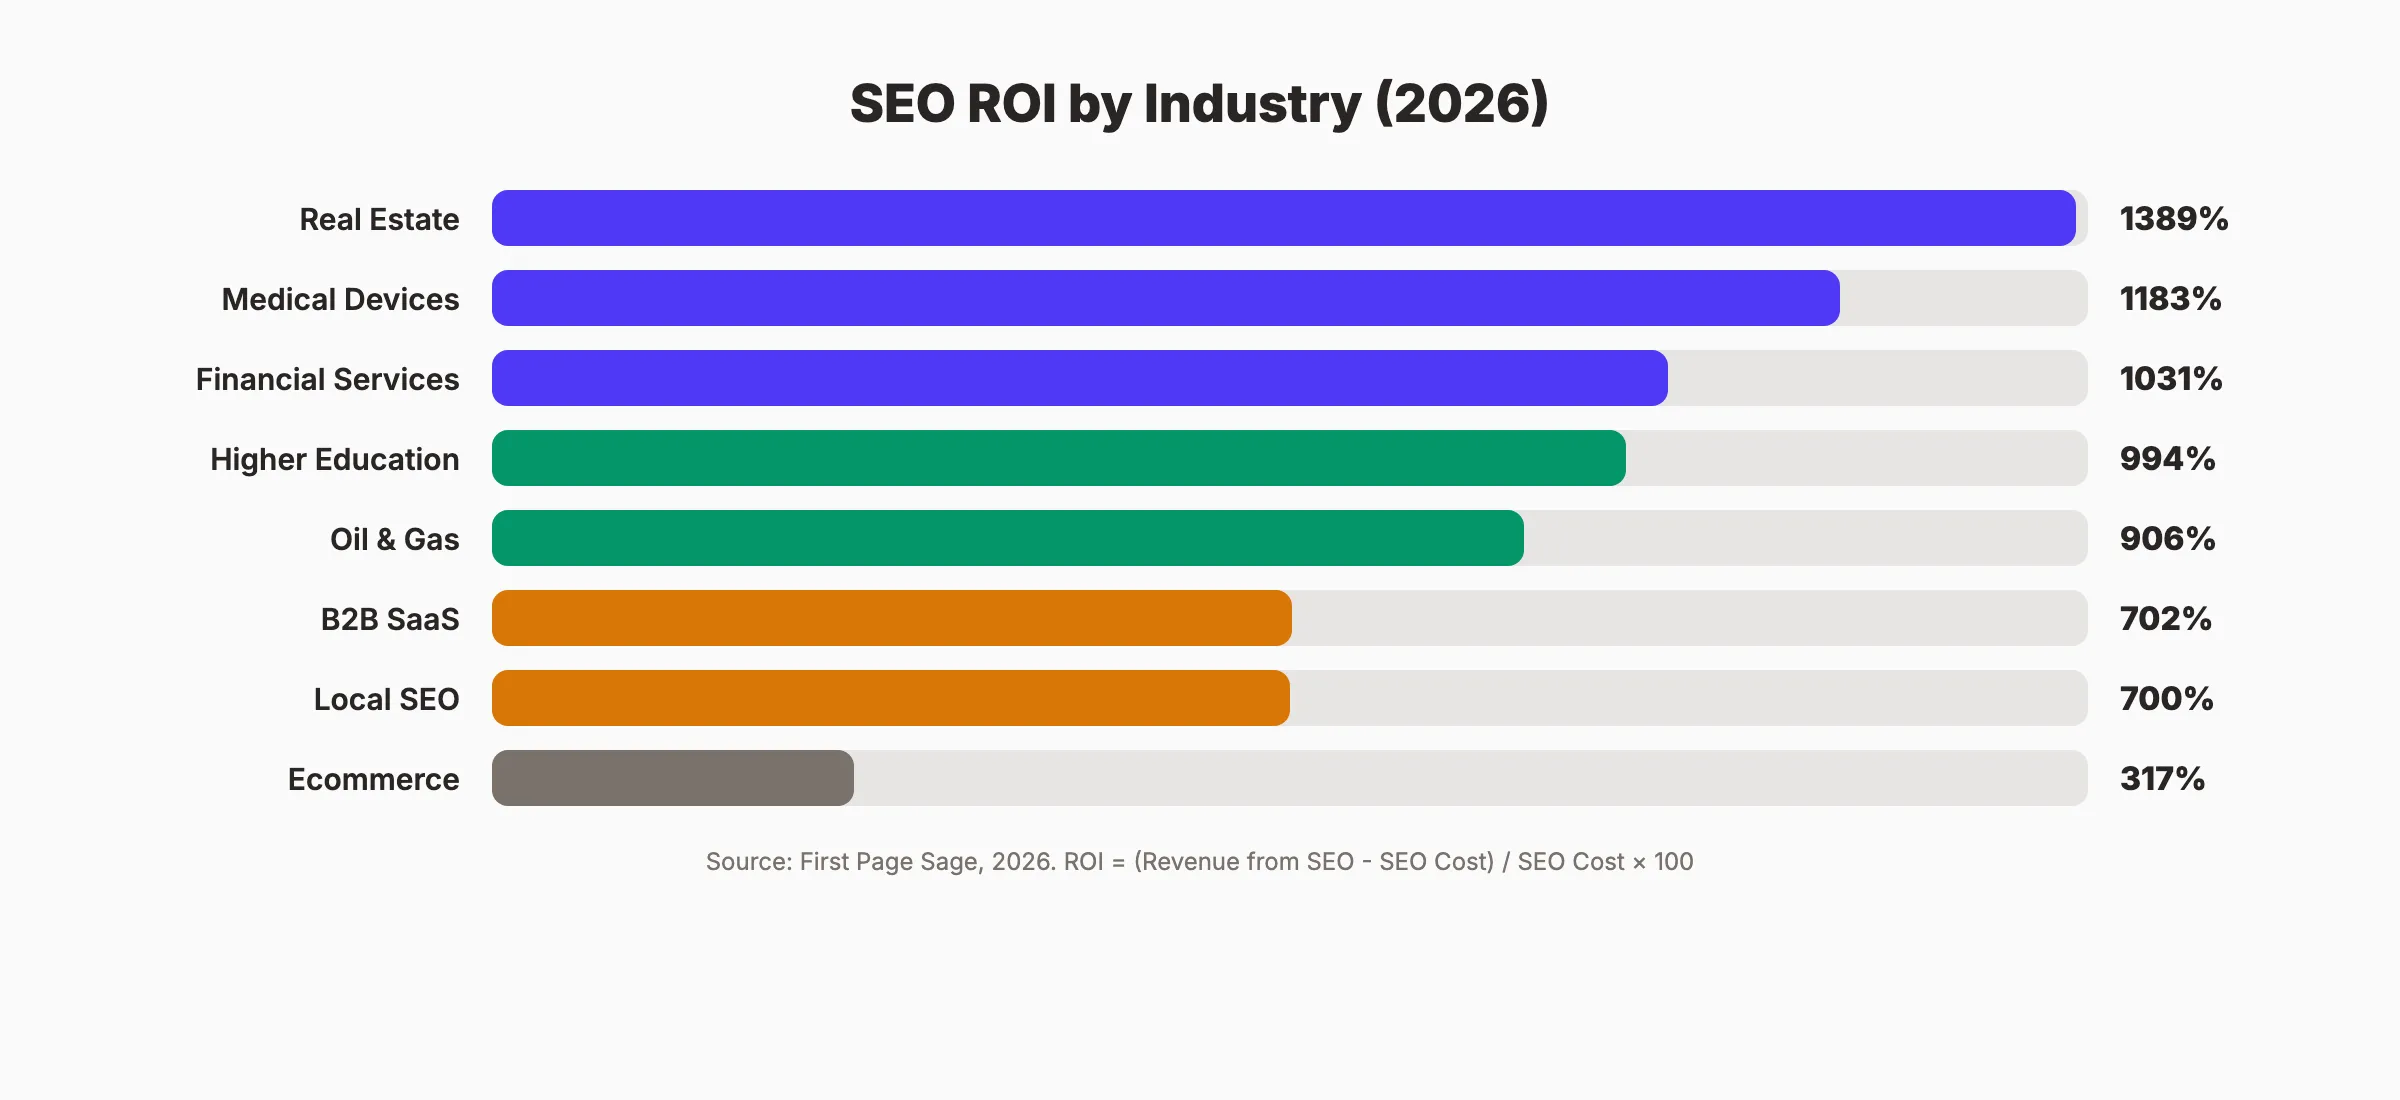
Different industries see dramatically different returns. High customer lifetime value industries earn the most from SEO.
8. Real estate SEO delivers 1,389% ROI. (Source: First Page Sage, 2026) The highest ROI of any industry measured. High transaction values ($200K+) and local search intent drive massive returns from ranking.
9. Medical devices achieve 1,183% SEO ROI. (Source: First Page Sage, 2026) Long sales cycles and high-value contracts make every organic lead extremely valuable in the medical device space.
10. Financial services SEO returns 1,031%. (Source: First Page Sage, 2026) Financial services keywords are expensive in PPC ($50+ per click). Ranking organically for the same keywords eliminates that cost entirely.
11. Higher education SEO delivers 994% ROI. (Source: First Page Sage, 2026) Student enrollment values of $20K-$200K per year make organic rankings worth millions in aggregate revenue.
12. B2B SaaS achieves 702% SEO ROI with 7-month breakeven. (Source: First Page Sage, 2026) SaaS companies see faster breakeven than most industries. Recurring revenue from organic acquisition compounds quickly. For deeper SaaS numbers, see our content marketing statistics.
13. Ecommerce SEO delivers 317% ROI. (Source: First Page Sage, 2026) Lower per-transaction values reduce the percentage return. But the volume of transactions means ecommerce SEO still generates millions in added revenue.
14. Local SEO averages 700% ROI with 6-12 month payoff. (Source: First Page Sage, 2026) Local businesses ranking in the Google Map Pack and local organic results see strong returns. The combination of lower competition and high local intent drives consistent ROI.
Stop writing. Start ranking. Stacc publishes 30 SEO articles per month for $99. Start for $1 →
SEO vs PPC ROI Statistics
The comparison is not close. SEO delivers higher ROI over time. PPC delivers faster but more expensive results.
15. SEO delivers 748% ROI vs PPC at 36% long-term ROI. (Source: Click Vision, 2026) PPC returns $2 for every $1 spent. SEO returns $7.48. The gap widens the longer you run SEO campaigns.
16. Organic leads cost $31 each. PPC leads cost $181 each. (Source: First Page Sage, 2025) SEO generates leads at 5.8x lower cost than paid search. The cost gap compounds with volume.
17. SEO conversion rate averages 14.6%. PPC averages 3.75%. (Source: First Page Sage, 2025) Organic searchers convert at nearly 4x the rate of paid ad clickers. Higher intent explains the difference.
18. SEO maintains 25% higher ROI than PPC over time. (Source: SeoProfy, 2026) PPC ROI stays flat or declines as competition raises bid prices. SEO ROI increases as authority and content compound.
19. 70-80% of users ignore paid ads and click organic results. (Source: AIOSEO, 2026) Most searchers skip ads entirely. Organic rankings capture the majority of clicks.
20. SEO surpasses PPC ROI within 9-12 months. (Source: Click Vision, 2026) PPC wins in the first 3-6 months. After 9-12 months, SEO overtakes PPC and continues growing. For a full breakdown, read our SEO vs PPC comparison.
Content Marketing and Organic Revenue Statistics
21. Content marketing generates $3 for every $1 invested. (Source: Genesys Growth, 2026) That is 67% higher than paid advertising at $1.80 return per $1. Content compounds. Ads stop the moment you stop paying.
22. Content marketing requires 62% less investment than traditional marketing. (Source: Demand Metric, 2025) Lower cost and 3x more leads. The math makes content marketing and SEO the most efficient acquisition strategy for most businesses.
23. Organic search drives 44.6% of B2B revenue. (Source: BrightEdge, 2025) For B2B companies, nearly half of all revenue traces back to organic search. No other channel contributes as much.
24. Global content marketing revenue will reach $107.5 billion by 2026. (Source: Statista, 2025) The industry is growing because the returns justify the investment. Businesses spending on content see measurable results.
25. Companies publishing 16+ blog posts per month get 3.5x more traffic. (Source: HubSpot, 2025) Publishing velocity directly correlates with traffic growth. More content means more keywords ranked, more pages indexed, and more organic entry points. For measuring content marketing ROI effectively, see our dedicated guide.
Your SEO team. $99 per month. 30 optimized articles, published automatically. Start for $1 →
SEO Budget and Investment Statistics
26. The average SEO budget for SMBs is $500-5,000 per month. (Source: Upgrowth, 2026) Enterprise SEO budgets range from $10,000-$100,000+ per month. The ROI math works at every scale. For more on budgeting, read our SEO cost guide.
27. 61% of B2B marketers say SEO generates more leads than any other channel. (Source: HubSpot, 2025) SEO beats paid search, social advertising, and events in lead generation effectiveness for B2B companies.
28. Businesses spending $500+/month on SEO are 53.3% more likely to be satisfied. (Source: Ahrefs, 2025) Underinvestment in SEO produces poor results. The minimum effective threshold for most businesses is $500/month in either tools, services, or content.
29. 92% of marketers believe SEO will be effective in 2026. (Source: AIOSEO, 2026) Despite AI disruption and algorithm changes, marketer confidence in SEO remains at record highs.
30. Only 36% of small businesses invest in SEO. (Source: Ahrefs, 2025) The majority of small businesses ignore SEO entirely. That means less competition for the businesses that do invest.
Timeline and Compounding Statistics
31. SEO campaigns reach positive ROI in 6-12 months. (Source: First Page Sage, 2026) The timeline for SEO results depends on competition, content quality, and domain authority. Most campaigns break even by month 9.
32. At 12 months, SEO ROI reaches 2.6x. (Source: First Page Sage, 2026) After the initial investment period, returns accelerate. Content that ranks keeps generating traffic without additional spend.
33. At 24 months, top-performing SEO campaigns exceed 10x ROI. (Source: First Page Sage, 2026) The compounding nature of SEO means year-2 returns are dramatically higher than year-1. Every ranked page continues earning traffic indefinitely.
34. A single high-ranking blog post generates traffic for 2+ years. (Source: Ahrefs, 2025) Blog content has a long shelf life when maintained. Evergreen posts that rank on page 1 drive consistent organic visits for years.
35. SEO customer acquisition cost decreases 60% over 2 years. (Source: First Page Sage, 2026) The cost to acquire each customer through SEO drops as your content library grows. More ranked pages mean more traffic from the same monthly investment.
Key Takeaways
- 748%. Median SEO ROI across all industries
- 22:1. Average dollar return on SEO investment
- 14.6%. SEO lead close rate (vs 1.7% outbound)
- $31 vs $181. Cost per lead: SEO vs PPC
- 1,389%. Highest industry ROI (real estate)
- 9-12 months. Timeline for SEO to surpass PPC returns
- 3.5x. Traffic increase from publishing 16+ posts/month
Methodology
Sources: First Page Sage, SeoProfy, HubSpot, BrightEdge, Ahrefs, AIOSEO, Click Vision, Genesys Growth, Upgrowth, Demand Metric, Statista.
Last updated: March 2026
Note: We update this page quarterly. Each statistic includes its original source and publication year. ROI figures represent medians or averages across multiple campaigns and may vary by execution quality.
3,500+ blogs published. 92% average SEO score. See what Stacc can do for your site. Start for $1 →
FAQ
What is the average ROI of SEO?
The median SEO ROI is 748%, meaning businesses earn $7.48 for every $1 invested. The average across industries is 22:1 ($22 return per $1). Real estate sees the highest returns at 1,389%. Ecommerce sees lower percentages (317%) but high absolute dollar returns due to transaction volume.
How long does it take for SEO to show ROI?
Most SEO campaigns reach positive ROI within 6-12 months. B2B SaaS campaigns break even fastest at around 7 months. SEO surpasses PPC returns within 9-12 months. By month 24, top-performing campaigns exceed 10x ROI.
Is SEO more profitable than PPC?
Yes, over time. SEO delivers 748% ROI compared to 36% for PPC. Organic leads cost $31 each versus $181 for PPC leads. SEO conversion rates average 14.6% versus 3.75% for PPC. The key difference is timeline. PPC delivers faster results. SEO delivers larger returns after 9-12 months.
What industries get the highest SEO ROI?
Real estate (1,389%), medical devices (1,183%), financial services (1,031%), and higher education (994%) see the highest SEO returns. Industries with high customer lifetime values and expensive PPC keywords benefit most from organic rankings.
How much should a small business spend on SEO?
The average SMB SEO budget is $500-5,000 per month. Businesses spending $500+ monthly are 53.3% more likely to be satisfied with results. Stacc offers 30 SEO articles per month at $99/mo, making professional-grade SEO accessible at a fraction of the typical cost.
SEO compounds. Paid ads depreciate. Every statistic on this page points to the same conclusion: organic search is the most efficient, highest-returning marketing channel available to businesses in 2026.
Related Tools & Resources
Free SEO Tools:
Best Lists:
Related Statistics

Written by
Siddharth GangalSiddharth is the founder of theStacc and Arka360, and a graduate of IIT Mandi. He spent years watching great businesses lose organic traffic to competitors who simply published more. So he built a system to fix that. He writes about SEO, content at scale, and the tactics that actually move rankings.
30 SEO blog articles published every month
Keyword-optimized, scheduled, and live on your site. Automatically.
30-day trial · Cancel anytime
theStacc
Stop writing SEO content manually
30 blog articles, 30 GBP posts, and social media content. Published every month. Automatically.
Start Your $1 Trial$1 for 3 days · Cancel anytime