Email Marketing Statistics 2026: 50+ Facts
50+ email marketing statistics for 2026, all sourced. Covers ROI, open rates, automation, mobile, B2B, B2C, and personalization. Updated March 2026.
Last updated: March 2026
Email marketing generates $36 to $42 for every $1 spent. That is a 3,600% to 4,200% ROI. No other marketing channel comes close.
Most marketers know email works. Few know exactly how well. The email marketing statistics in this post answer that question with numbers, not opinions.
Every stat is sourced, dated, and organized by category. Use them to justify your email marketing budget, benchmark your open rates, or build a case for automation.
We publish 3,500+ blogs across 70+ industries. Data shapes every campaign we run. Here are 50+ email marketing statistics that should shape yours.
General Email Marketing Statistics
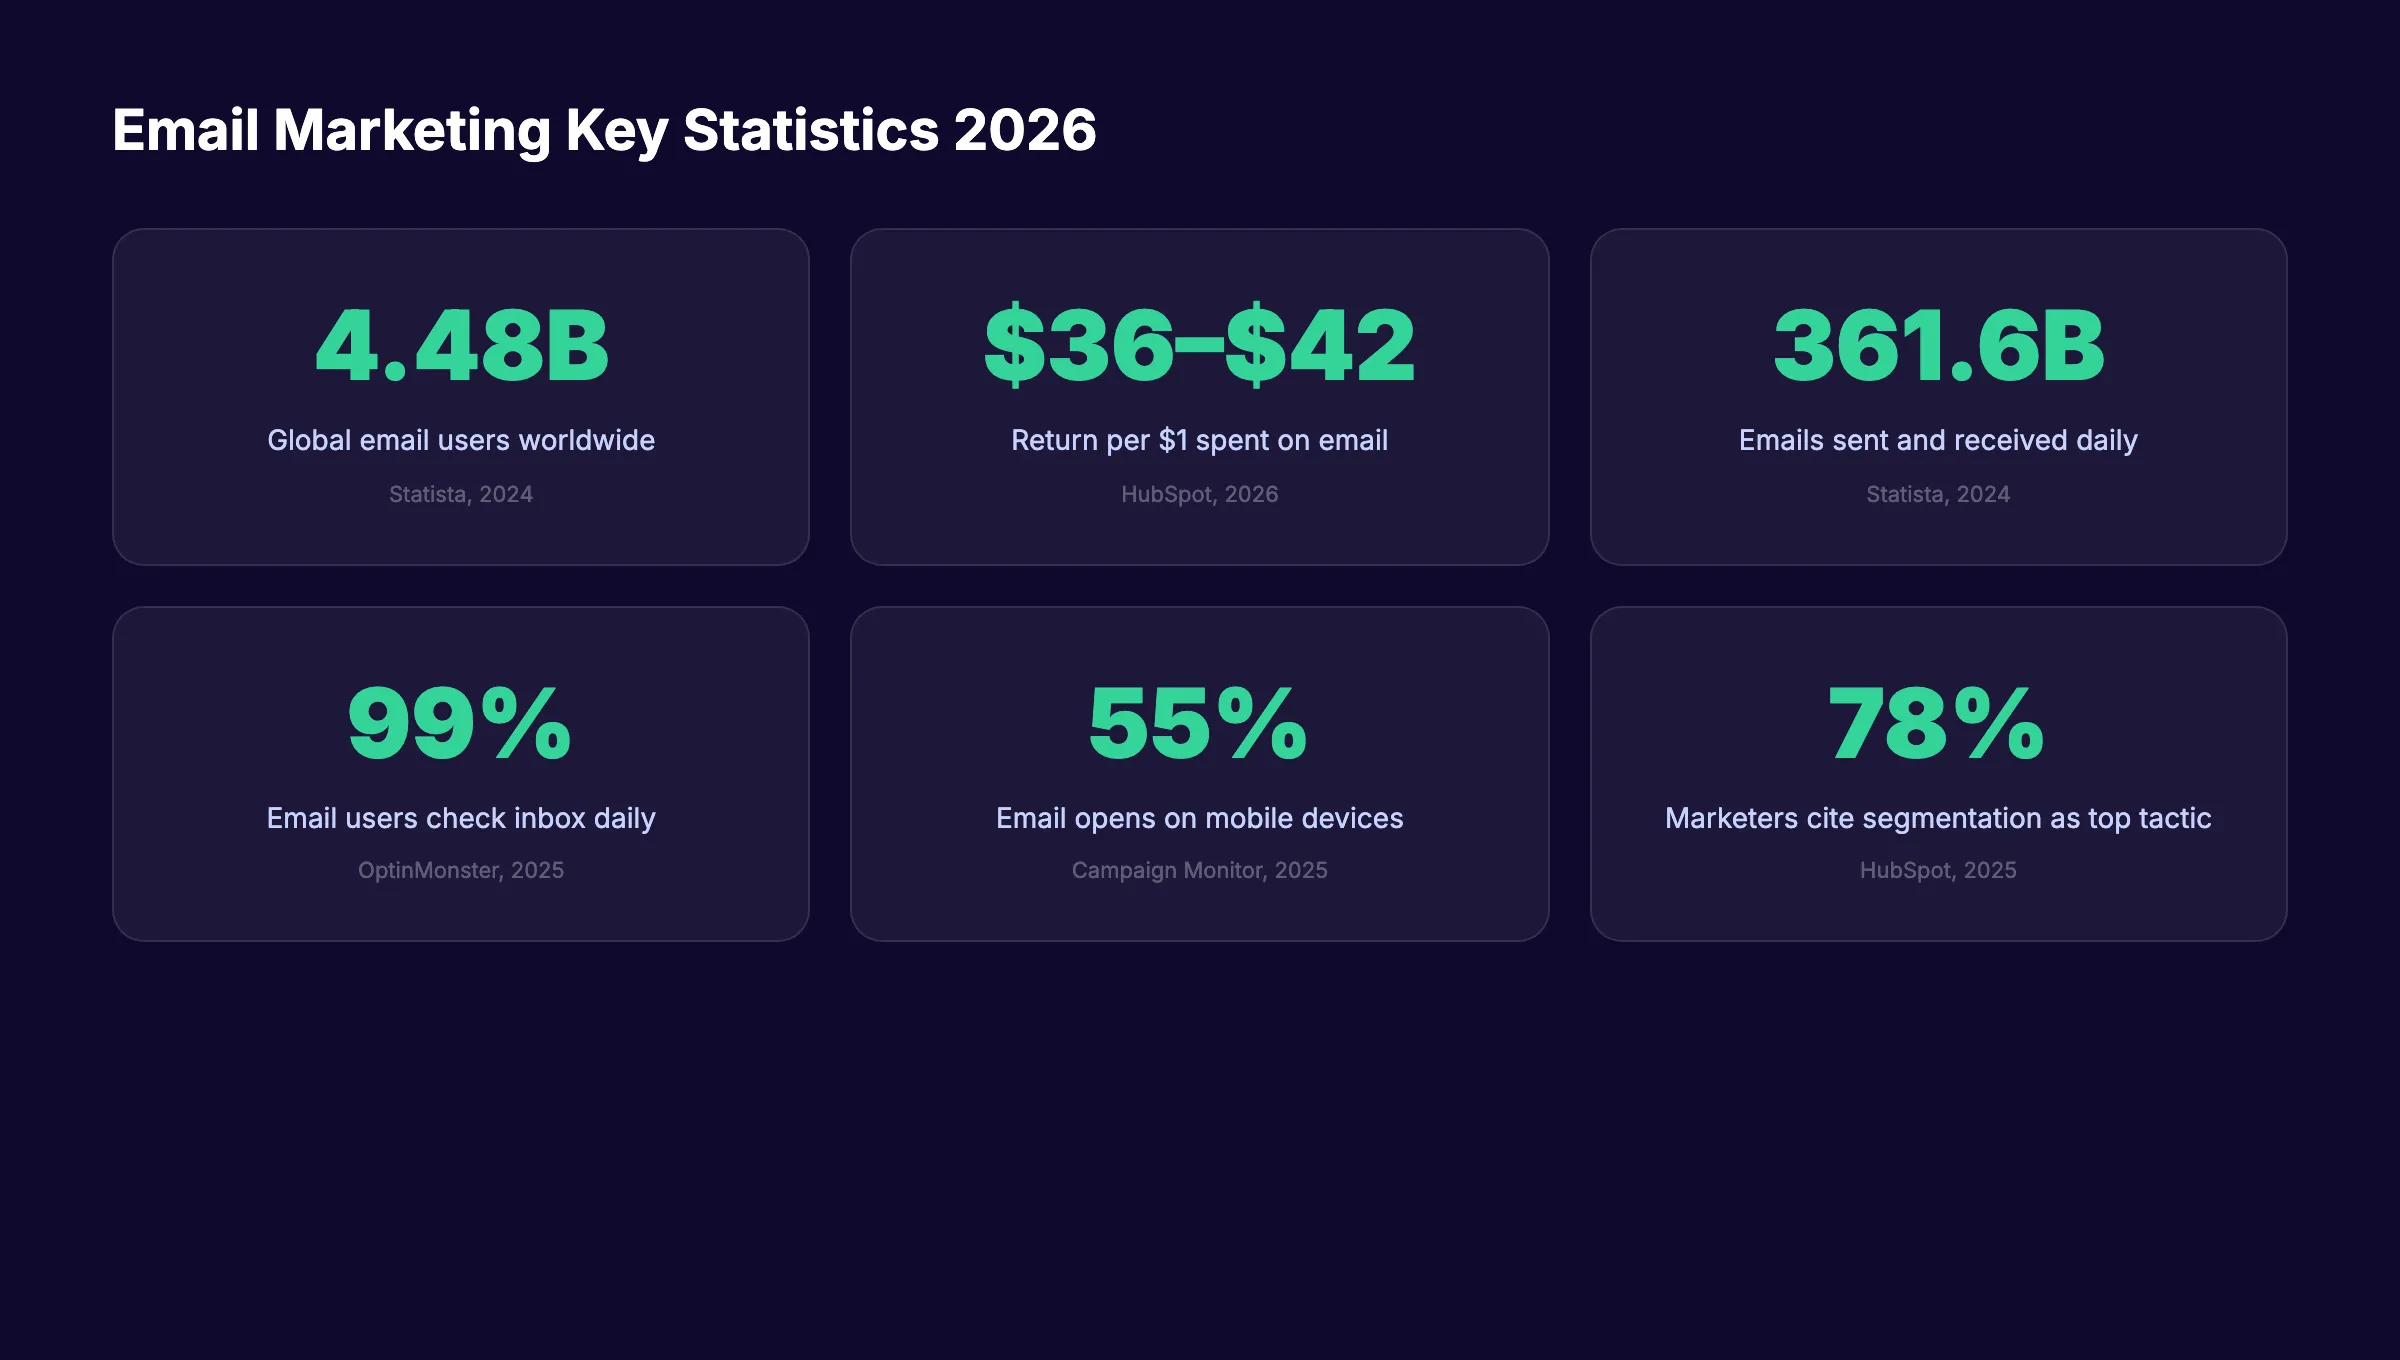
1. There are 4.48 billion email users worldwide in 2024. Source: Statista, 2024 That number is projected to reach 4.89 billion by 2027. Email is not declining. It is growing.
2. 361.6 billion emails are sent and received every day. Source: Statista, 2024 Daily volume grew 4.3% year over year. By 2026, projections put this at 392.5 billion per day.
3. 99% of email users check their inbox daily. Source: OptinMonster, 2025 Some users check up to 20 times per day. No social platform matches that consistency.
4. The average person receives 121 emails per day. Source: Statista, 2024 Your email subject line must stand out in a crowded inbox.
5. 31% of marketers actively use email marketing as a channel. Source: HubSpot, 2026 That leaves 69% of marketers underusing the highest-ROI channel available.
6. Email is 40x more effective than Facebook and Twitter combined for customer acquisition. Source: McKinsey, 2024 Social media builds awareness. Email builds revenue.
7. 41% of consumers check email specifically for coupons and discounts. Source: DemandSage, 2025 Promotional emails drive action when they match buyer intent.
8. 75% of marketers plan to maintain or increase their email marketing spend in 2026. Source: HubSpot, 2026 Email budgets are growing because the ROI data supports it.
Email Marketing ROI Statistics
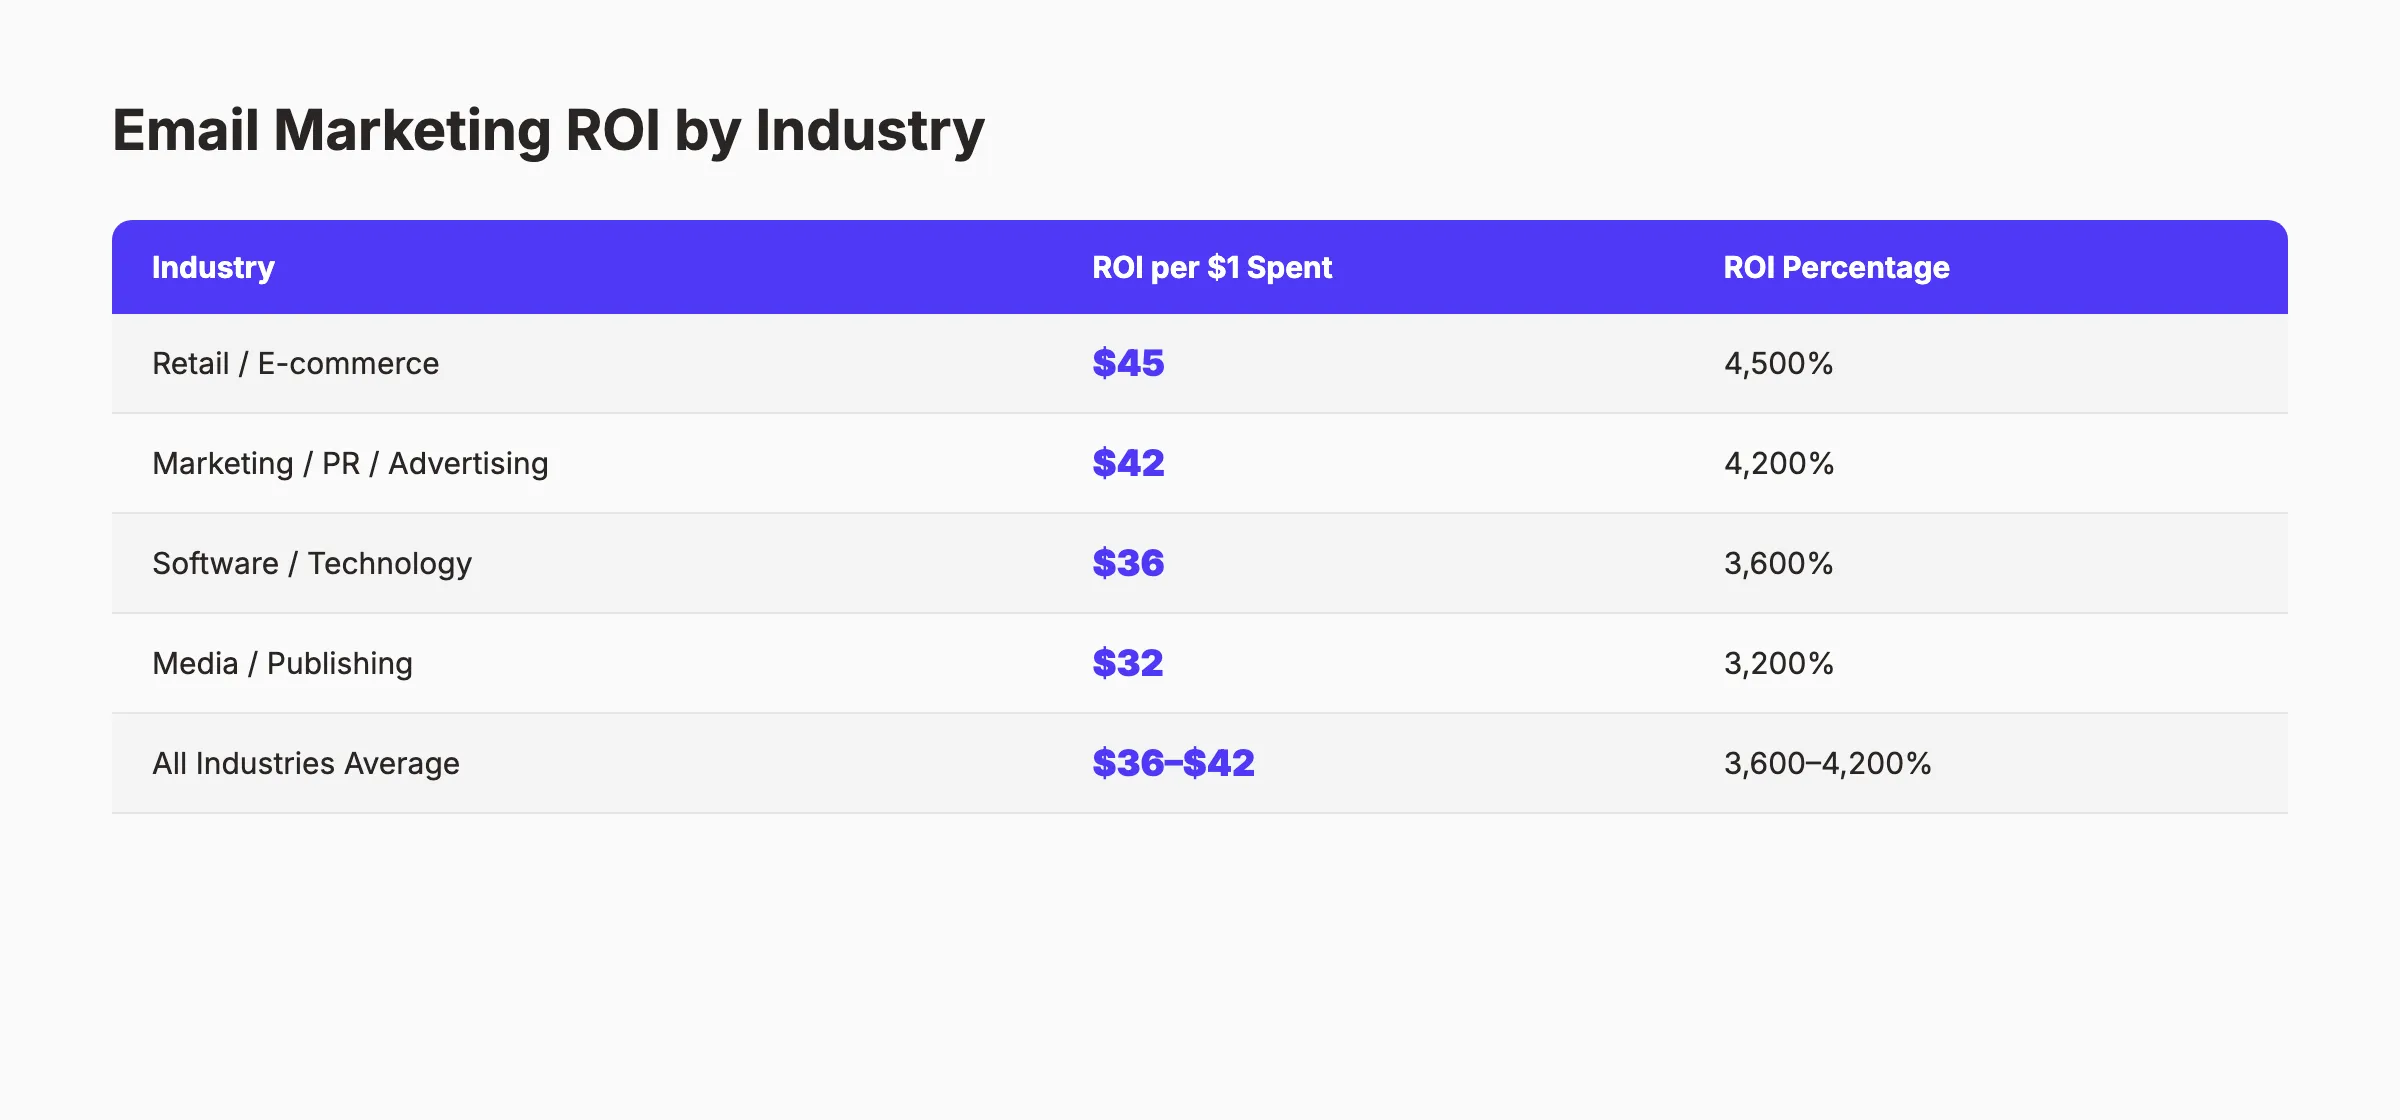
9. Email marketing delivers an average ROI of $36 to $42 per $1 spent. Source: HubSpot, 2026 That translates to 3,600% to 4,200% returns. Paid search averages $2 per $1 spent.
10. Retail and e-commerce see the highest email ROI at $45 per $1 spent. Source: Omnisend, 2025 Product-based businesses benefit from abandoned cart and post-purchase flows.
11. Marketing agencies report $42 per $1 spent on email campaigns. Source: Litmus, 2025 Agencies track ROI closely. Email consistently outperforms their other channels.
12. Software and technology companies earn $36 per $1 spent. Source: Litmus, 2025 SaaS companies rely on email automation for onboarding and retention.
13. Personalized email marketing generates a median ROI of 122%. Source: Instapage, 2025 Generic blasts return far less. Personalization more than doubles the return.
14. Global email marketing revenue is projected to reach $17.9 billion by 2027. Source: Statista, 2024 Revenue was $12.33 billion in 2024. That is 45% growth in 3 years.
15. 50% of companies measure email ROI poorly or not at all. Source: Robly, 2026 Half of all email programs lack proper attribution. Measuring content marketing ROI requires better tracking.
16. For B2C brands, email marketing ranks as the number 1 ROI channel. Source: HubSpot, 2026 It outperforms paid social, content marketing, and display ads.
Your email list is your highest-ROI marketing asset. Stacc helps local businesses build content that grows that list automatically. Start for $1 →
Email Open Rate Statistics
17. The average email open rate across all industries is 43.46% in 2026. Source: ActiveCampaign, 2026 Apple Mail Privacy Protection inflates this number. Focus on click rates for accuracy.
18. Non-profit organizations have the highest open rate at 52.38%. Source: ActiveCampaign, 2026 Mission-driven audiences open emails at higher rates. Email marketing for nonprofits works.
19. Health and fitness emails average a 47.81% open rate. Source: ActiveCampaign, 2026 This sector benefits from high subscriber engagement and personal relevance.
20. E-commerce emails average a 32.67% open rate. Source: ActiveCampaign, 2026 Lower than average. Competitive inboxes and frequent promotional sends drive this down.
21. Personalized subject lines increase open rates by 50%. Source: Oberlo, 2025 Adding a first name or purchase history to the subject line makes a measurable difference.
22. Welcome emails achieve a 68.6% open rate. Source: Influencer Marketing Hub, 2025 The first email after signup gets the highest engagement. Make it count.
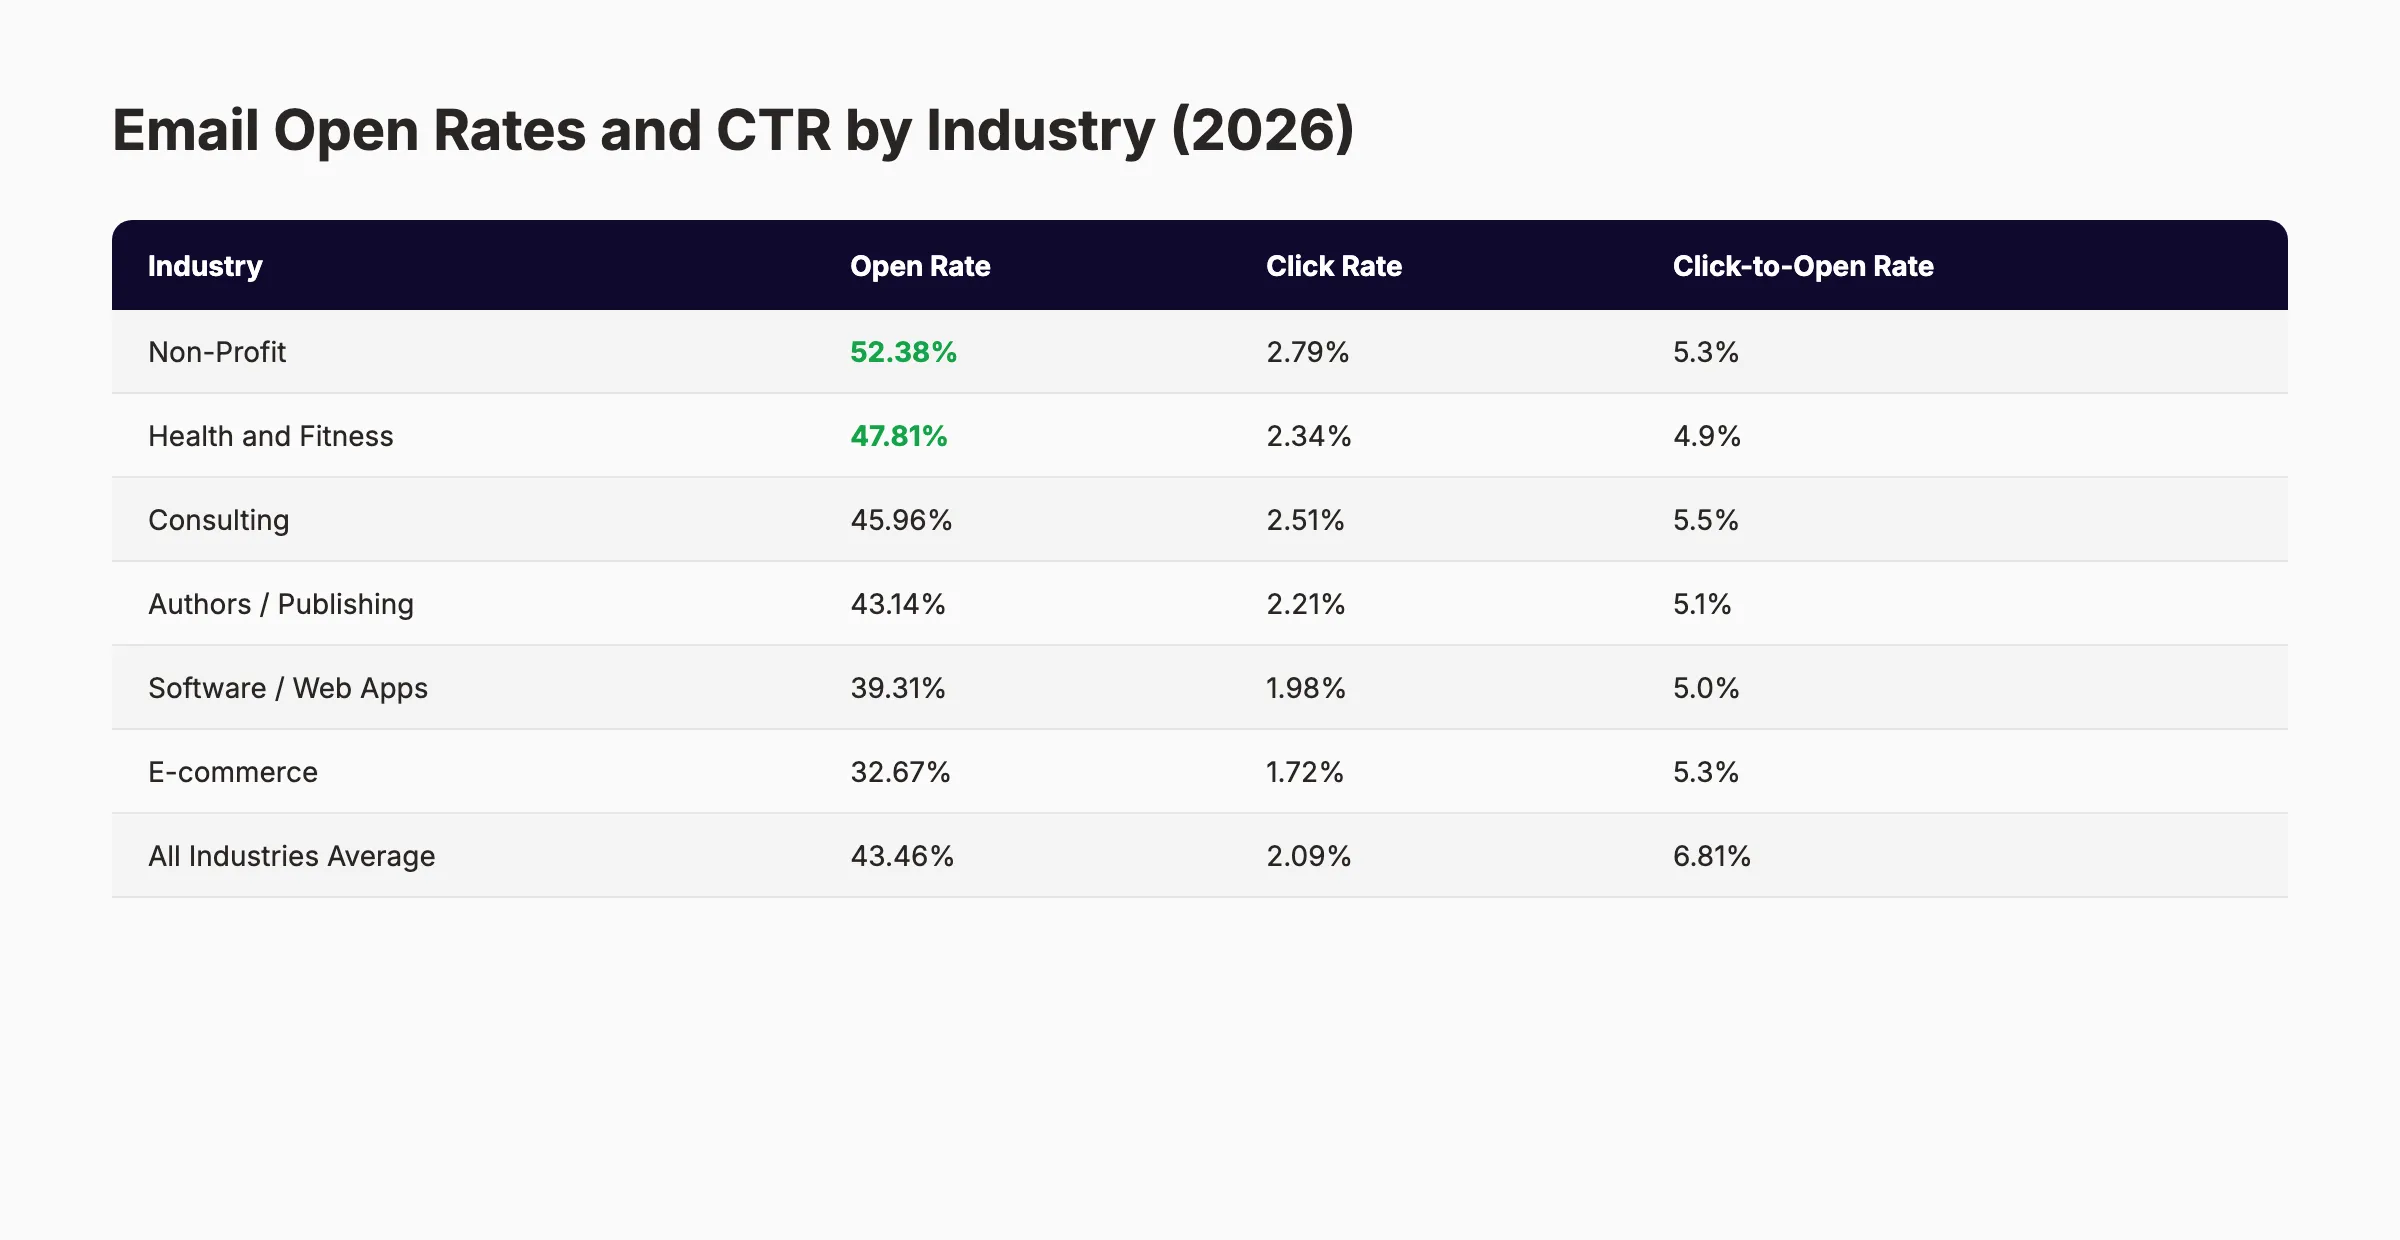
23. The average click-to-open rate (CTOR) is 6.81%. Source: ActiveCampaign, 2026 CTOR measures how many openers actually click. It is a better signal than open rate alone.
24. The legal industry leads click-through rates at 4.90%. Source: Klaviyo, 2026 Legal content tends to be high-intent. Subscribers want specific answers.
25. Government emails achieve the highest Mailchimp-reported open rate at 28.77%. Source: Mailchimp, 2025 Government communications carry authority and urgency.
Email Automation Statistics
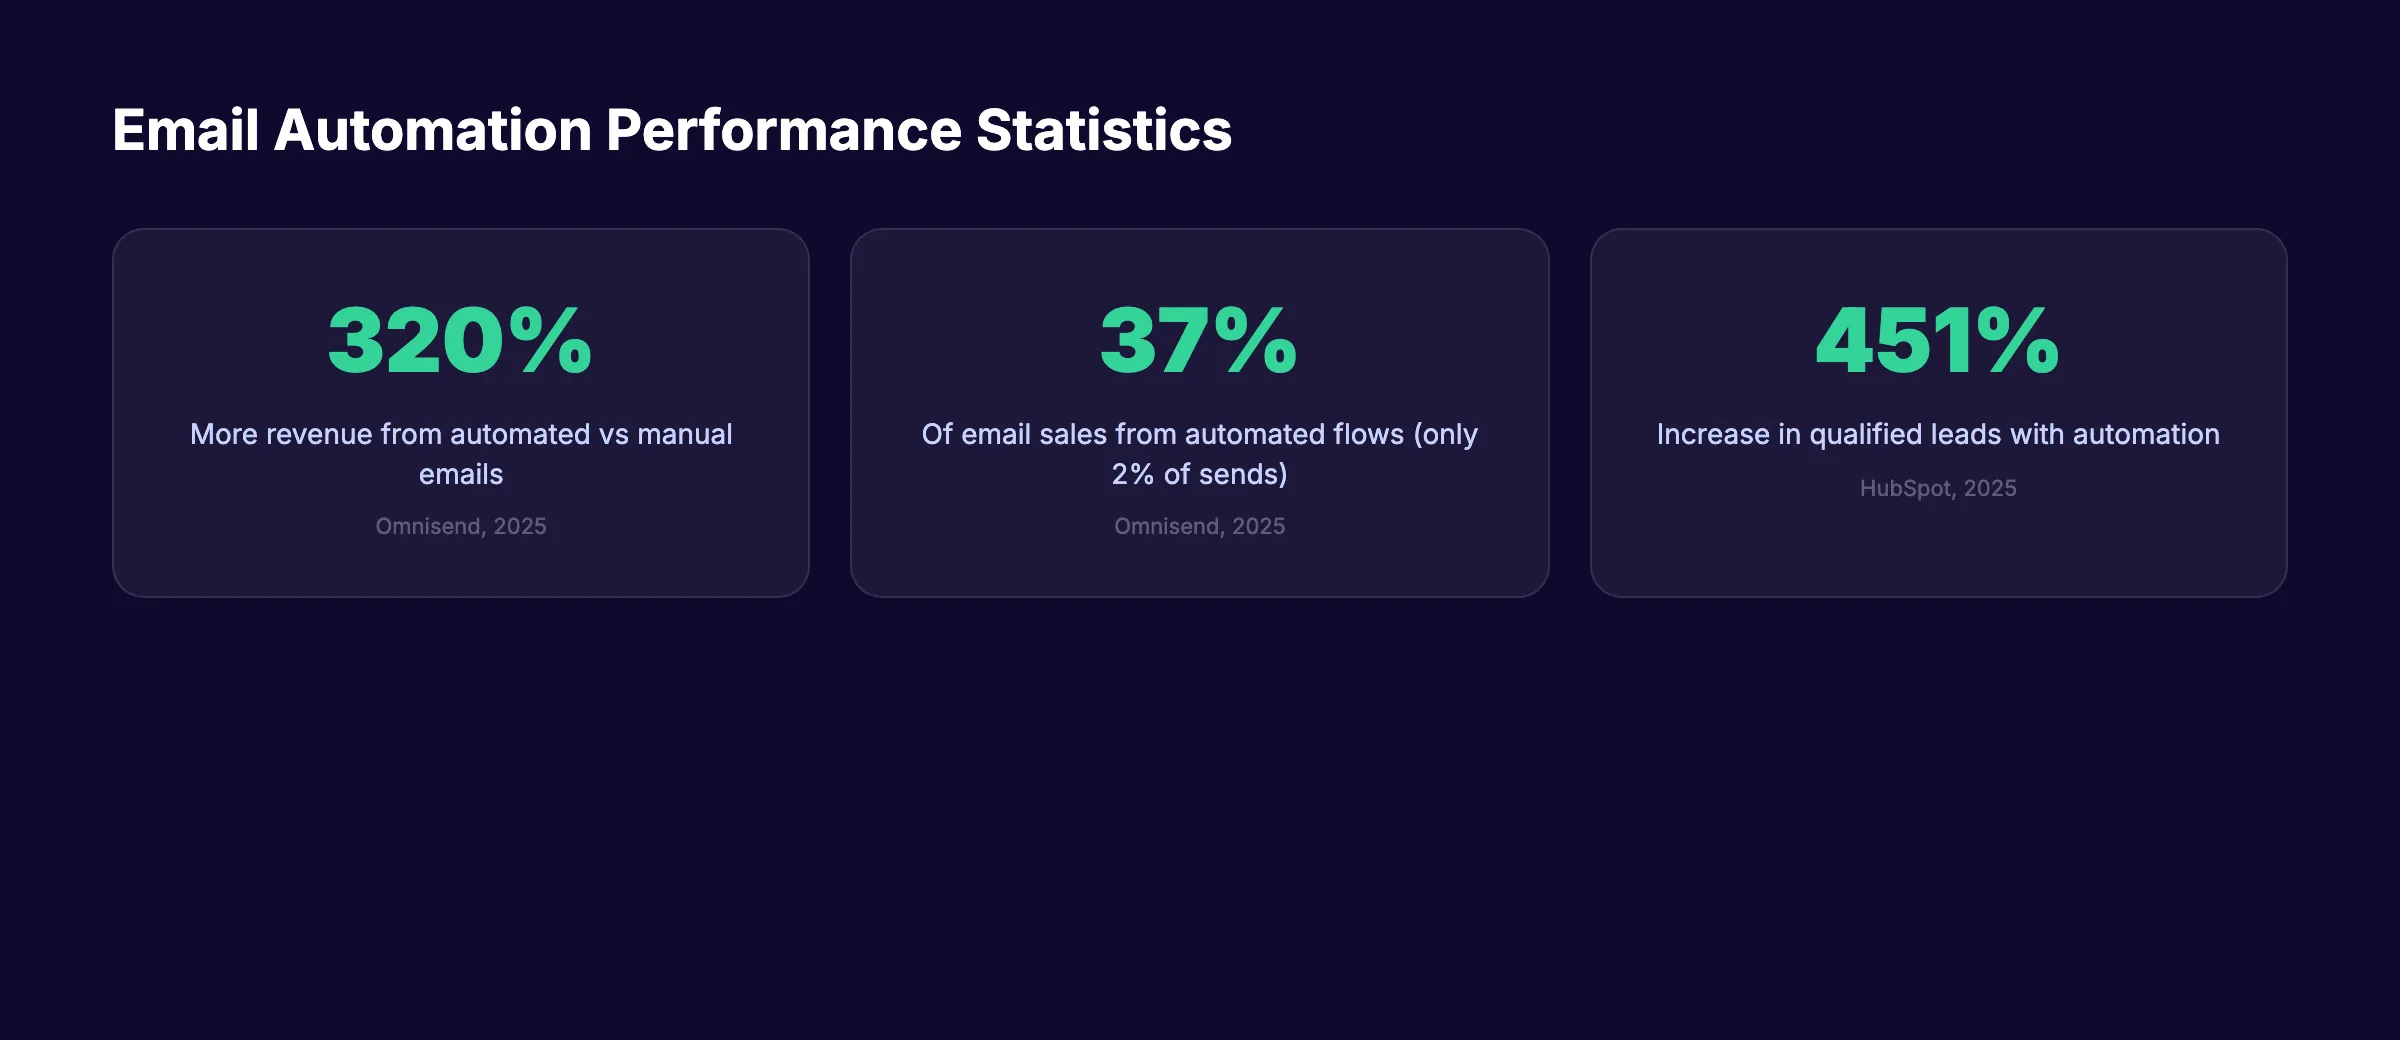
26. Automated emails represent only 2% of sends but drive 37% of email sales. Source: Omnisend, 2025 A tiny fraction of volume generates more than a third of revenue. Automation is not optional.
27. Automated emails drive 320% more revenue than standard sends. Source: Omnisend, 2025 Triggered emails (welcome, abandoned cart, post-purchase) outperform batch-and-blast by 3x.
28. Companies using email automation see a 451% increase in qualified leads. Source: HubSpot, 2025 Automation nurtures leads through the funnel without manual effort.
29. Welcome emails generate 4x more opens and 10x more clicks than standard emails. Source: Influencer Marketing Hub, 2025 The welcome sequence is the highest-performing email automation flow.
30. 3 abandoned cart emails generate 69% more orders than a single email. Source: Oberlo, 2025 A multi-touch cart recovery sequence recovers significantly more revenue.
31. Abandoned cart emails achieve a 50%+ open rate. Source: Robly, 2026 Cart abandonment flows outperform general promotional emails by 15 percentage points.
32. 71% of marketers use email automation campaigns. Source: HubSpot, 2025 Adoption is high. The gap is between basic automation and advanced lifecycle flows.
33. 89% of marketing experts expect 75% of email operations to be AI-driven by 2026. Source: DemandSage, 2025 AI handles send-time optimization, subject line testing, and audience segmentation.
Mobile Email Statistics
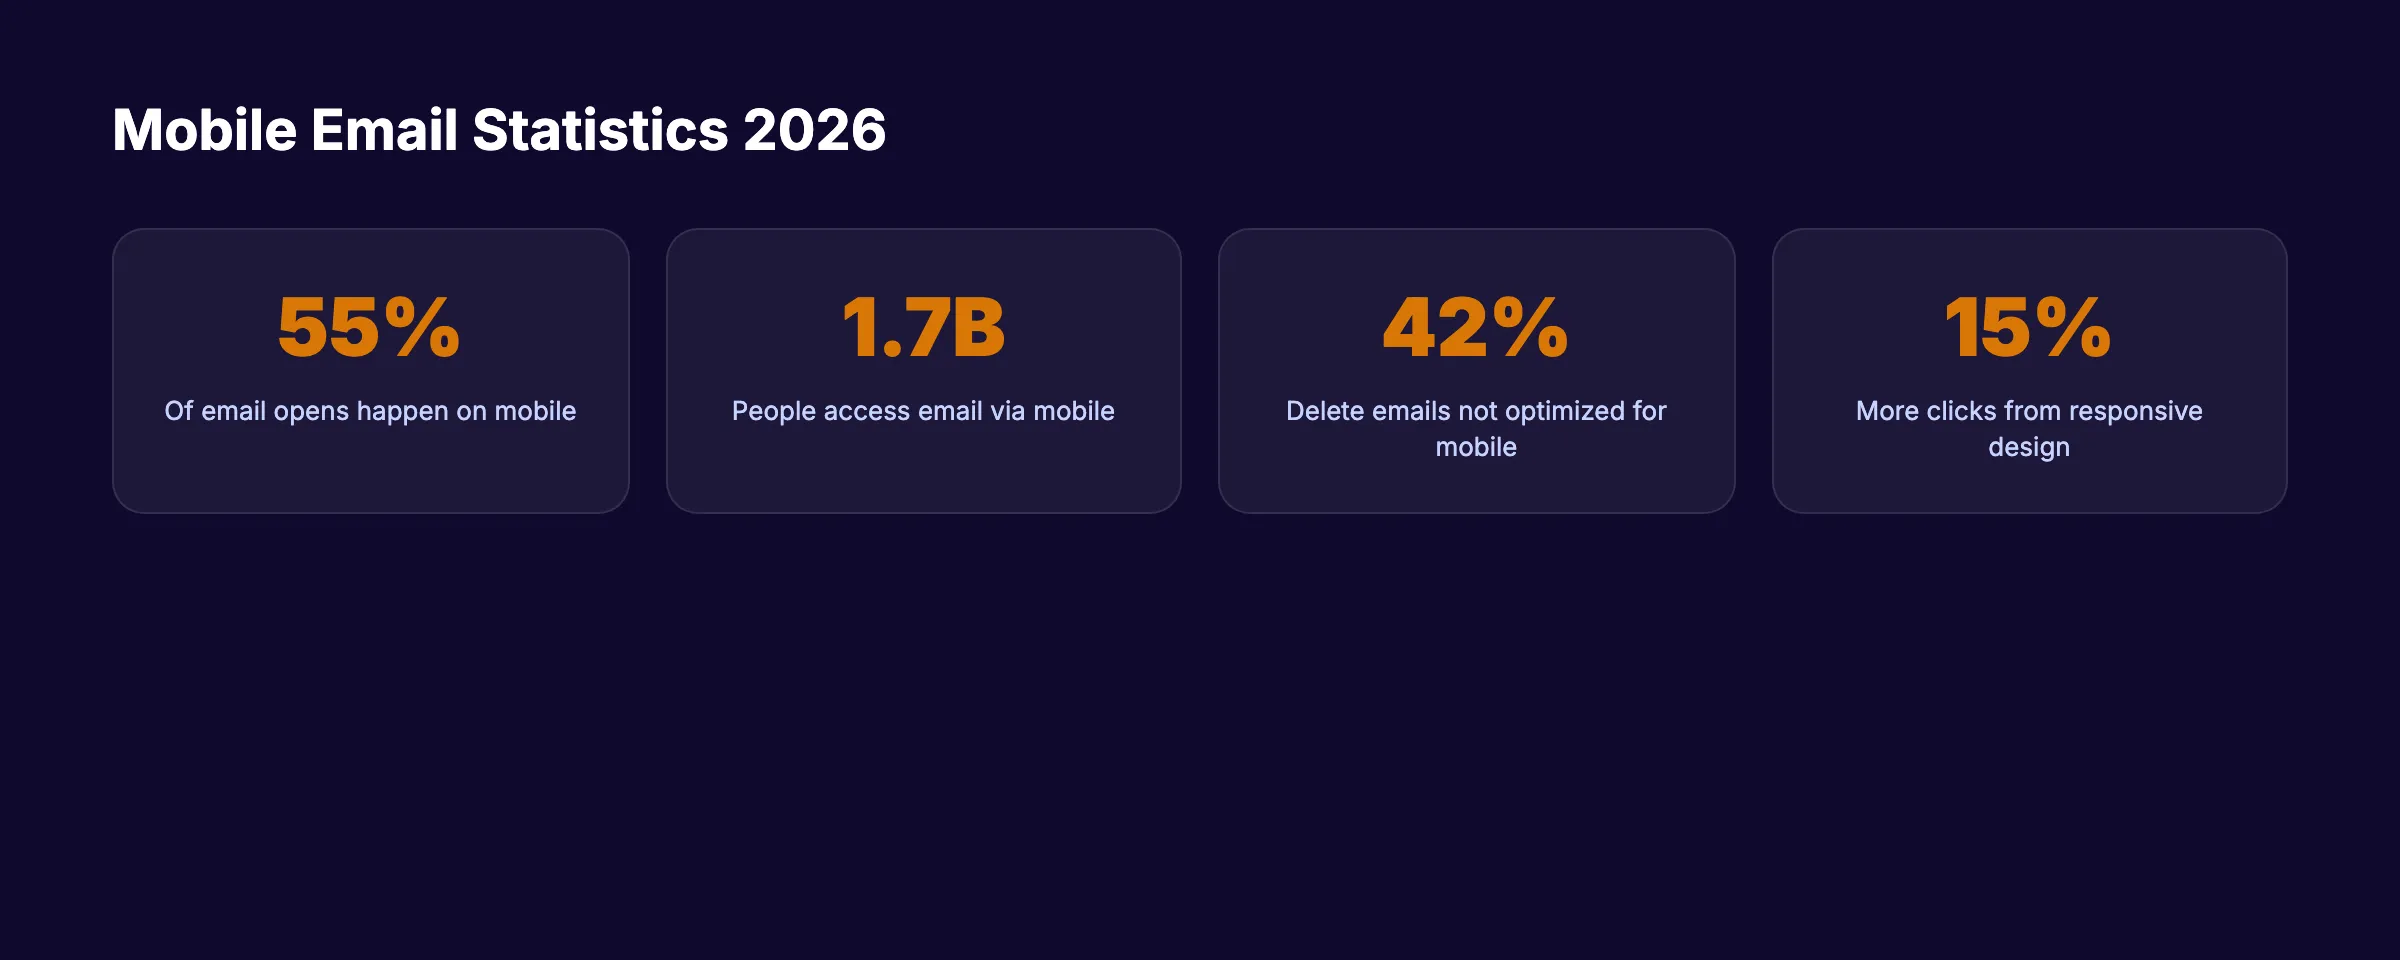
34. 55% of email opens occur on mobile devices. Source: Campaign Monitor, 2025 More than half of your audience reads email on a phone. Design for mobile first.
35. 1.7 billion people access email through mobile apps. Source: Porch Group Media, 2025 Mobile email access outnumbers desktop by nearly 2 to 1.
36. 42.3% of users delete emails that do not display properly on mobile. Source: OptinMonster, 2025 Poor mobile rendering costs you nearly half your mobile audience.
37. Mobile-responsive email design increases unique clicks by 15%. Source: G2, 2025 Responsive design is not a nice-to-have. It is a 15% click improvement.
38. 1 in 5 email campaigns is not optimized for mobile. Source: SuperOffice, 2025 20% of campaigns lose mobile readers before the message loads.
39. Apple Mail holds 50% to 60% of email client market share. Source: Robly, 2026 Apple Mail Privacy Protection pre-loads tracking pixels. Open rate data from Apple users is unreliable.
Email drives results when your content strategy works. Stacc publishes 30 blog posts per month to keep your audience engaged. Start for $1 →
Personalization and Segmentation Statistics
40. 78% of marketers cite subscriber segmentation as the most effective email strategy. Source: HubSpot, 2025 Segmentation outranks every other tactic. Batch-and-blast underperforms segmented sends by wide margins.
41. Segmented campaigns generate 30% more opens and 50% more click-throughs. Source: HubSpot, 2025 Sending the right message to the right segment is the single biggest lever in email performance.
42. Personalized emails deliver 6x higher transactional rates. Source: Mailmodo, 2025 Dynamic content tied to purchase behavior drives revenue that generic emails cannot match.
43. 80% of consumers are more likely to purchase from brands that personalize. Source: HubSpot, 2025 Personalization is now a consumer expectation. Not a bonus.
44. Personalized calls to action convert 42% better than generic CTAs. Source: HubSpot, 2025 Matching the CTA to the subscriber’s stage in the funnel increases conversions.
45. 52% of consumers shop elsewhere when emails are not personalized. Source: Instapage, 2025 Failure to personalize does not just reduce engagement. It drives customers to competitors.
46. Only 50% of marketers currently personalize their email content. Source: Robly, 2026 Half the market still sends generic campaigns. That is an opportunity.
47. Marketers using advanced segmentation see a 760% increase in revenue. Source: DemandSage, 2025 Advanced segmentation (behavior, purchase history, lifecycle stage) transforms email into a revenue engine.
B2B vs B2C Email Marketing Statistics
48. 81% of B2B marketers cite email newsletters as their most-used content method. Source: Content Marketing Institute, 2025 Email is the primary distribution channel for B2B content. Blogs feed newsletters. Newsletters feed pipeline.
49. 59% of B2B marketers cite email as their top revenue generation channel. Source: HubSpot, 2025 For B2B, email outperforms events, webinars, and organic social for direct revenue.
50. B2B emails have a 23% higher click-to-open ratio than B2C emails. Source: Fluent CRM, 2025 B2B audiences are more intentional. They open fewer emails but click more.
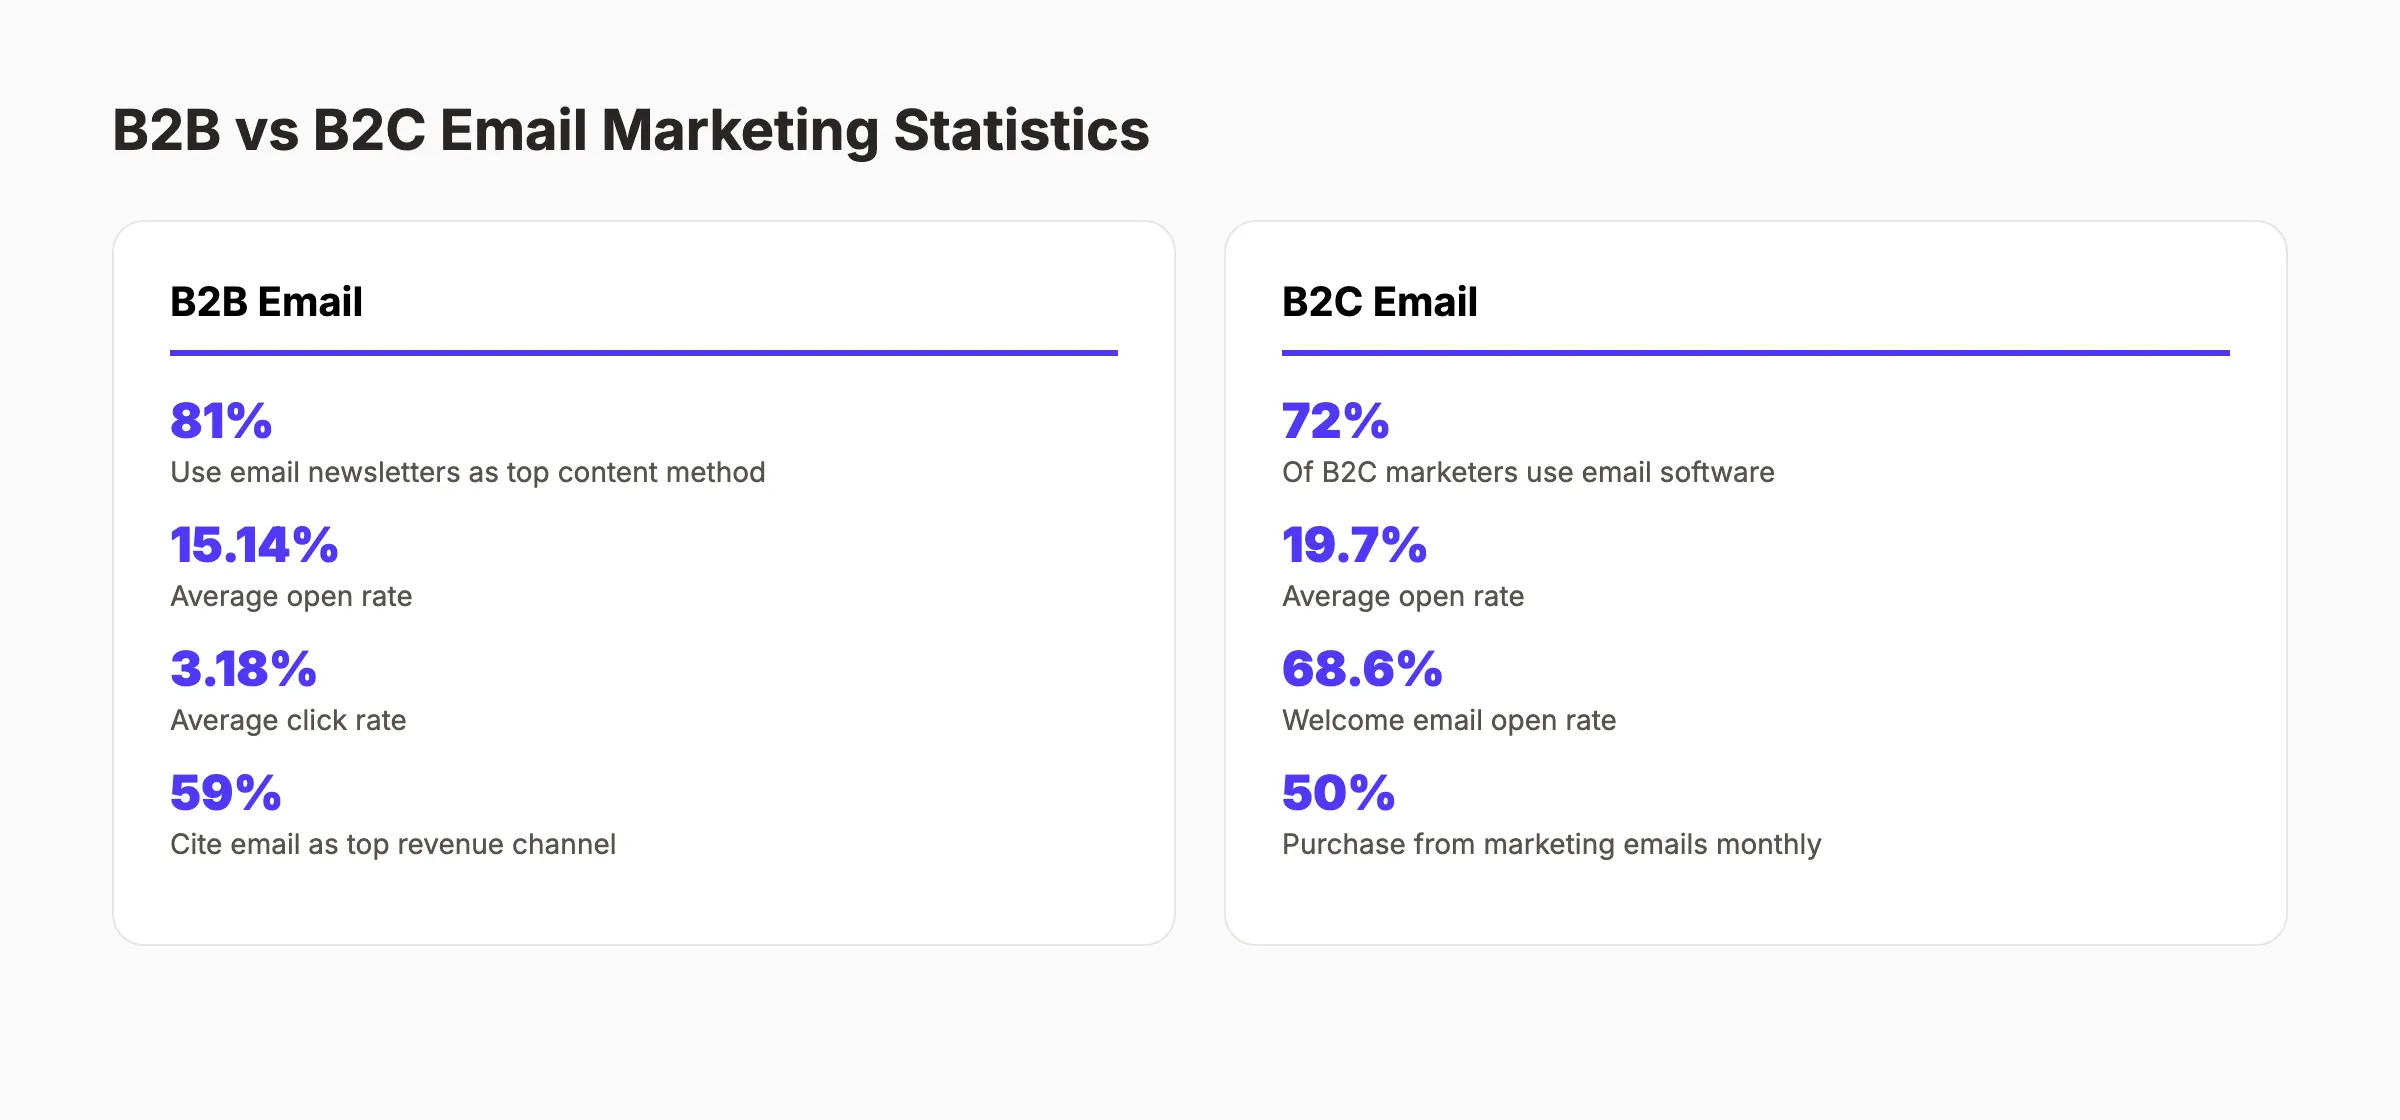
51. 50% of consumers make a purchase from marketing emails every month. Source: Influencer Marketing Hub, 2025 For B2C, email is a direct sales channel. Half of all subscribers buy monthly.
52. 91% of US consumers want to receive promotional emails from brands they buy from. Source: Influencer Marketing Hub, 2025 Consumers opt in because they want deals. Email marketing for local businesses works for the same reason.
53. 60% of consumers complete a purchase after receiving a personalized abandoned cart email. Source: Influencer Marketing Hub, 2025 Cart recovery emails are not annoying. They close sales.
54. B2B average open rate is 15.14%. B2C average open rate is 19.7%. Source: Fluent CRM, 2025 B2C open rates run higher. B2B compensates with higher click-through and conversion rates.
AI in Email Marketing Statistics
55. 63% of marketers use AI in their email campaigns. Source: HubSpot, 2026 Adoption crossed the majority threshold. AI email is now mainstream.
56. AI-driven email campaigns generate 41% higher revenue than traditional approaches. Source: DemandSage, 2025 The revenue lift comes from better personalization, send-time optimization, and subject line testing.
57. 95% of marketers using generative AI for email consider it effective. Source: HubSpot, 2026 Near-unanimous satisfaction. AI handles the repetitive parts of content creation.
58. 66% of AI-adopting marketers use send-time optimization. Source: Robly, 2026 Sending at the right time for each subscriber is the most popular AI use case.
59. 51% of marketers believe AI email marketing is more effective than traditional methods. Source: Statista, 2025 The other 49% may not have tested it yet.
Small Business Email Marketing Statistics
60. 64% of small businesses use email marketing. Source: HubSpot, 2025 Email is the most adopted digital marketing channel for small businesses.
61. 81% of small businesses use email as their primary customer acquisition channel. Source: HubSpot, 2025 Small businesses rely on email more than social, paid ads, or SEO for new customers.
62. 80% of small businesses use email for customer retention. Source: HubSpot, 2025 Email does double duty. It acquires and retains. Email marketing for HVAC companies is a strong example.
63. 89% of small business marketers use email for lead generation. Source: Oberlo, 2025 Email marketing for contractors and other service businesses starts with lead capture.
Email Deliverability and Timing Statistics
64. The average email deliverability rate is 83%. Source: EmailToolTester, 2024 17% of emails never reach the inbox. Deliverability is a prerequisite for everything else.
65. Gmail and Yahoo require spam complaint rates below 0.3%. Source: Robly, 2026 New sender requirements enforce stricter thresholds. Building an email list with proper opt-in matters more than ever.
66. Unsubscribe rates doubled in 2025 compared to the prior year. Source: Robly, 2026 Inbox fatigue is real. Sending fewer, better emails beats high frequency.
67. The best days to send marketing emails are Tuesday, Wednesday, and Thursday. Source: CoSchedule, 2025 Tuesday is the most popular choice. 35% of marketers prefer it.
68. Optimal send times cluster around 8 a.m., 2 p.m., and 5 p.m. Source: CoSchedule, 2025 Morning, early afternoon, and end of workday capture the highest engagement windows.
69. The number 1 reason people unsubscribe is receiving too many emails. Source: Gartner, 2025 Frequency management matters. 2 to 4 emails per week is the recommended baseline.
Content fuels your email list. Stacc publishes the blog posts that turn visitors into subscribers. Start for $1 →
Key Takeaways
- $36 to $42 per $1 spent: Email ROI outperforms every other digital marketing channel.
- 4.48 billion users: Email reach exceeds any social platform. The audience is growing.
- 55% mobile opens: More than half of email is read on phones. Mobile design is mandatory.
- 37% of sales from 2% of sends: Automated emails punch far above their weight in revenue.
- 760% revenue increase: Advanced segmentation is the single biggest performance lever.
- 42% delete rate: Emails that do not render on mobile lose nearly half their audience.
- 50% of marketers do not personalize: The opportunity gap remains wide open.
Methodology
Sources: HubSpot, Statista, Omnisend, ActiveCampaign, Campaign Monitor, DemandSage, Litmus, Oberlo, Content Marketing Institute, Mailchimp, Robly, Klaviyo, OptinMonster, EmailToolTester, CoSchedule, Gartner, Influencer Marketing Hub.
Last updated: March 2026
Note: We update this page quarterly to keep all statistics current. Each stat includes a source citation with year.
Frequently Asked Questions
What is the average ROI of email marketing in 2026?
Email marketing delivers $36 to $42 for every $1 spent. That is a 3,600% to 4,200% return on investment. Retail and e-commerce businesses see even higher returns at $45 per $1 spent. No other digital marketing channel matches these numbers.
What is a good email open rate in 2026?
The average open rate across all industries is 43.46%. Good open rates range from 35% to 50%, depending on the industry. Non-profits lead at 52.38%. E-commerce sits lower at 32.67%. Keep in mind that Apple Mail Privacy Protection inflates open rate data. Click-through rate is a more reliable performance metric.
How effective is email automation compared to manual sends?
Automated emails generate 320% more revenue than manual sends. They represent only 2% of total email volume but drive 37% of email-generated sales. Welcome sequences, abandoned cart flows, and post-purchase emails are the highest-performing automated flows.
What percentage of emails are opened on mobile devices?
55% of email opens happen on mobile devices. 1.7 billion people access email through mobile apps. 42.3% of recipients delete emails that do not display correctly on mobile. Responsive email design is essential for reaching your full audience.
How much does personalization improve email performance?
Personalized subject lines boost open rates by 50%. Personalized emails deliver 6x higher transactional rates. Personalized CTAs convert 42% better than generic versions. Marketers who use advanced segmentation see a 760% increase in revenue.
Is email marketing still effective for small businesses?
64% of small businesses use email marketing. 81% rely on it as their primary customer acquisition channel. 80% use it for customer retention. Small businesses that combine email with blog content see compounding results from both channels.
Email remains the highest-ROI channel in digital marketing. The data confirms what operators already know: segmented, personalized, mobile-optimized emails drive revenue that other channels cannot replicate. Start building your email program around these benchmarks.
Related Tools & Resources
Free SEO Tools:
Best Lists:
Related Statistics

Written by
Siddharth GangalSiddharth is the founder of theStacc and Arka360, and a graduate of IIT Mandi. He spent years watching great businesses lose organic traffic to competitors who simply published more. So he built a system to fix that. He writes about SEO, content at scale, and the tactics that actually move rankings.
30 SEO blog articles published every month
Keyword-optimized, scheduled, and live on your site. Automatically.
30-day trial · Cancel anytime
theStacc
Stop writing SEO content manually
30 blog articles, 30 GBP posts, and social media content. Published every month. Automatically.
Start Your $1 Trial$1 for 3 days · Cancel anytime