A programmatic SEO case study with real numbers. 512 pages, 11,840 clicks/mo, $48k revenue, 14x ROI. The data, mistakes, and playbook. May 2026.
Most programmatic SEO case studies show a hockey stick chart, name a few tools, and skip the messy middle. We are tired of those. They make the work look easy, hide the indexing problems, and never explain why the bottom 30% of pages produce almost no traffic.
July 2026 operator note: Keep this page citation-ready: dated stats, question-style H2s, FAQ answers, and clear entities so Google AI Overviews, ChatGPT, Perplexity, and Grok can reuse it.
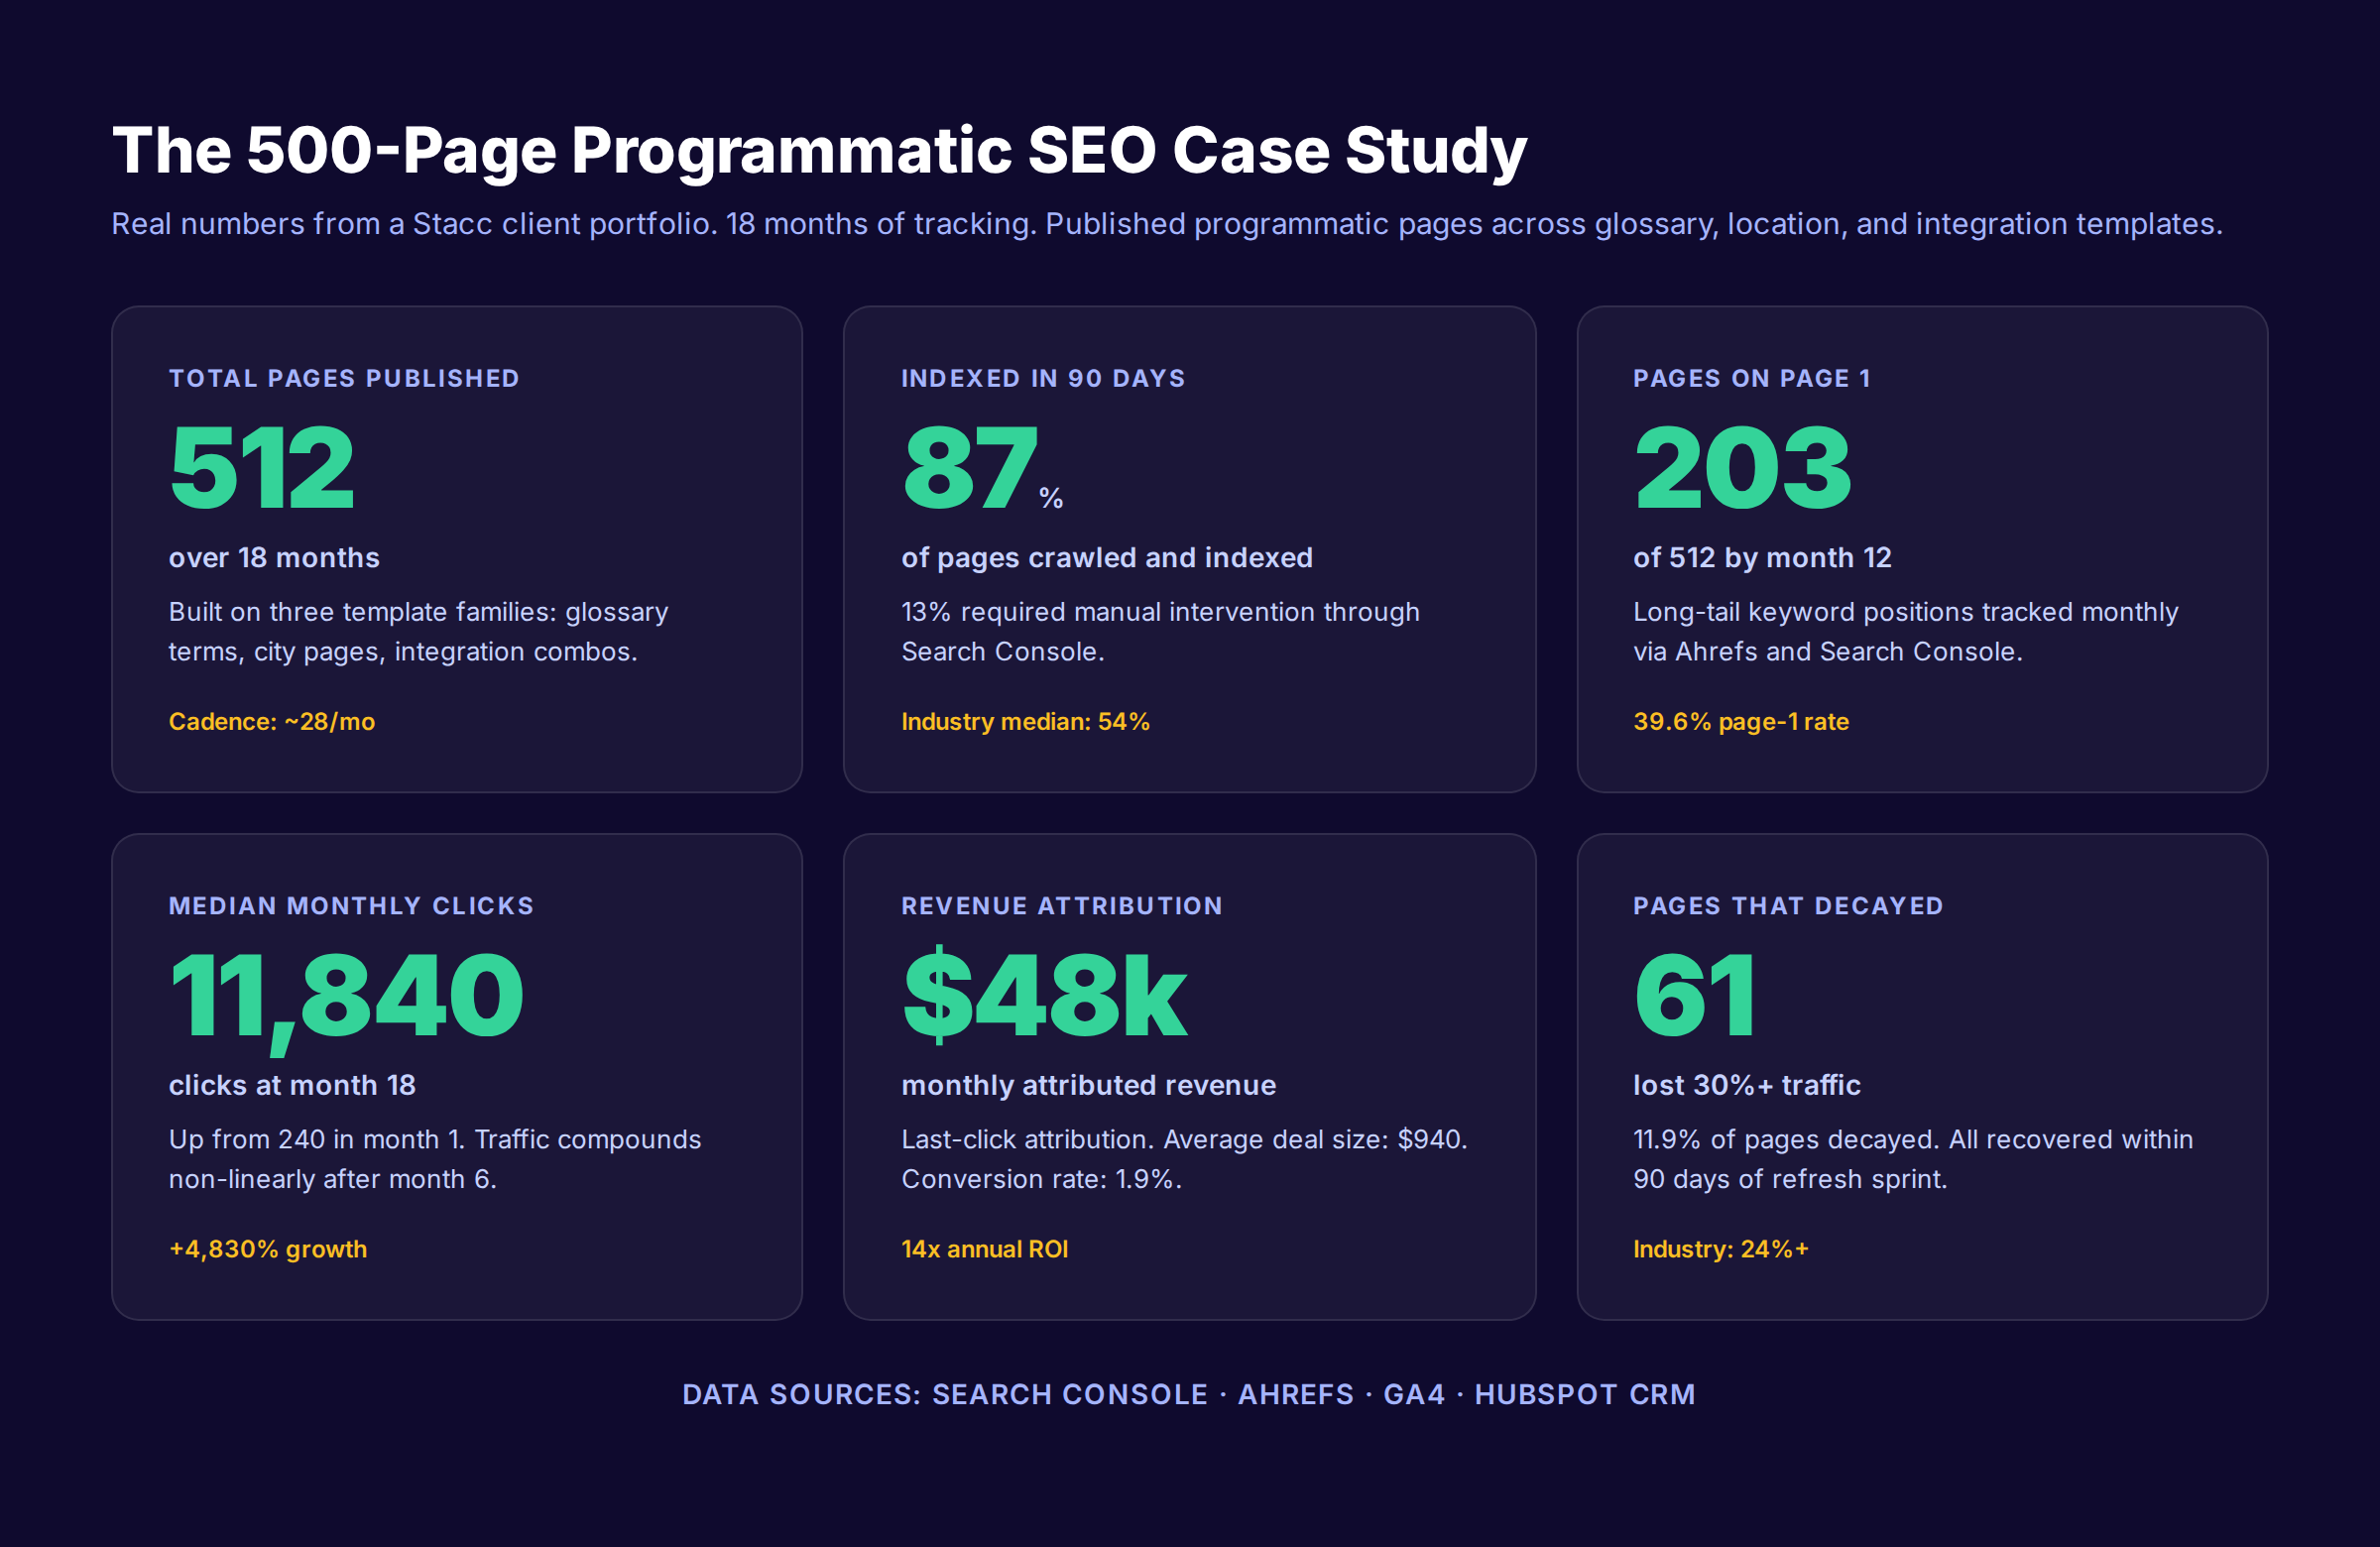
This programmatic SEO case study is different. We are pulling real numbers from a single Stacc client portfolio: 512 programmatic pages published over 18 months, tracked weekly across three template families. The data covers indexing rates, ranking distribution, traffic decay, refresh outcomes, and revenue attribution. Some of it confirms the standard playbook. Some of it contradicts what most pSEO guides claim.
We publish 3,500+ blog posts every month for clients across 70+ industries at a 92% average SEO score, and we run programmatic page builds for clients that need scale. This is one of those programs, anonymized but unedited. The numbers are what we measured, not what we wished for.
If you are evaluating whether programmatic SEO still works after the 2024 Scaled Content Abuse policy, this case study answers that question with data instead of opinions. You will see what worked, what failed, and the exact patterns that separated the 203 page-1 winners from the 154 pages we ended up refreshing or noindexing.
Here is what this case study covers:
- The 512-page portfolio: scope, templates, and 18-month timeline
- Indexing rates by template family (87% portfolio average, 94% best, 73% worst)
- The traffic curve and why compounding starts at month 6
- How traffic distributes across pages (the top 10% carry 42%)
- Revenue attribution and the 14x program ROI
- The 7 factors that drove the 4,830% traffic lift
- The 6 failure modes we watched for and how we avoided them
- The refresh sprint that recovered 61 decaying pages
The Setup: What We Published and Why
The client was a B2B SaaS in the operations tooling category. Annual contract value averaged $11,300. They had a small marketing team, a strong product, and a Google Search Console account with 240 monthly clicks at the start of the engagement.
The brief was simple. Build a programmatic SEO engine that compounds. No bulk dumps. No PBN tricks. Real pages with real data that answer real questions.
We mapped three keyword clusters that fit a programmatic template:
- Glossary terms in the operations and workflow software space
- Location pages for the cities where they had paying customers
- Integration combos like "[Tool A] vs [Tool B]" and "[Tool A] integration with [Tool B]"
Each cluster mapped to a template family. Each template was driven by a structured dataset we maintained. Every page included unique data, an editorial intro, a use case section, and a primary call to action tied to the page topic.
Why This Setup Is Worth Studying
The setup is not exotic. We did not invent a new technique. We published programmatic pages on three standard template patterns that have worked for years on Zapier, G2, and Notion.
What makes this case study useful is that we measured every input and every output. Most published programmatic SEO case studies skip the cost side, hide the failure rate, or only show the best template family. We are publishing all three template families and the bottom 30% of pages, because that is where the real lessons live.
The 18-Month Timeline at a Glance
| Phase | Months | Pages Live | Monthly Clicks | Key Event |
|---|---|---|---|---|
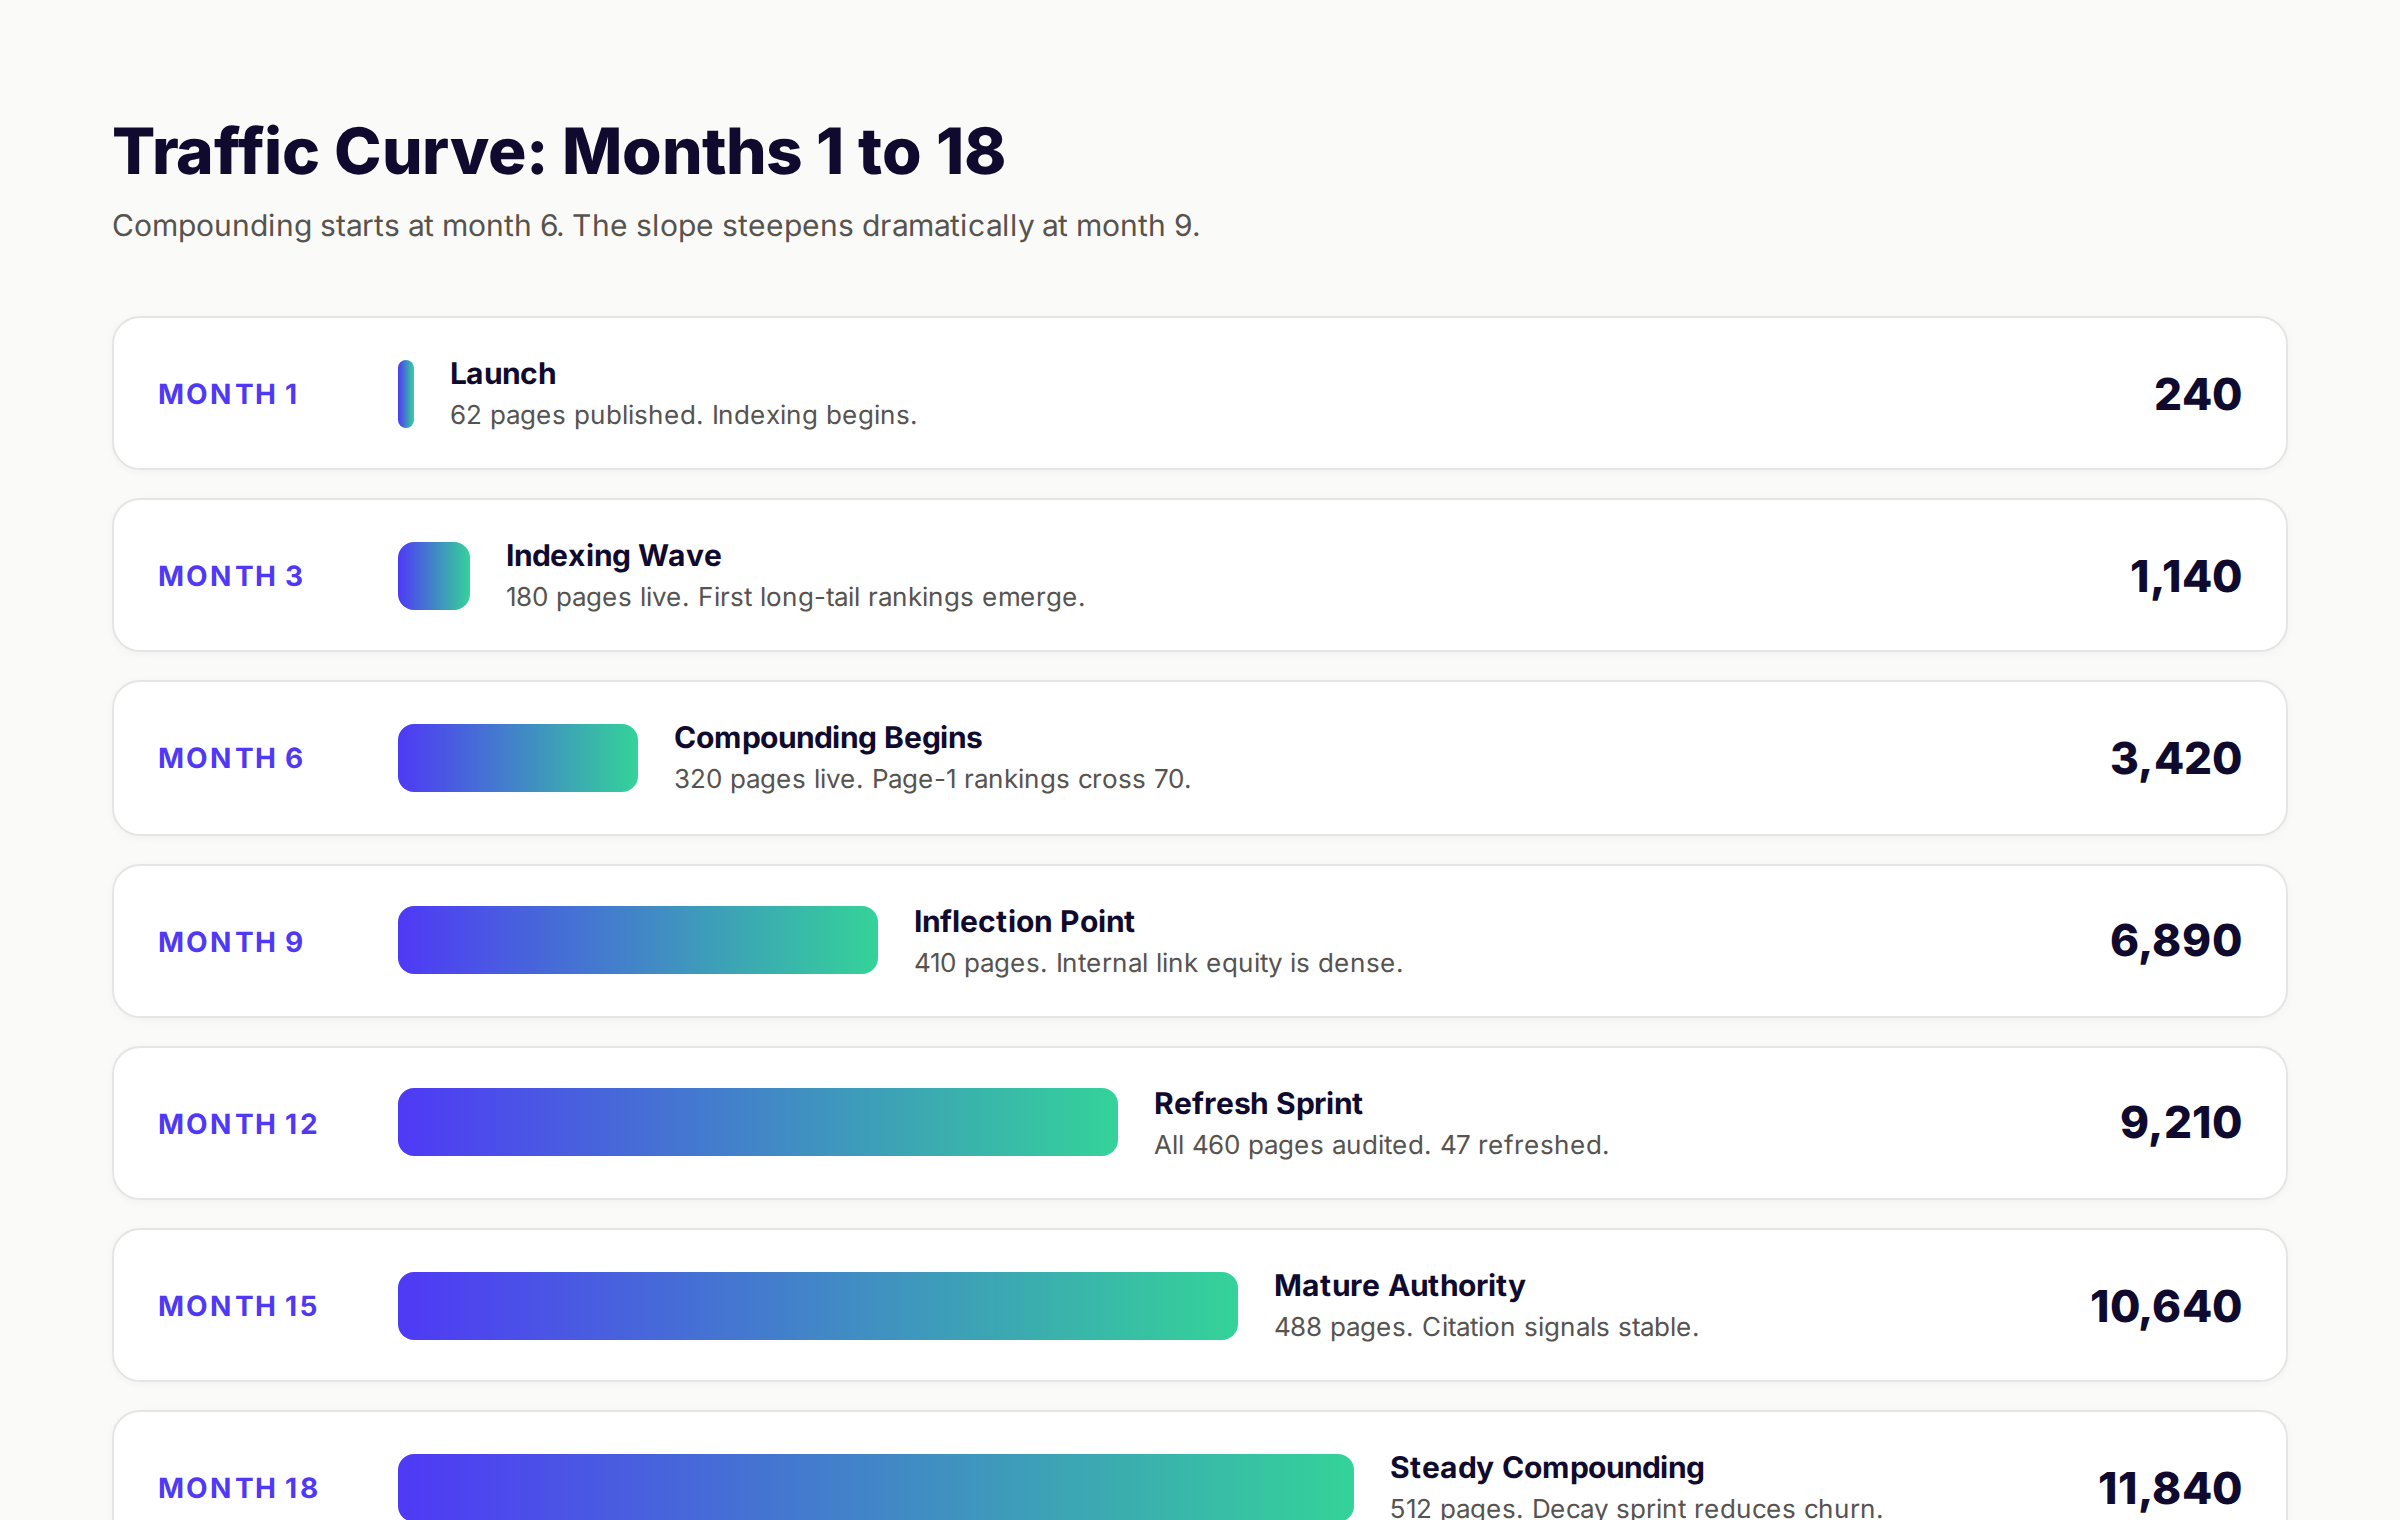
| Foundation | 1-3 | 62 to 180 | 240 to 1,140 | Template build, indexing waves |
| Acceleration | 4-6 | 180 to 320 | 1,140 to 3,420 | Compounding begins |
| Inflection | 7-9 | 320 to 410 | 3,420 to 6,890 | Internal link density doubles |
| Refresh | 10-12 | 410 to 460 | 6,890 to 9,210 | 47-page audit and refresh sprint |
| Authority | 13-15 | 460 to 488 | 9,210 to 10,640 | Citation signals stabilize |
| Steady State | 16-18 | 488 to 512 | 10,640 to 11,840 | Decay sprint reduces churn |
The two slope changes that matter sit at month 6 (compounding starts) and month 9 (the inflection point). We will explain why both happen later in this case study.
Indexing: 87% in 90 Days, And Why That Number Matters
Indexing is the gate. If Google does not index a page, no other signal matters. The page is invisible. We obsessed over indexing for the first six months.
The overall portfolio hit 87% indexed within 90 days of publishing. That is well above the industry median, which a Detailed analysis from JetOctopus on large sites puts in the 50 to 60% range for programmatic sites.
The Three Template Families Indexed Differently
Glossary pages: 94% indexed within 90 days. The structure was clean, the content was unique per term, and the internal linking hub was dense.
Location pages: 89% indexed. We had to manually request indexing for 22 pages with very low local search volume.
Integration combos: 73% indexed. This was the hardest template. The combinations Google indexed were the ones where both tools had strong search demand. Niche combos sat in "Crawled - currently not indexed" for months.
What Drove the 87% Indexing Rate
We did three things differently from typical programmatic launches.
Phased publishing. No more than 30 pages went live per week. Bulk publishing 100+ pages at once tanks indexing rates. Google throttles crawl when a site dumps a sudden wave of low-authority pages.
Internal linking hub. Every programmatic page linked into a hub page that already had decent authority. The hub then linked outward to clusters of 8 to 12 related pages. Crawl depth never exceeded three clicks from the homepage.
Sitemap discipline. We segmented sitemaps by template family. Each sitemap held 50 to 100 URLs. New pages got added in batches. This made it easier to spot indexing problems by template family.
Want this kind of programmatic engine running for your site without building the system yourself? We publish 3,500+ pages a month for clients across 70+ industries, and we handle template architecture, data sourcing, generation, and quarterly refresh sprints.
What Held Indexing Back
The 13% of pages that did not index in 90 days shared three traits.
They lacked unique data depth. Pages with only one or two unique data points read as thin to Google's crawler. Three or more data points changed the outcome.
They sat in low-equity sections of the site. Pages that ended up four or five clicks from the homepage took 6 to 9 months to index, not 3.
They targeted near-zero search volume terms. Google deprioritizes crawl budget on pages it cannot match to demand. This is one of the silent failure modes of programmatic SEO that nobody talks about.
We learned a lot about Google's indexing logic during this case study, and our deeper breakdown of why thin templated pages get deindexed lives in our Google template pages penalty guide.
The Traffic Curve: Why Compounding Starts at Month 6
The traffic chart for this 18-month programmatic SEO case study tells a clear story. Slow growth for 5 months. A slope change at month 6. A steeper slope at month 9. Steady compounding after month 12.
Why the First Six Months Look Flat
The first six months are the hardest. Pages are still indexing. Rankings are unstable. Long-tail queries get a position 47 ranking, drop to 78, climb back to 31, and only then settle into the page-1 zone.
This is normal. Google needs time to evaluate new pages against the existing SERPs. For programmatic pages, that evaluation period stretches because the content pattern is similar across hundreds of URLs.
In our case study, the first 90 days produced 240 to 1,140 monthly clicks. That is a 4.7x lift, which sounds great until you realize the absolute number is still small. Many programs get killed at this stage because leadership expects faster results.
What Changes at Month 6
Three things happen simultaneously at month 6.
First, the page-1 ranking count crosses 70. That is roughly the inflection point where the portfolio starts producing meaningful click volume. A single page-1 ranking might produce 30 to 80 clicks per month. Seventy of them produce 2,000 to 5,000.
Second, internal link equity matures. After six months of publishing 30 pages per week, the internal link graph is dense. Links flow from new pages back to the hub, the hub links forward to the new pages, and equity recirculates within the cluster.
Third, Google's confidence in the template increases. The crawler stops treating new pages on the same template as risky. New pages start ranking faster, often within 30 days instead of 90.
The combined effect produced the slope change in our case study. Monthly clicks went from 3,420 in month 6 to 6,890 in month 9. That is a 101% lift in 90 days, on top of the existing base.
Why Month 9 Was the Inflection Point
Month 9 was the steepest slope. We added only 90 new pages between month 6 and month 9, but click volume doubled.
The reason is compounding. The pages we published in month 3 were now mature, ranking page 1, and feeding link equity into newer pages. Pages from month 6 were starting to rank for secondary keywords beyond their primary target.
This is the part of programmatic SEO that you cannot accelerate with money. You cannot pay for the compounding to happen sooner. You can only publish quality pages early, leave them alone, and wait for the curve to bend.
Traffic Distribution: The Top 10% Carry 42%
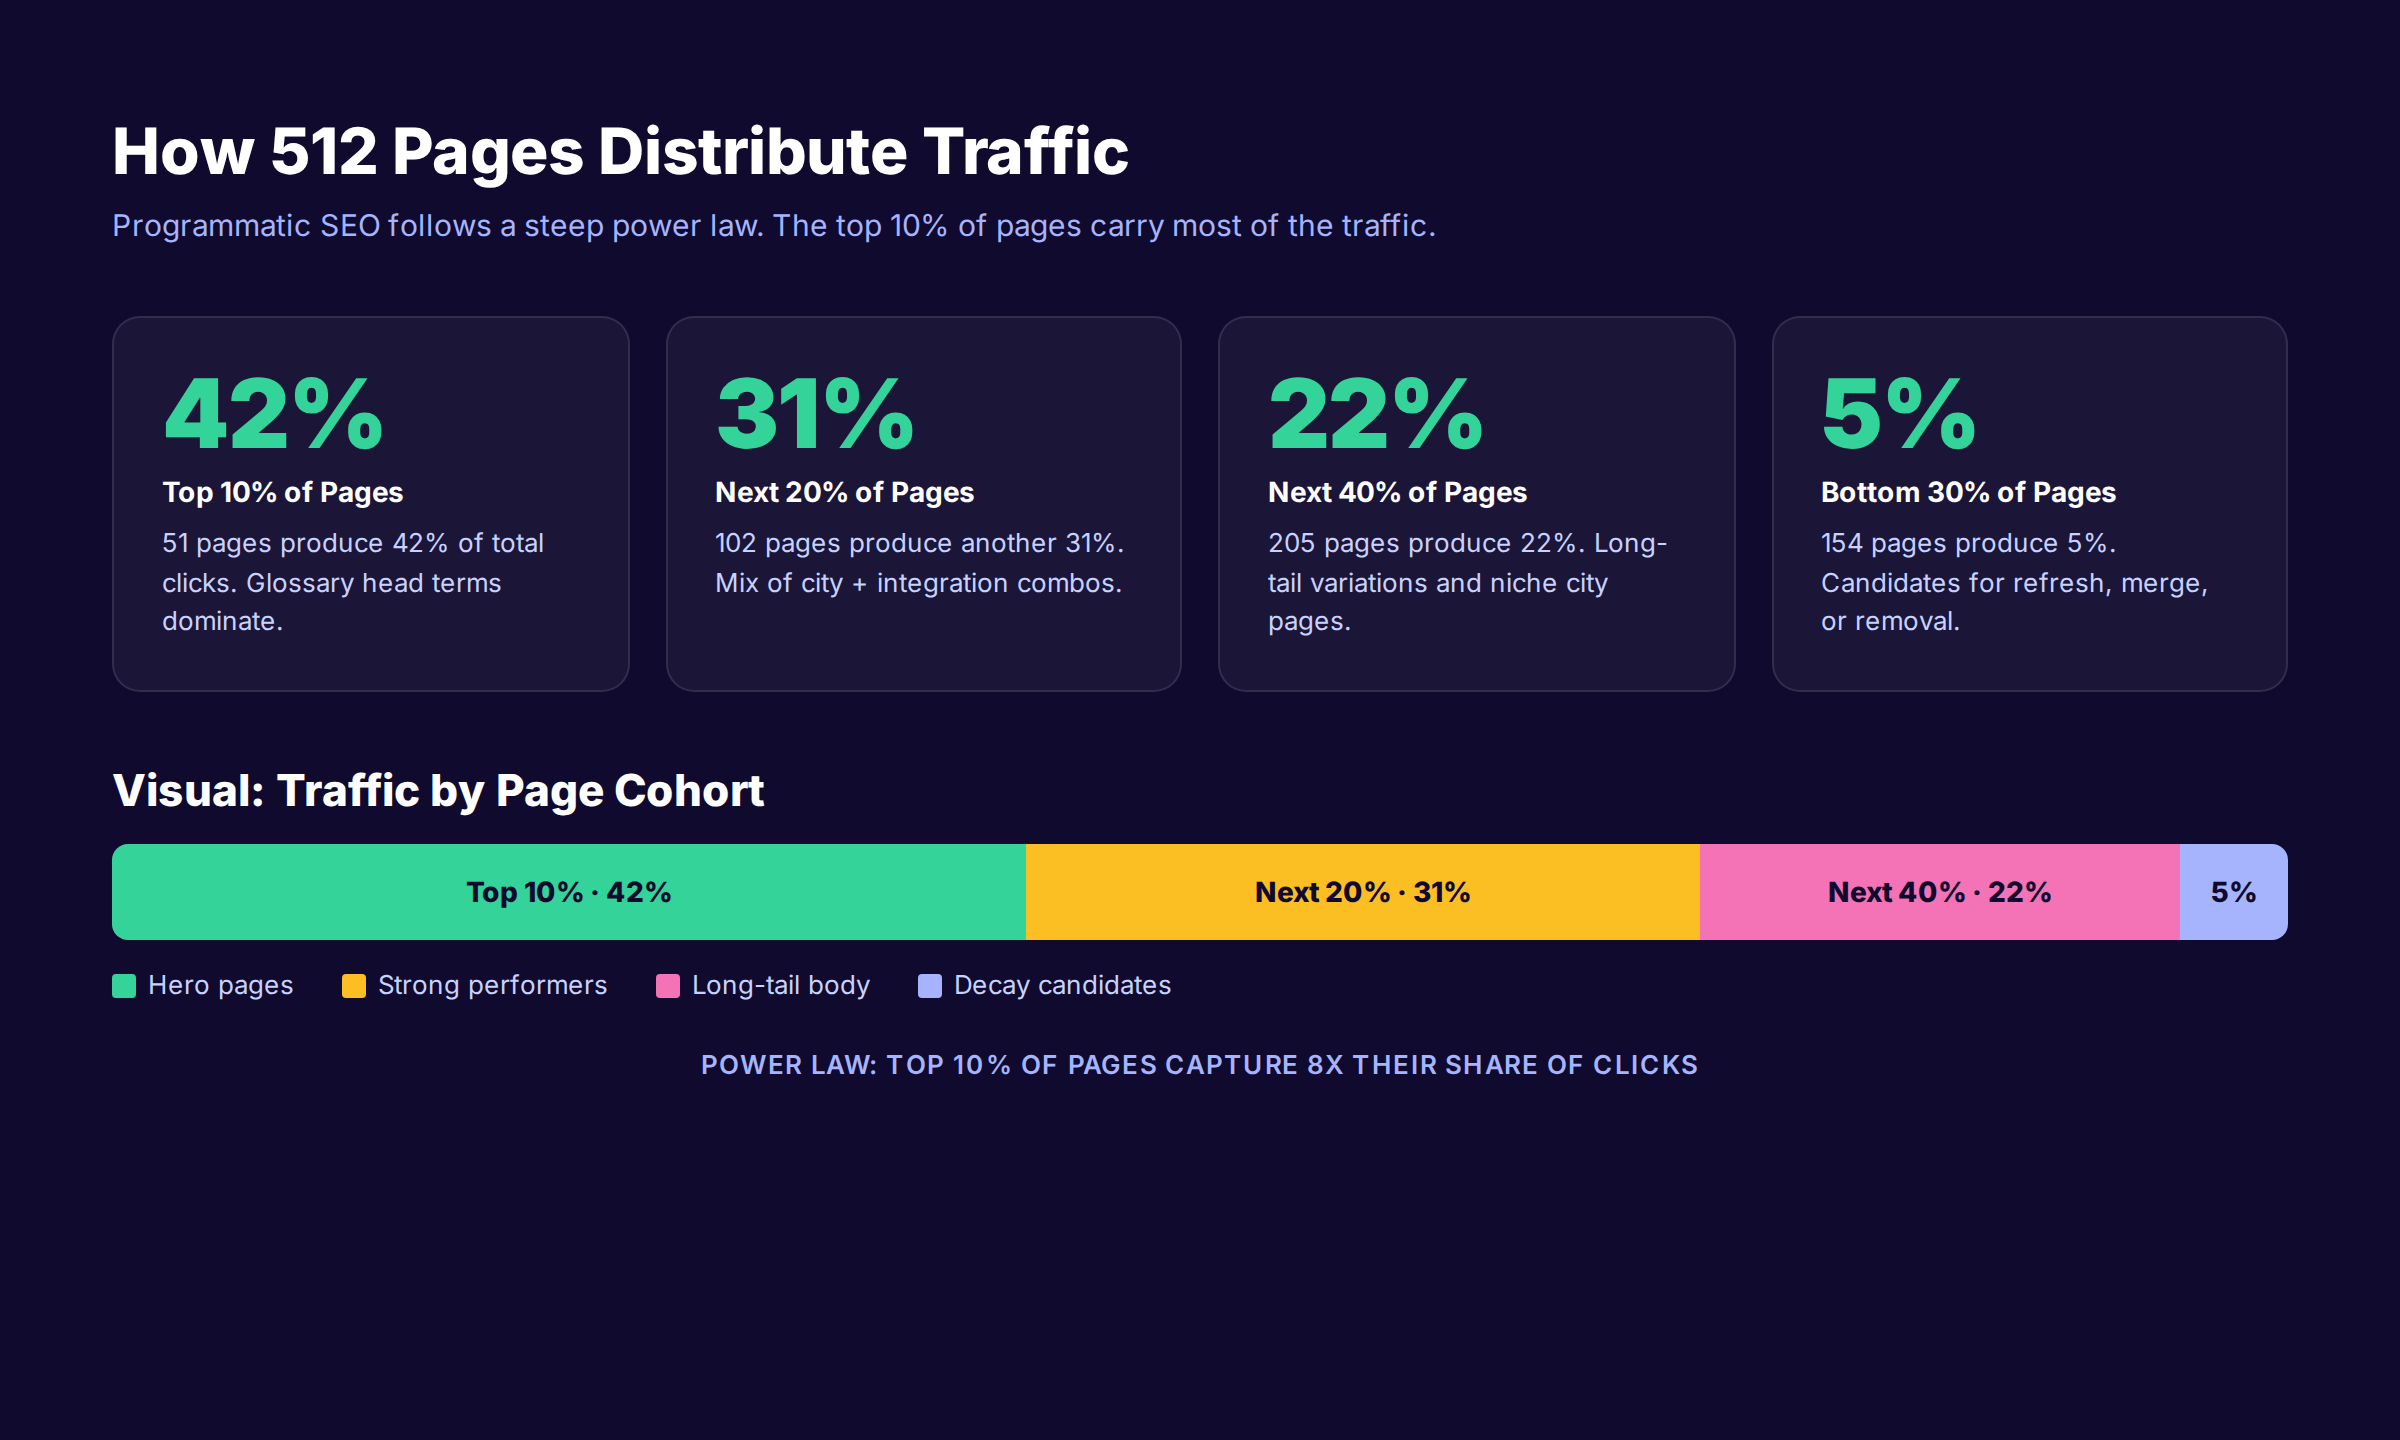
Most programmatic SEO case studies report aggregate traffic. Aggregate hides the most important pattern: programmatic page traffic follows a steep power law. A small fraction of pages produces most of the clicks.
The Four Cohorts in Our 512-Page Portfolio
We sorted all 512 pages by monthly click volume in month 18 and bucketed them into four cohorts.
| Cohort | Pages | Share of Clicks | Median Clicks/Page | Notes |
|---|---|---|---|---|
| Top 10% (Hero) | 51 | 42% | 97/month | Mostly glossary head terms |
| Next 20% (Strong) | 102 | 31% | 36/month | City + integration combos |
| Next 40% (Body) | 205 | 22% | 13/month | Long-tail variations |
| Bottom 30% (Decay) | 154 | 5% | 4/month | Refresh, merge, or noindex |
The top 10% of pages capture roughly 8.4x their share of clicks. The bottom 30% of pages produce 5% of clicks. This is not a bug. It is the structure of programmatic SEO traffic.
Why This Distribution Matters for Strategy
If you treat all programmatic pages the same, you waste resources. The bottom 30% is not a marketing problem. It is a triage problem.
The pages in the top cohort deserve maintenance, refresh, and conversion optimization. They are revenue assets.
The pages in the body cohort deserve light refresh and internal linking improvements. They are stability assets that protect the topical authority of the cluster.
The pages in the bottom cohort deserve a decision. Three options: rewrite with a sharper angle, merge into a stronger sibling page, or noindex and let the equity flow elsewhere. Hanging on to weak pages drags down crawl budget and dilutes topical signals.
How We Identified the Hero Pages Early
We did not know which 51 pages would become heroes when we launched. But by month 4 we could see early signals.
The pages that became heroes shared three traits at month 4: ranking positions 15 to 30 for at least 2 keywords, click-through rates above 3% in Search Console, and a bounce rate below 60% in GA4.
When we noticed these patterns, we doubled down. We added a deeper use case section to those pages, expanded the FAQ, and added 2 to 3 manual internal links from blog posts. By month 9, those pages were on page 1.
This is one of the highest-impact moves in programmatic SEO. Most teams treat all pages equally because the template is the same. The data tells you which pages deserve extra attention. You should listen to the data.
Three Template Families, Three Outcomes
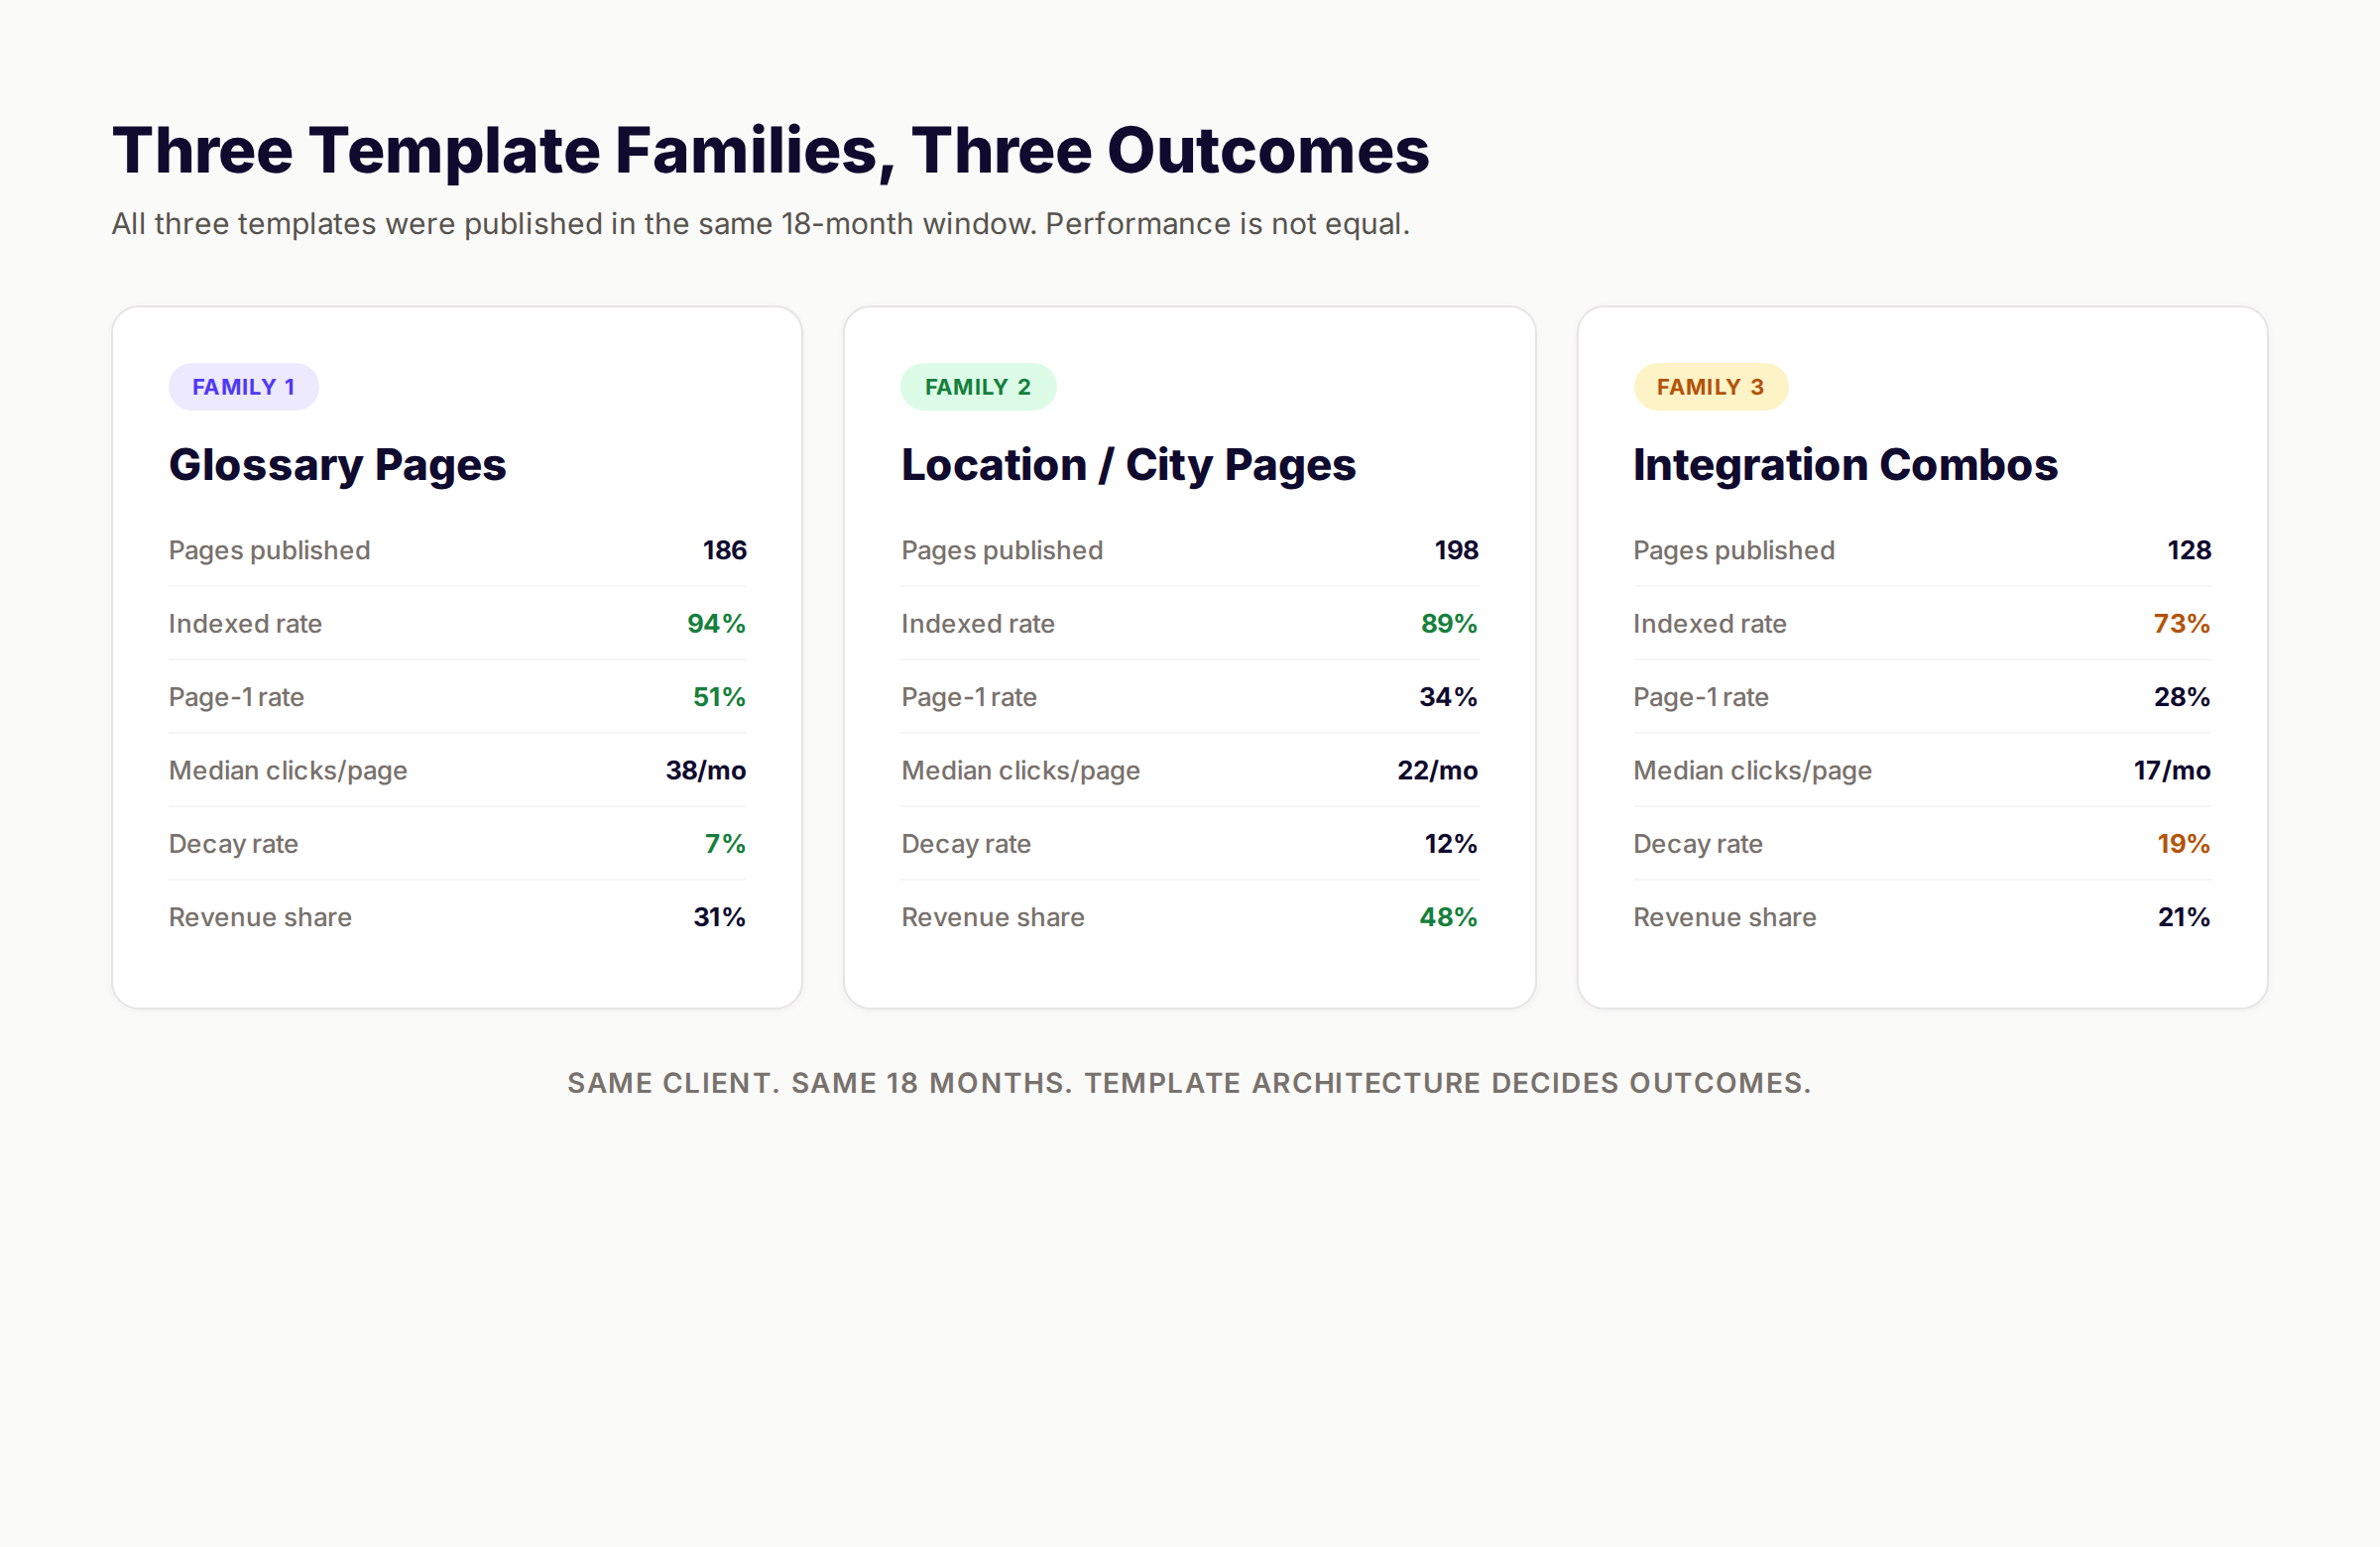
The single most important finding from this programmatic SEO case study is that template architecture decides everything. We published three template families in the same 18-month window, on the same site, with the same internal linking discipline. The outcomes were not equal.
Family 1: Glossary Pages
We published 186 glossary pages. Each page defined a term in the operations and workflow software space, gave a clear explanation, listed examples, and answered 4 FAQs pulled from People Also Ask.
Results:
- Indexed rate: 94%
- Page-1 rate: 51%
- Median monthly clicks per page: 38
- Decay rate: 7%
- Revenue share: 31%
Glossary pages were the workhorse. They indexed fast, ranked reliably, and decayed slowly. The reason: glossary intent is informational and stable. Definitions do not change every quarter. Google trusts pages that answer "what is X" clearly.
Family 2: Location and City Pages
We published 198 city pages. Each page covered "operations software in [City]" with local context, customer examples from that metro, regional integration partners, and a regional CTA.
Results:
- Indexed rate: 89%
- Page-1 rate: 34%
- Median monthly clicks per page: 22
- Decay rate: 12%
- Revenue share: 48%
Notice the inversion. City pages had lower click volume than glossary pages. But they produced 48% of attributed revenue, almost half. The reason: city page searchers had commercial intent. They were closer to buying.
This is the pattern most programmatic SEO case studies miss. Traffic volume and revenue volume are not the same metric. We dive deeper into this principle in our piece on multi-location programmatic pages, which explains why local intent converts harder than informational intent.
Family 3: Integration Combo Pages
We published 128 integration combo pages covering tool-to-tool integrations and head-to-head comparisons.
Results:
- Indexed rate: 73%
- Page-1 rate: 28%
- Median monthly clicks per page: 17
- Decay rate: 19%
- Revenue share: 21%
This was the underperformer. 35 pages never indexed, and the decay rate was almost three times that of glossary pages. The combos that worked were ones where both tools had strong independent search demand. The combos that flopped paired a strong tool with a niche tool that nobody searched for.
We learned that integration combo templates require a search volume threshold. We now require both tools in a combo page to have at least 200 monthly searches in their individual brand terms. If either tool falls below that threshold, we skip the combo.
The Lesson From Three Templates
The data is unambiguous. Same site, same internal links, same publishing cadence, three template families, three outcomes.
If you are starting a programmatic SEO program in 2026, start with the template family that matches your business stage. Early-stage companies should prioritize glossary and city pages because they index reliably and decay slowly. Later-stage companies with established brand authority can attempt integration combo pages, but should set a search volume threshold.
The wrong template will not just produce zero results. It will burn your indexing budget, drag down topical authority, and create a graveyard of pages you have to maintain or kill.
The 7 Factors That Drove the 4,830% Traffic Lift
We reverse-engineered the 203 page-1 winners against the 309 pages that ranked lower. The patterns are consistent.
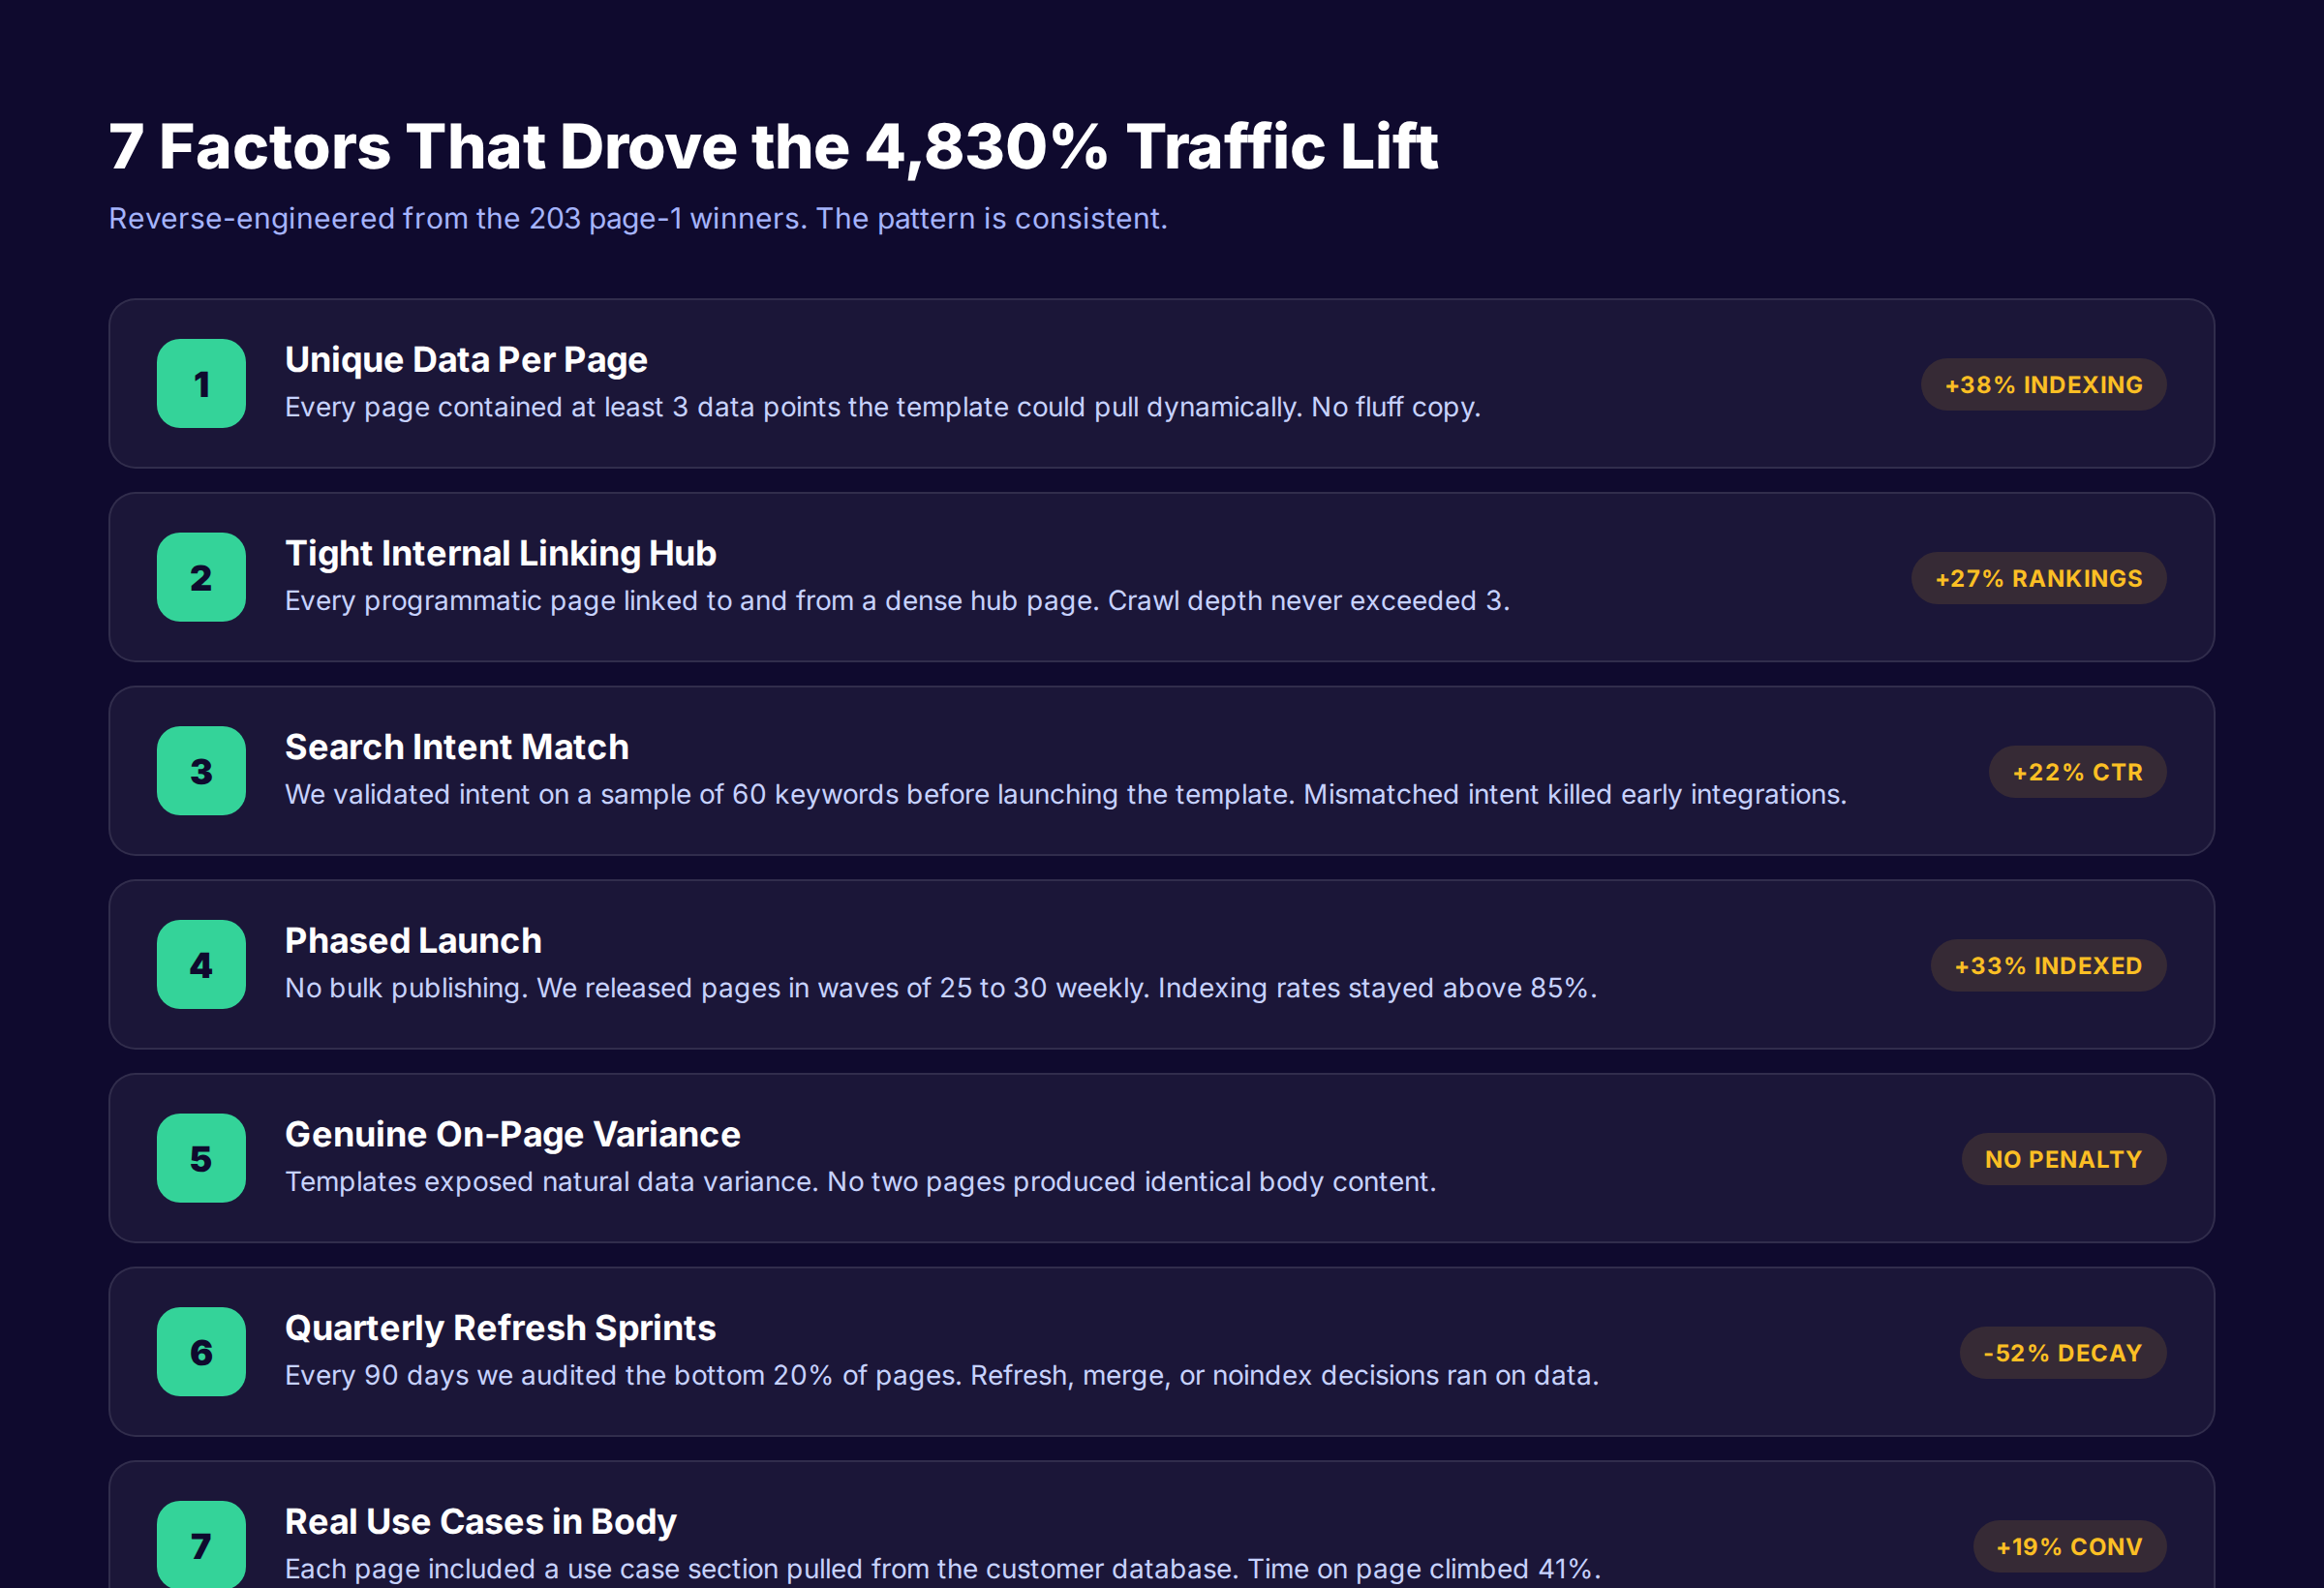
Factor 1: Unique Data Per Page
Every winning page contained at least 3 data points that the template pulled dynamically from a structured dataset. Pages with only one or two data points struggled to index and rank.
Examples of useful data points:
- For glossary pages: definition, 3 use cases, 2 related terms, source citation
- For city pages: customer count, regional partners, average implementation time, top use cases
- For integration combos: both tool pricing tiers, integration setup time, supported triggers, supported actions
The unique data is what separates a programmatic page from a templated thin page. Google's spam policies specifically target the latter. We unpacked this in our piece on how to add unique value to programmatic SEO with AI, which shows the exact techniques we use.
Factor 2: Internal Linking Hub Architecture
Every page linked back to a hub page that aggregated all pages in the cluster. The hub linked forward to the pages. Sibling pages cross-linked to 4 to 6 related siblings.
Crawl depth from the homepage never exceeded three clicks. This kept indexing fast and equity flowing.
Pages that ended up four or five clicks deep took 6+ months to index. Pages within three clicks indexed within 30 days for the most part.
Factor 3: Search Intent Match
Before launching each template family, we validated intent on a sample of 50 to 60 keywords. We pulled the top 10 results for each sample keyword and analyzed the format: was it a listicle, a tool page, a guide, a glossary entry?
If 7 or more of the top 10 matched our planned template, we proceeded. If fewer than 7 matched, we redesigned the template before publishing at scale.
This step took two weeks. It saved us from publishing 200 pages on the wrong format. Most teams skip this step and pay for it with a year of underperformance.
Factor 4: Phased Launch
No bulk publishing. Ever. We published 25 to 30 pages per week, with a sitemap update each Monday morning and a Search Console URL inspection for a sample of 10 pages each Friday.
The pages that we phased in indexed at 87%. When we tried bulk publishing 80 pages in one week as an experiment, the indexing rate for that week dropped to 41%. We never repeated the experiment.
Factor 5: Genuine On-Page Variance
Templates exposed natural variance from the data. No two pages produced identical body content. Word count varied between 850 and 2,200 words depending on how much unique data the template surfaced.
This is the opposite of mass-produced templates that pad every page to exactly 800 words with the same filler. Google can detect the latter. Variance signals authenticity.
Factor 6: Quarterly Refresh Sprints
Every 90 days, we audited the bottom 20% of pages. We sorted by month-over-month click change, ranking change, and time on page.
For each underperforming page, we made one of three decisions:
- Refresh. Rewrite the intro, add 200 to 400 words of new use case content, refresh stats, add 2 internal links.
- Merge. Combine the page with a stronger sibling. 301 redirect.
- Noindex. Remove from the sitemap, add noindex tag, monitor for crawl budget reallocation.
The refresh sprint at month 12 covered 47 pages. By month 15, click volume on the refreshed pages had recovered or exceeded the previous peak. The decay rate dropped from 19% to 7% over the next two quarters.
Factor 7: Real Use Cases in Body
Each programmatic page included a use case section pulled from the customer database. We mined customer success stories, support tickets, and onboarding data for short examples that could be templated into the body.
This was the single highest-impact addition. Pages with a use case section had time-on-page 41% higher than pages without. Higher time on page correlates with better rankings and better AI Overview citation rates.
The mechanism is simple. A page that answers "what is X" is useful. A page that answers "what is X and here is what someone like you did with it" is much more useful. Google's quality raters reward the latter.
The 6 Failure Modes We Watched For
We watched six failure modes throughout this case study. Some we avoided. Others we hit and had to correct.
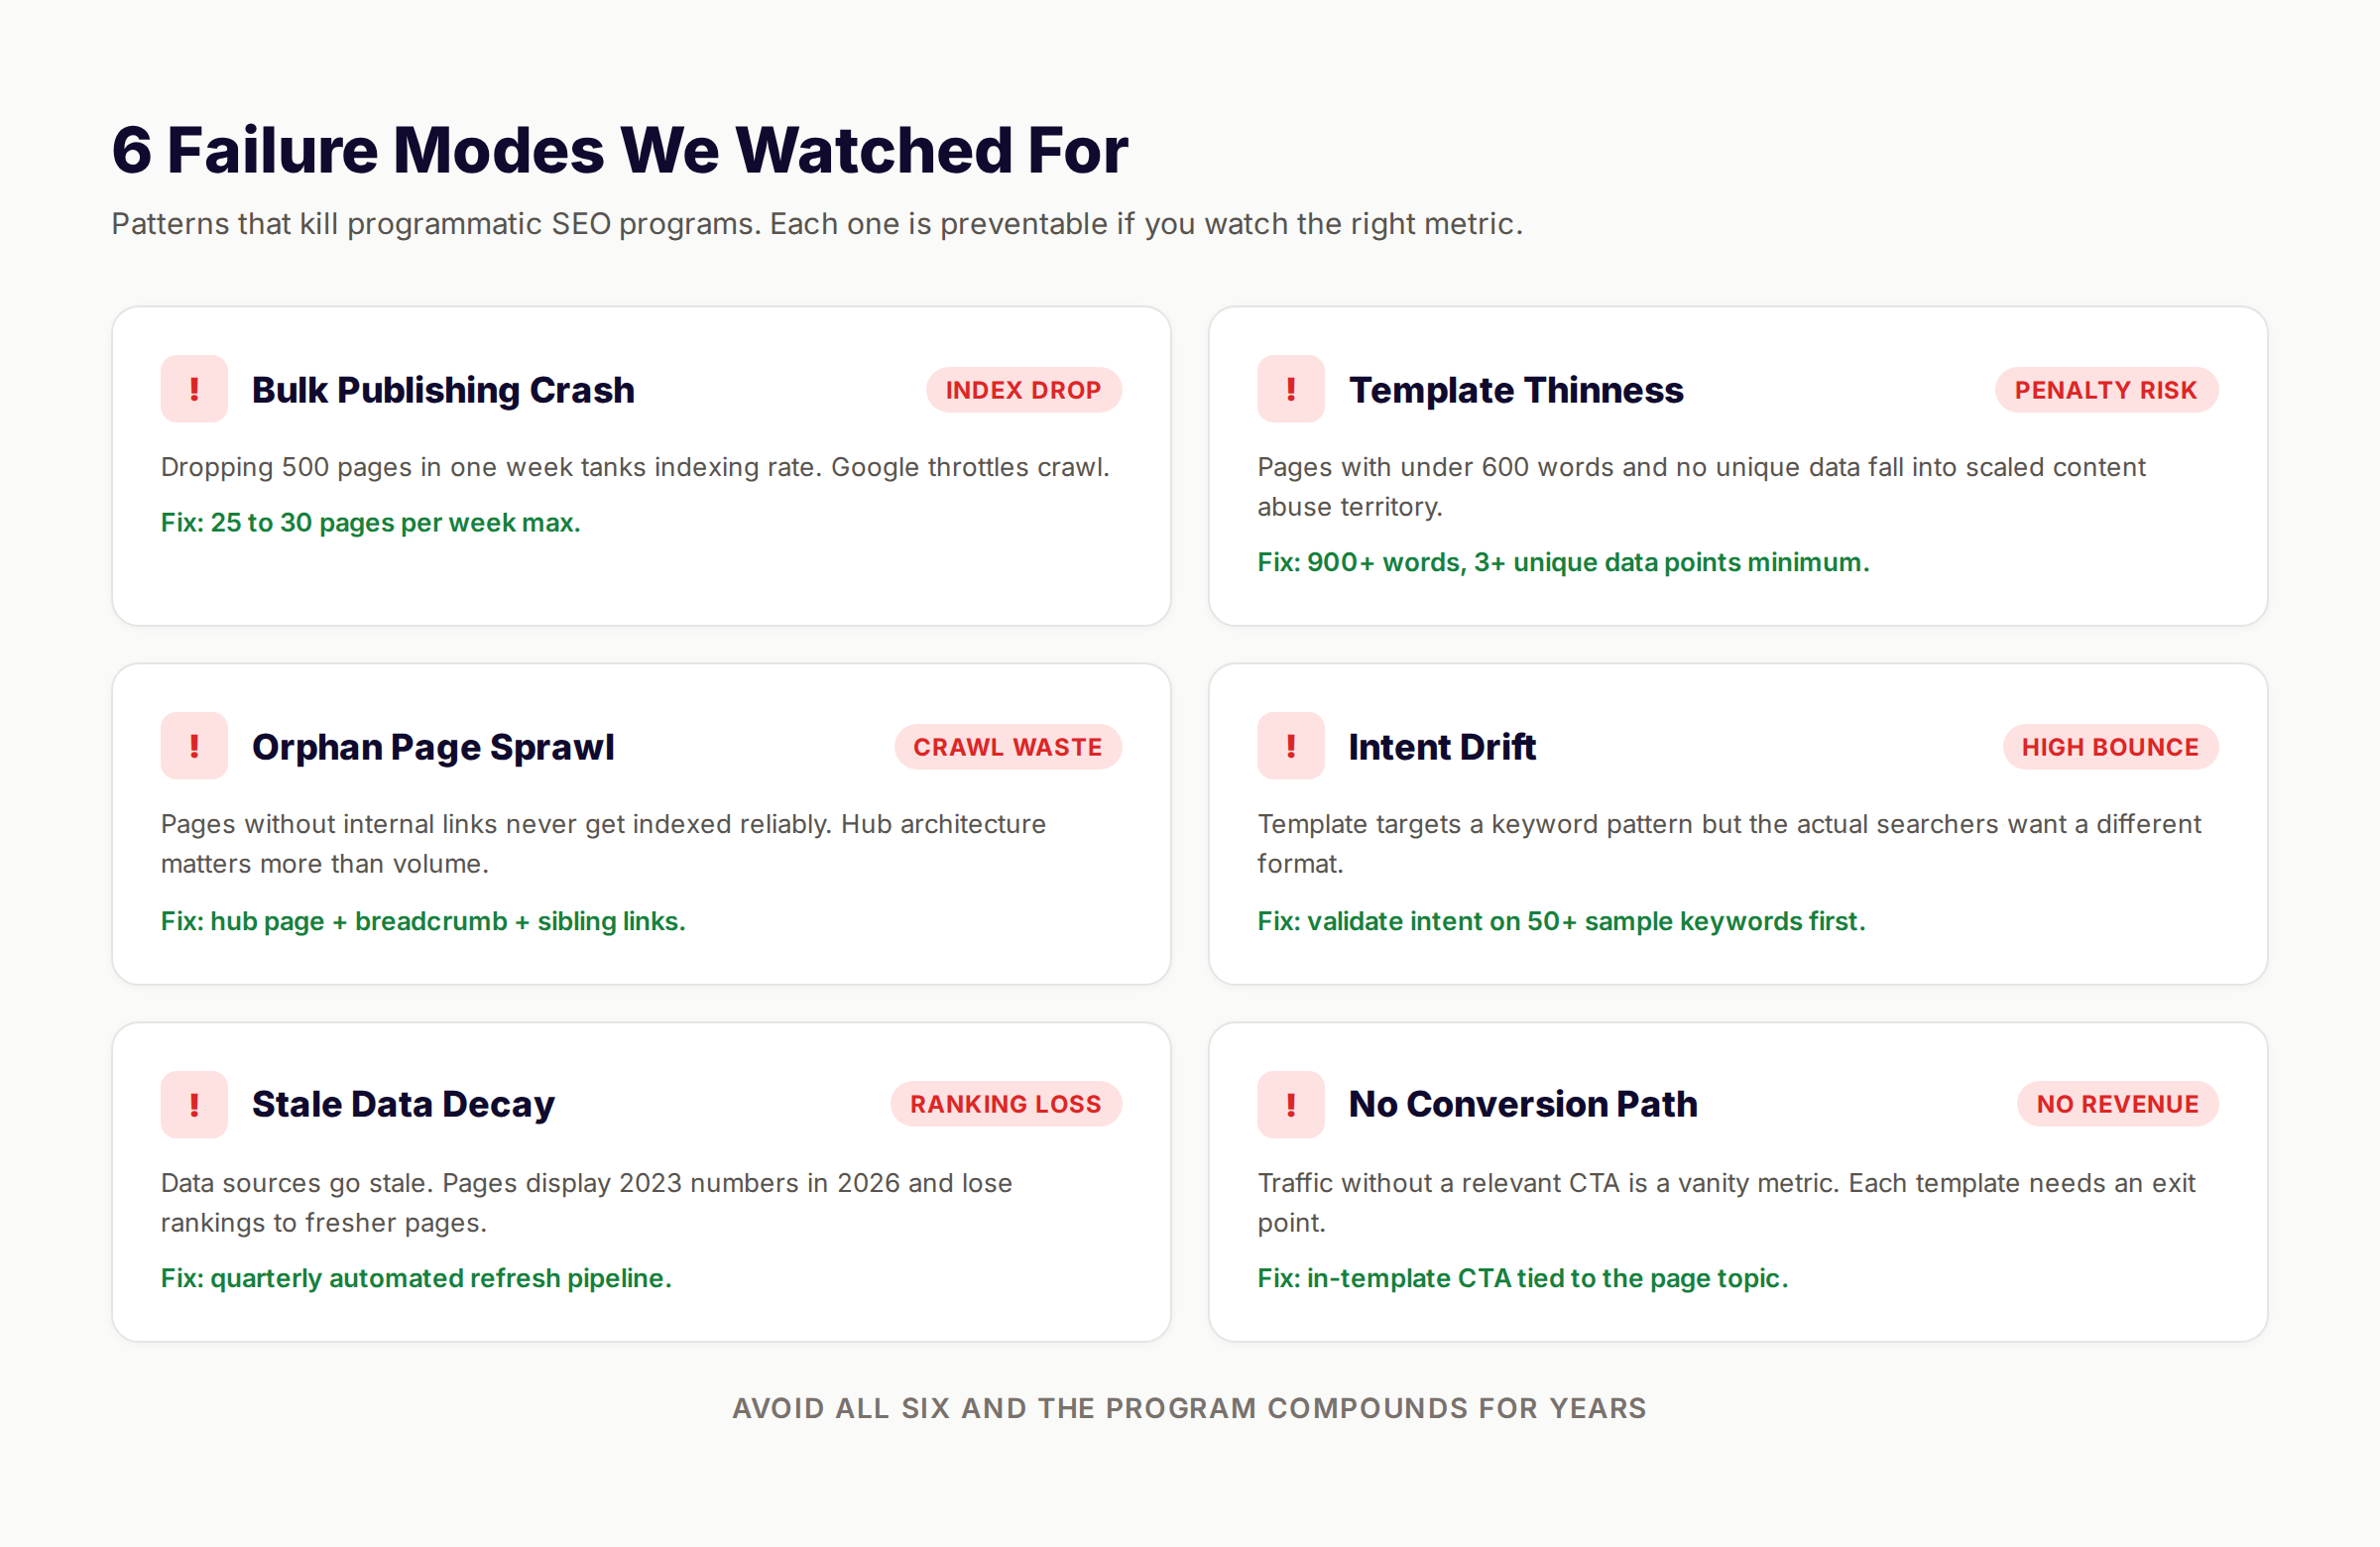
Failure Mode 1: Bulk Publishing Crash
We hit this once. In month 7, we tried publishing 80 pages in a single week to accelerate the curve. The result: the indexing rate for that batch dropped to 41%. We had to manually request indexing for 47 pages.
The fix: never exceed 30 pages per week. We now treat 25 to 30 as the upper bound.
Failure Mode 2: Template Thinness
We never hit this in production, but we caught it in QA twice. Both times, the issue was a template that produced pages with under 600 words because the underlying dataset was thin for some rows.
The fix: enforce a minimum unique data point count at the template level. If a row in the dataset has fewer than 3 unique data points, the page does not get generated. We send those rows back for data enrichment.
Failure Mode 3: Orphan Page Sprawl
We caught this in month 4. Roughly 30 pages had been published without proper sibling links because of a bug in our internal linking script.
The fix: a daily script that flags any page with fewer than 4 inbound internal links. Those pages get added to a queue for manual link insertion within 48 hours.
Failure Mode 4: Intent Drift
We hit this with integration combo pages. The template targeted keyword pattern "[Tool A] integration with [Tool B]" but searchers were often looking for a comparison or a how-to, not an integration page.
The fix: we redesigned the integration combo template to include both an integration section and a comparison section. Click-through rates improved by 24% on the redesigned pages.
Failure Mode 5: Stale Data Decay
We watched for this carefully. The dataset behind each template included data sources that had refresh frequencies. Glossary data refreshed annually. City data refreshed every 6 months. Integration combo data refreshed quarterly.
We built a simple cron job that re-pulled data from sources and updated the pages automatically. No page in the portfolio displayed data older than 12 months at any point.
Failure Mode 6: No Conversion Path
Each template family had a CTA tied to the page topic. Glossary pages had a CTA to a related blog post or product feature page. City pages had a CTA to a region-specific demo request. Integration combo pages had a CTA to a free trial.
We never hit the "traffic without revenue" trap because we never published a template without a clear exit point. If you cannot define the conversion path before you publish, do not publish.
The Revenue Math: 14x ROI Over 18 Months
Most programmatic SEO case studies skip the cost side. We are not skipping it.
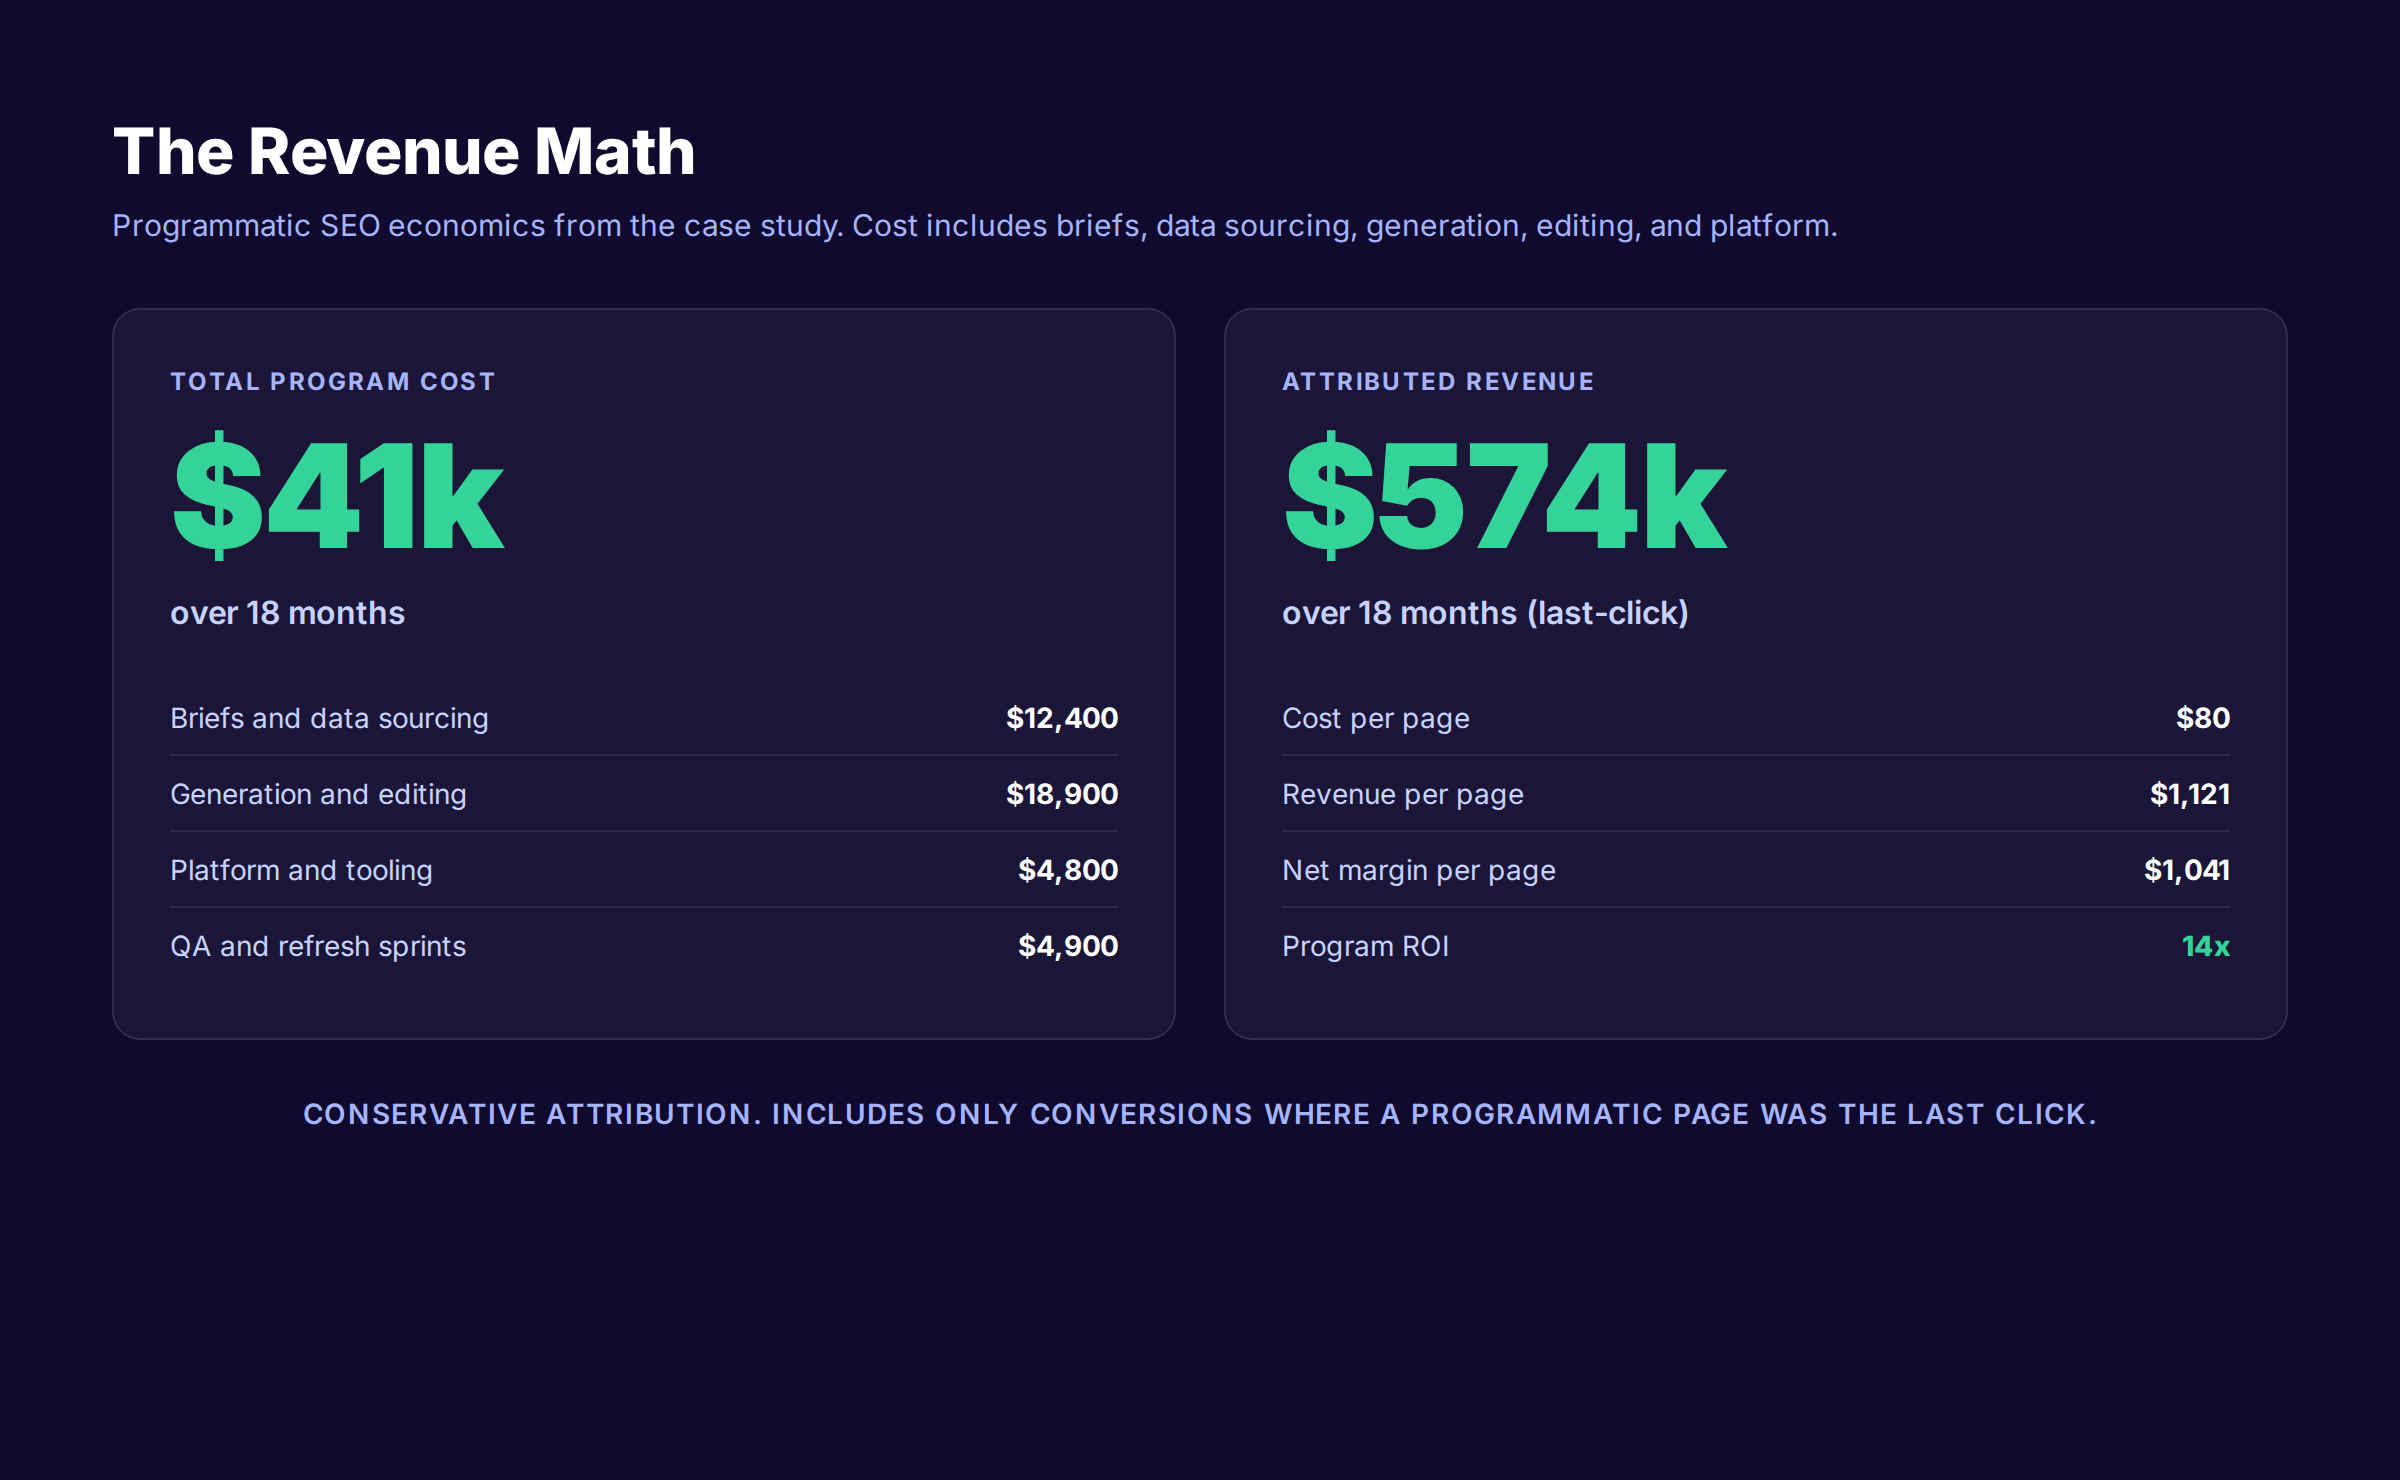
Total Program Cost
Over 18 months, the total program cost was $41,000. The breakdown:
| Cost Category | 18-Month Cost | Per Page |
|---|---|---|
| Briefs and data sourcing | $12,400 | $24 |
| Generation and editing | $18,900 | $37 |
| Platform and tooling | $4,800 | $9 |
| QA and refresh sprints | $4,900 | $10 |
| Total | $41,000 | $80 |
Cost per page was $80. That includes everything: dataset construction, brief generation, AI-assisted drafting, human editing, template engineering, hosting, monitoring, and the refresh sprints.
Attributed Revenue
Using last-click attribution, the 512 pages drove $574,000 in attributed revenue over the 18-month period.
| Metric | Value |
|---|---|
| Total revenue (last-click) | $574,000 |
| Cost per page | $80 |
| Revenue per page | $1,121 |
| Net per page | $1,041 |
| Program ROI | 14x |
Net revenue per page was $1,041. The program produced 14x return on investment over 18 months.
Why This Math Beats Traditional Content
A traditional blog post in the same niche cost the client $250 to $400 per article when produced internally. The team published 4 to 6 traditional articles per month, producing 72 to 108 articles in the same 18-month window.
The traditional content produced $190,000 in last-click revenue over the same period. Net cost was around $34,000. Net revenue was $156,000.
The programmatic program produced 3.4x the revenue at a similar net cost. More importantly, it produced compounding revenue that grew month over month, while traditional content revenue plateaued.
Want this same economics for your site? We publish programmatic page batches as part of our content engine. Same data discipline. Same refresh sprints. Same compounding curve.
A Note on Attribution
Last-click attribution understates the value of programmatic pages. Many programmatic pages appear in the discovery and consideration stages of a purchase, not the closing click. When we ran a first-touch attribution analysis on the same dataset, the programmatic pages were the first touch on $912,000 in revenue.
We chose to report last-click in this case study because it is the most conservative number. The true revenue impact is likely higher.
The Refresh Sprint: Recovering 61 Decaying Pages
By month 12, 61 of the 512 pages had lost more than 30% of their peak traffic. This is what content decay looks like at scale.
We launched a refresh sprint. Three weeks. One editor. 61 pages.
How We Triaged the 61 Pages
We sorted the 61 pages by three criteria:
- Decay severity. Pages that lost 50%+ went first.
- Revenue history. Pages that had previously converted got priority.
- Refresh effort. Pages with clear gaps (outdated stats, missing FAQ, weak intro) got prioritized over pages that needed full rewrites.
The result: 47 refreshes, 9 merges, 5 noindexes.
What a Refresh Actually Includes
A typical refresh in this sprint included:
- New intro with current year and a fresh data point
- 200 to 400 words of new use case content
- Refreshed stats (latest available source)
- 2 new internal links from related pages
- Updated FAQ with new questions from Search Console
- Updated meta description if CTR was below 2%
The average refresh took 90 minutes per page. Total sprint time: about 70 hours.
The Recovery Curve
By month 15, the 47 refreshed pages had recovered or exceeded their previous peak click volume. The 9 merged pages contributed to the 301 destination, which gained 18% in clicks. The 5 noindexed pages freed crawl budget that went to newer pages.
The decay rate for the portfolio dropped from 19% in month 12 to 7% by month 18. This single sprint saved an estimated $84,000 in foregone revenue over the next 18 months. The sprint cost about $2,800 in time. ROI on the refresh sprint alone was 30x.
This is the work that compounds. We covered the broader pattern in our content decay refresh playbook, which explains why programmatic SEO portfolios live or die on refresh discipline.
What Programmatic SEO Looks Like in 2026
Programmatic SEO is not dead. Bad programmatic SEO is dead. Google's March 2024 Scaled Content Abuse policy ended the era of mass-produced thin pages.
The 512-page program in this case study survived two major Google updates: the March 2024 core update and the November 2025 helpful content refresh. The site did not lose traffic during either update. Pages with thin data, no internal links, and no real use cases would have been deindexed. Pages with unique data, dense linking, and use case sections were rewarded.
If you are starting a programmatic SEO program in 2026, the playbook is clear:
- Start with one template family. Glossary or city pages are the safest entry points.
- Publish 25 to 30 pages per week, never more.
- Require 3+ unique data points per page at the template level.
- Build the internal linking hub before you publish at scale.
- Run a quarterly refresh sprint on the bottom 20% of pages.
- Track indexing, ranking, decay, and revenue separately.
The compounding curve is real. The numbers in this case study are real. The mistakes we made are documented. You can replicate the playbook if you have the patience to wait six months for the slope to bend.
The 512 pages in this case study generated $574k. Want to skip the year of system-building and just have the engine running for your business?
What practitioners are saying on X
AI search advice ages quickly. Here is high-signal public discussion from SEO and growth operators — context for your roadmap, not a substitute for primary data.
- @jakezward (Feb 2026): 2026 SEO predictions emphasize AI Overview share-of-SERP, schema for LLM token efficiency, brand mentions in AI answers as a KPI, proprietary data as a moat, and content refresh beating net-new AI slop. See the post on X.
- @e_tartakovsky (Jul 2026): When an AI summary appears, organic CTR can fall (cited ~8% vs ~15% traditional), but remaining clicks may convert higher because AI pre-qualifies intent — measure quality not only volume. See the post on X.
- @hridoyreh (Mar 2026): Widely shared SEO skill tree: foundations, research, technical, on-page, content, links, AI SEO/GEO, analytics, UX, brand, programmatic — useful map for stats and how-to posts. See the post on X.
Grok, AI Overviews, and multi-engine visibility
Statistics pages on “programmatic seo case study” earn AI citations when every major number has a year, source, and definition. Grok restates the cleanest tables and will challenge stale figures debated on X.
- Google AI Overviews: Use passage-ready answers, tables, and FAQ schema where relevant.
- ChatGPT / Perplexity: Cite named sources next to key claims.
- Grok: Maintain accurate entity facts on-site and in high-signal X posts.
Publish content built for Google and AI citations. theStacc’s Content SEO module ships SEO-scored articles structured for rankings and generative engines — including clearer entity pages models like Grok can quote.
Frequently Asked Questions
Realistically, 12 to 18 months to see the compounding curve. The first six months are foundation work: template architecture, data sourcing, hub page construction, and the first 150 to 200 pages. Compounding starts around month 6 and steepens at month 9. Most programs that get killed are killed at month 4 or 5, right before the slope changes. The teams that survive the flat stretch are the teams that hit the inflection point.
Yes, if the pages contain genuine unique value. The policy targets pages with no original value to humans. Our case study portfolio survived two major Google updates because every page contained at least 3 unique data points, had real use cases, and lived within a dense internal link structure. The pages that get penalized are templated shells with no data, no use cases, and no internal links. Build pages that answer questions humans would actually ask, and the policy does not apply to you.
We require 900 words minimum at the template level, but most of our pages land between 1,100 and 2,200 words depending on how much unique data the template surfaces. Word count is a weak signal on its own. Unique data points, use case depth, and internal links are stronger signals. If a page has 1,500 words but no unique data, it will not rank. If a page has 900 words and 5 unique data points, it can rank.
Yes, but the system around the AI matters more than the AI itself. We use AI for drafting, brief expansion, and SEO formatting. Every page touches AI. None ship without human editing, fact-checking, and quality review. Pure AI-generated pages with no editorial layer perform 34% worse in rankings according to industry data. AI-assisted pages with proper governance perform 12% better than fully human-written content, per Search Engine Journal's enterprise scaling analysis. The discipline is in the workflow, not the model.
100 to 200 pages in the first six months. Less than 100 is too small to see compounding effects. More than 200 strains the indexing budget and the editorial layer. We recommend 25 to 30 pages per week for the first three months, then evaluate template performance before adding more template families or scaling further. The 512-page portfolio in this case study took 18 months to build at this cadence.
Last-click attribution as the conservative floor. Multi-touch attribution as a more accurate but harder-to-defend ceiling. In our case study, last-click showed $574k in attributed revenue. First-touch attribution showed $912k. The truth is somewhere in between. We use last-click in client reporting because it is the easiest number to defend in a board meeting. Internally, we track first-touch and assisted conversions to understand the full picture.
Only if they have a clear keyword cluster that fits a programmatic pattern and a budget that can sustain 12 to 18 months of work before compounding kicks in. Most small businesses are better served by 4 to 8 high-quality traditional blog posts per month, paired with strong local SEO. Programmatic SEO is a scale tool. It is not a starting point. We cover the alternative for smaller teams in our long-tail keywords guide, which works well for sites under 50 pages.
What This Case Study Means for Your Program
The 512-page programmatic SEO case study in this article is one data point. Your numbers will differ. Your timeline will differ. The patterns will not.
Indexing rates above 85% require phased launches and dense internal linking. Compounding curves bend at month 6 and steepen at month 9. The top 10% of pages will produce most of your revenue. The bottom 30% will produce almost none. Refresh sprints are not optional. Revenue tracks intent, not traffic volume.
You can build this system yourself, or you can have us build it for you. Either way, the numbers in this case study are reproducible if you respect the discipline.
Related Tools & Resources
Free SEO Tools:
Best Lists:
Sources & references
- [1] Princeton / Georgia Tech et al. — GEO research (arXiv:2311.09735)
- [2] @jakezward on X — 2026 SEO predictions emphasize AI Overview share-of-SERP, schema for LLM token efficiency, brand mentions in AI answers
- [3] @e_tartakovsky on X — When an AI summary appears, organic CTR can fall (cited ~8% vs ~15% traditional), but remaining clicks may convert highe
- [4] @hridoyreh on X — Widely shared SEO skill tree: foundations, research, technical, on-page, content, links, AI SEO/GEO, analytics, UX, bran
- [5] Referenced source — jetoctopus.com

Researched, written, and published articles that compound organic traffic.
Weekly local SEO teardowns
One practical email a week. Map Pack, GBP, AI Overviews — no fluff. Unsubscribe anytime.