50+ Google search statistics for 2026: daily search volume, market share, CTR by position, mobile vs desktop, voice search growth, and AI Overview impact.
Last updated: March 2026
Google handles roughly 16.4 billion searches a day and still holds the large majority of global search market share. The 50-plus statistics below cover search volume, market share, click-through rate by position, mobile against desktop, voice and visual search, AI Overviews, local search, and search revenue.
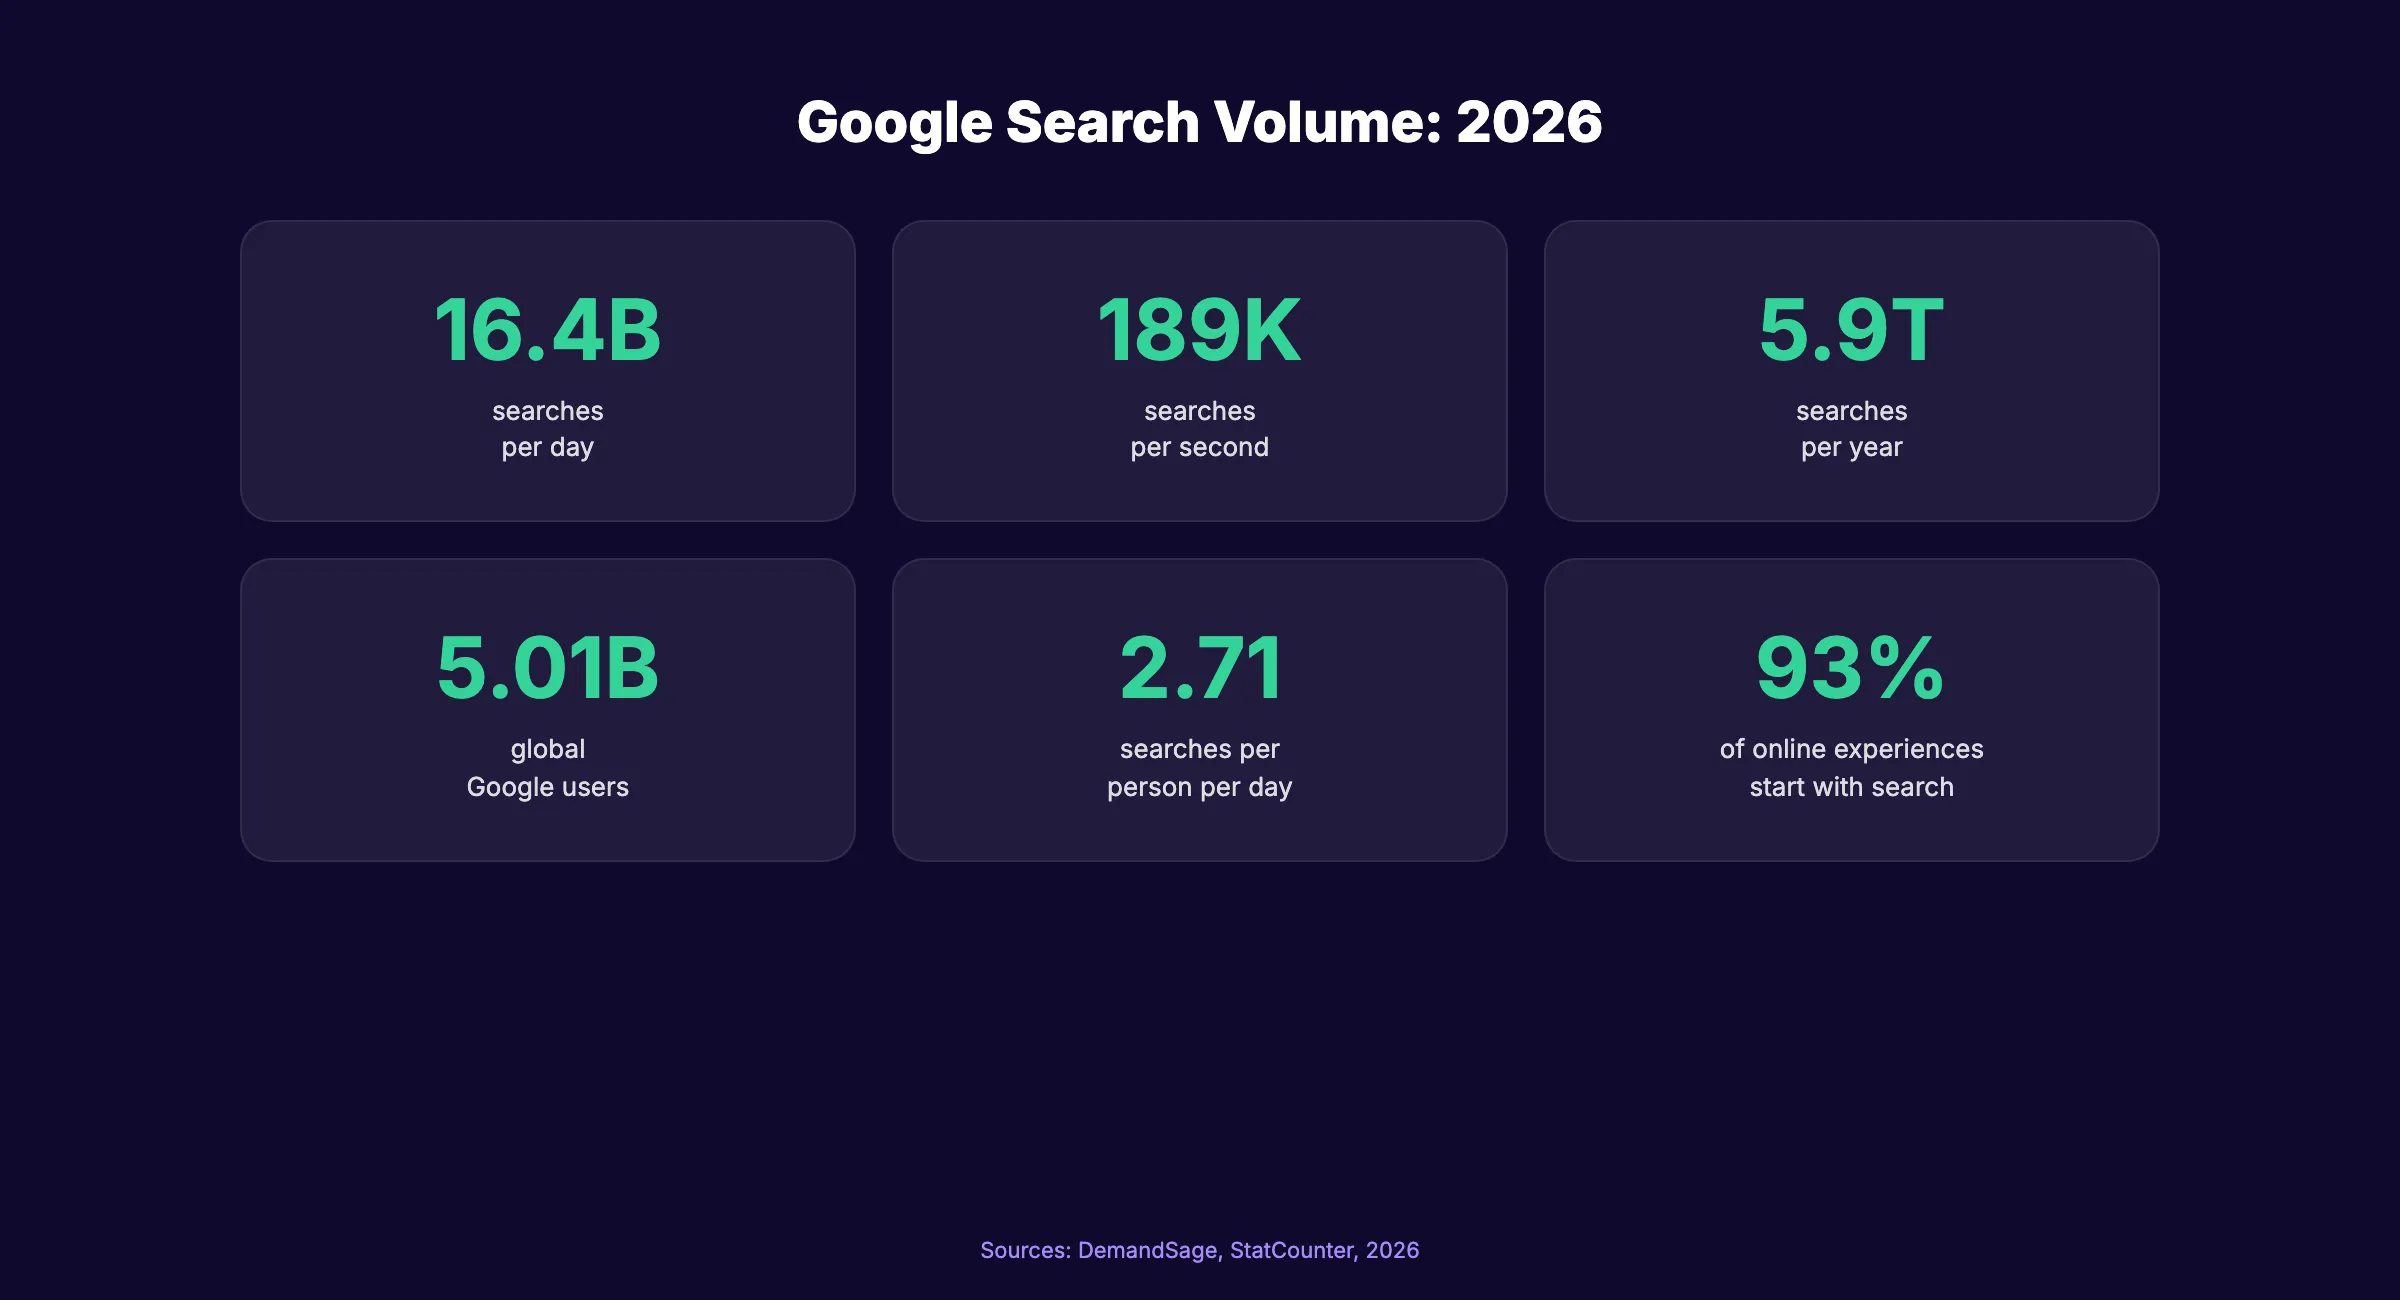
Google processes 16.4 billion searches every day. That is 189,815 searches per second, 5.9 trillion per year. Every one of those searches represents a person looking for an answer, product, or service.
Google search statistics shape every SEO decision your business makes. How many people search, where they search from, what they click, and how AI is changing the results all determine where your marketing dollars produce the best return.
We compiled 50+ Google search statistics from sources including Google, StatCounter, First Page Sage, DemandSage, and Backlinko. Every stat is sourced and dated.
Here are the categories covered:
- General Google search volume
- Market share by device and region
- Mobile search statistics
- Voice and visual search data
- Click-through rate by position
- AI Overviews and AI search impact
- Local search statistics
General Google Search Statistics
1. Google processes 16.4 billion searches per day. (Source: DemandSage, 2026) That translates to approximately 189,815 searches per second or 11.4 million per minute.
2. Google handles 5.9 trillion searches per year. (Source: DemandSage, 2026) Annual search volume continues to grow despite the rise of AI chat interfaces.
3. 5.01 billion people use Google globally. (Source: DemandSage, 2026) That represents 83% of the global internet population of 6.04 billion users.
4. The average person performs 2.71 Google searches per day. (Source: DemandSage, 2026) In the U.S., this number is higher at 4.2 searches per person per day.
5. 93% of online experiences begin with a search engine. (Source: DemandSage, 2026) Google captures the vast majority of those initial search interactions.
6. 75% of users never scroll past the first page of results. (Source: DemandSage, 2026) If your page does not rank on page 1, 3 out of 4 searchers will never see it.
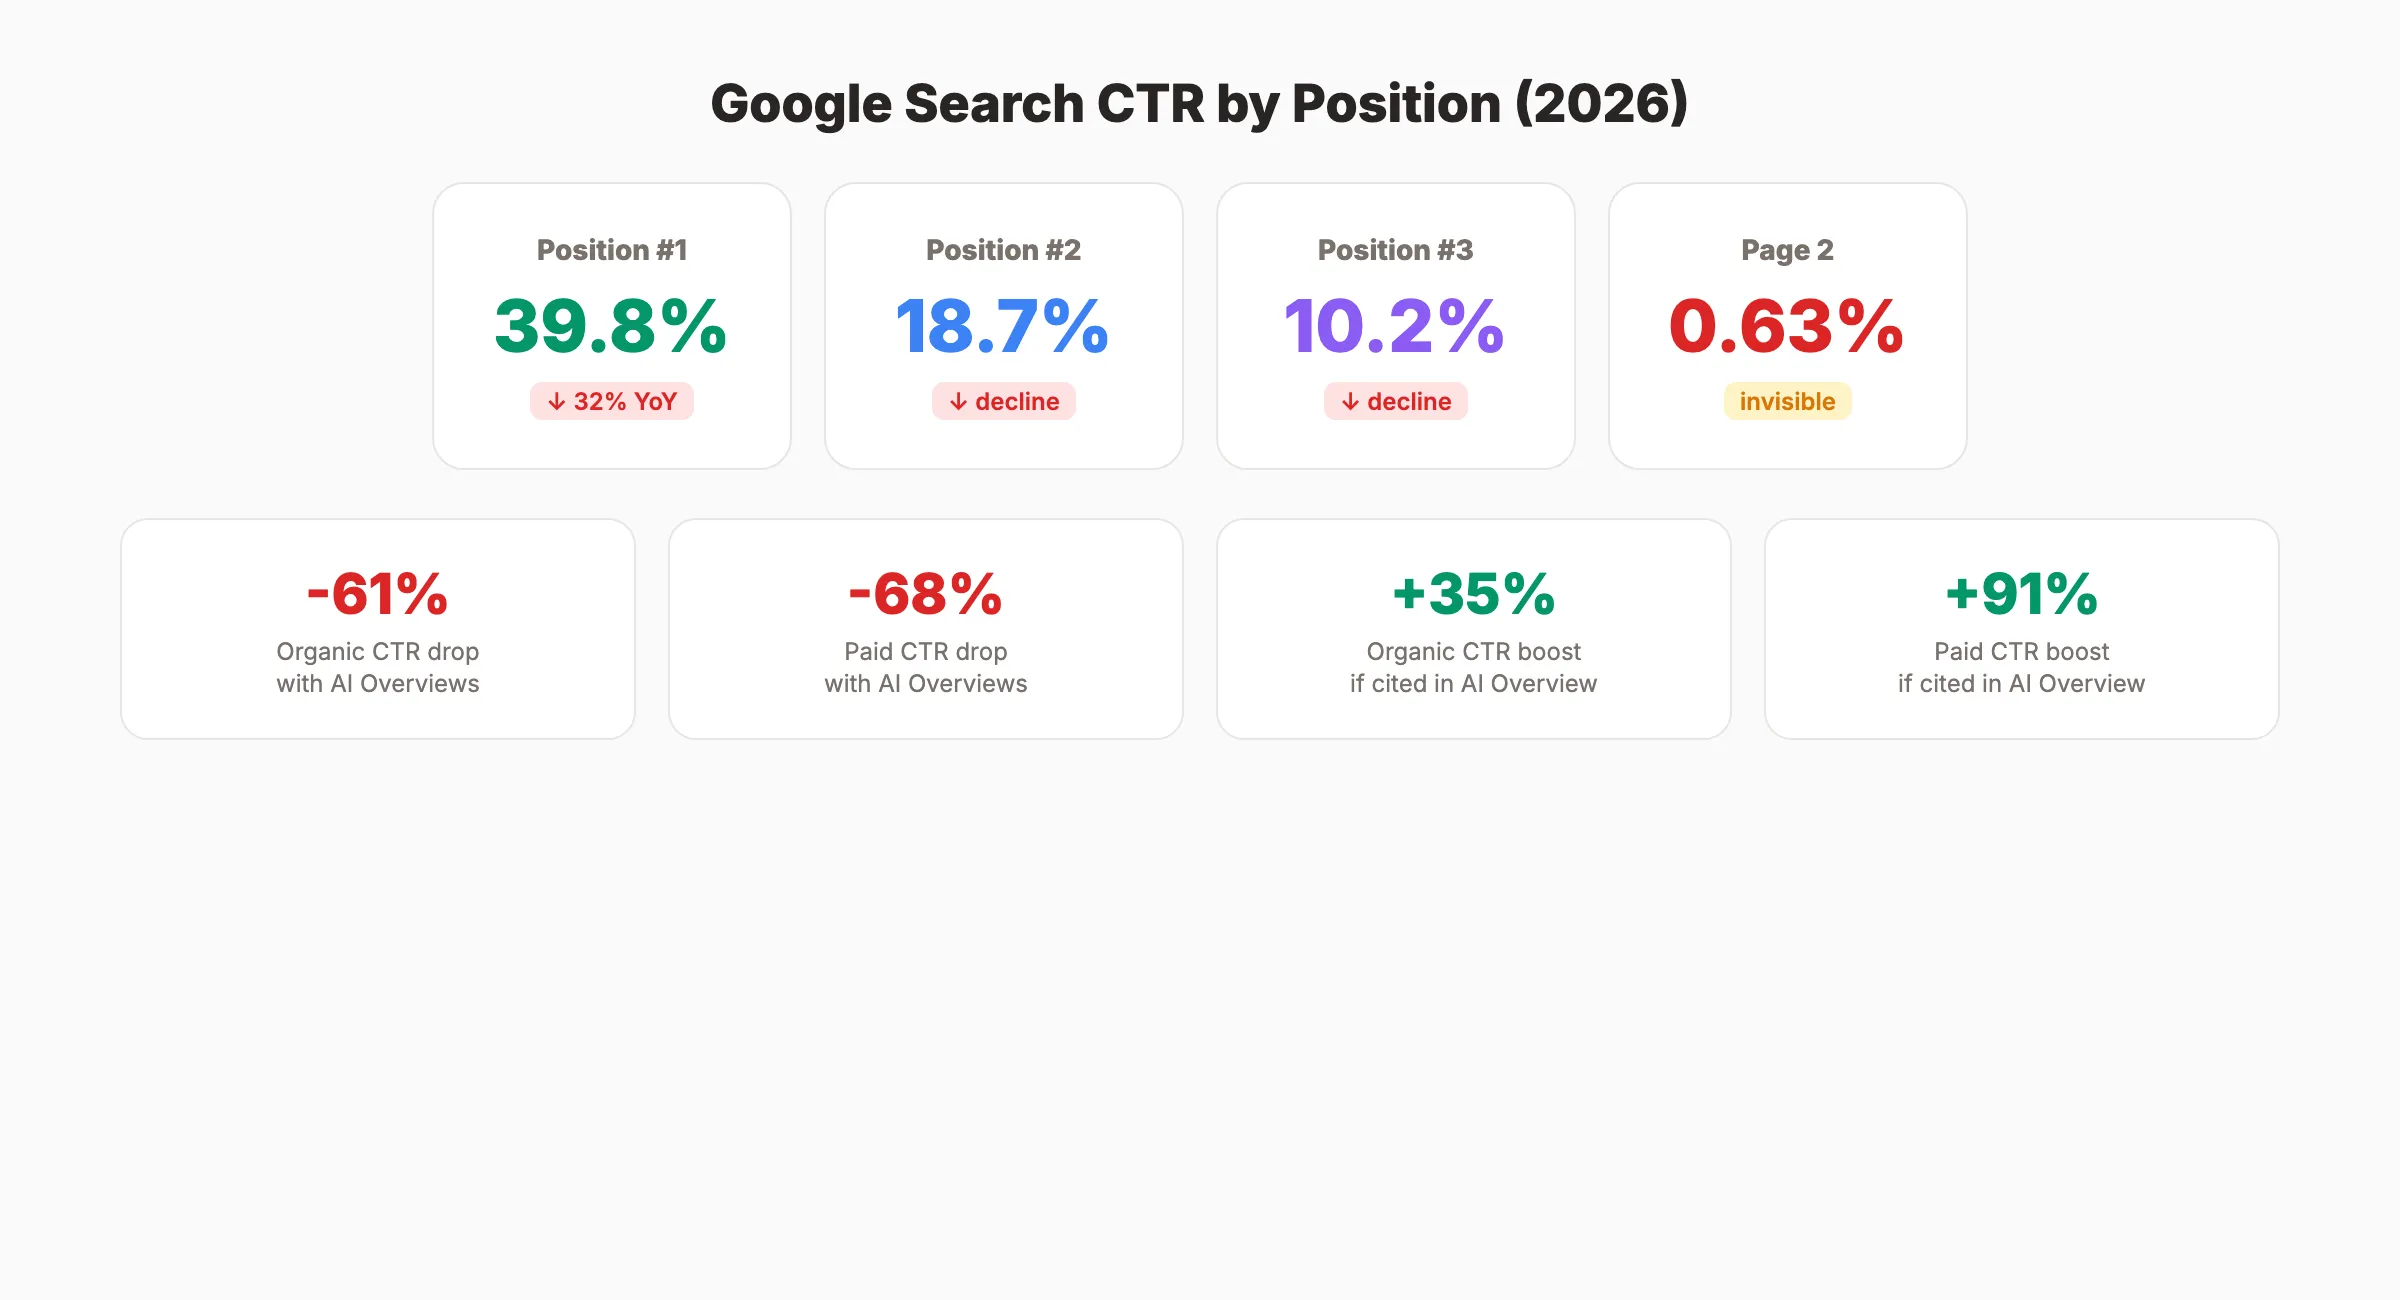
7. Only 0.63% of users click on a result from the second page. (Source: DemandSage, 2026) Page 2 visibility is functionally invisible for driving organic traffic.
8. "ChatGPT" was the most searched term on Google in 2025 with 768.3 million monthly searches. (Source: DemandSage, 2025) AI-related queries dominated the top search terms globally.
Stop writing. Start ranking. theStacc publishes 30 SEO articles per month for your business, automatically.
Google Market Share Statistics
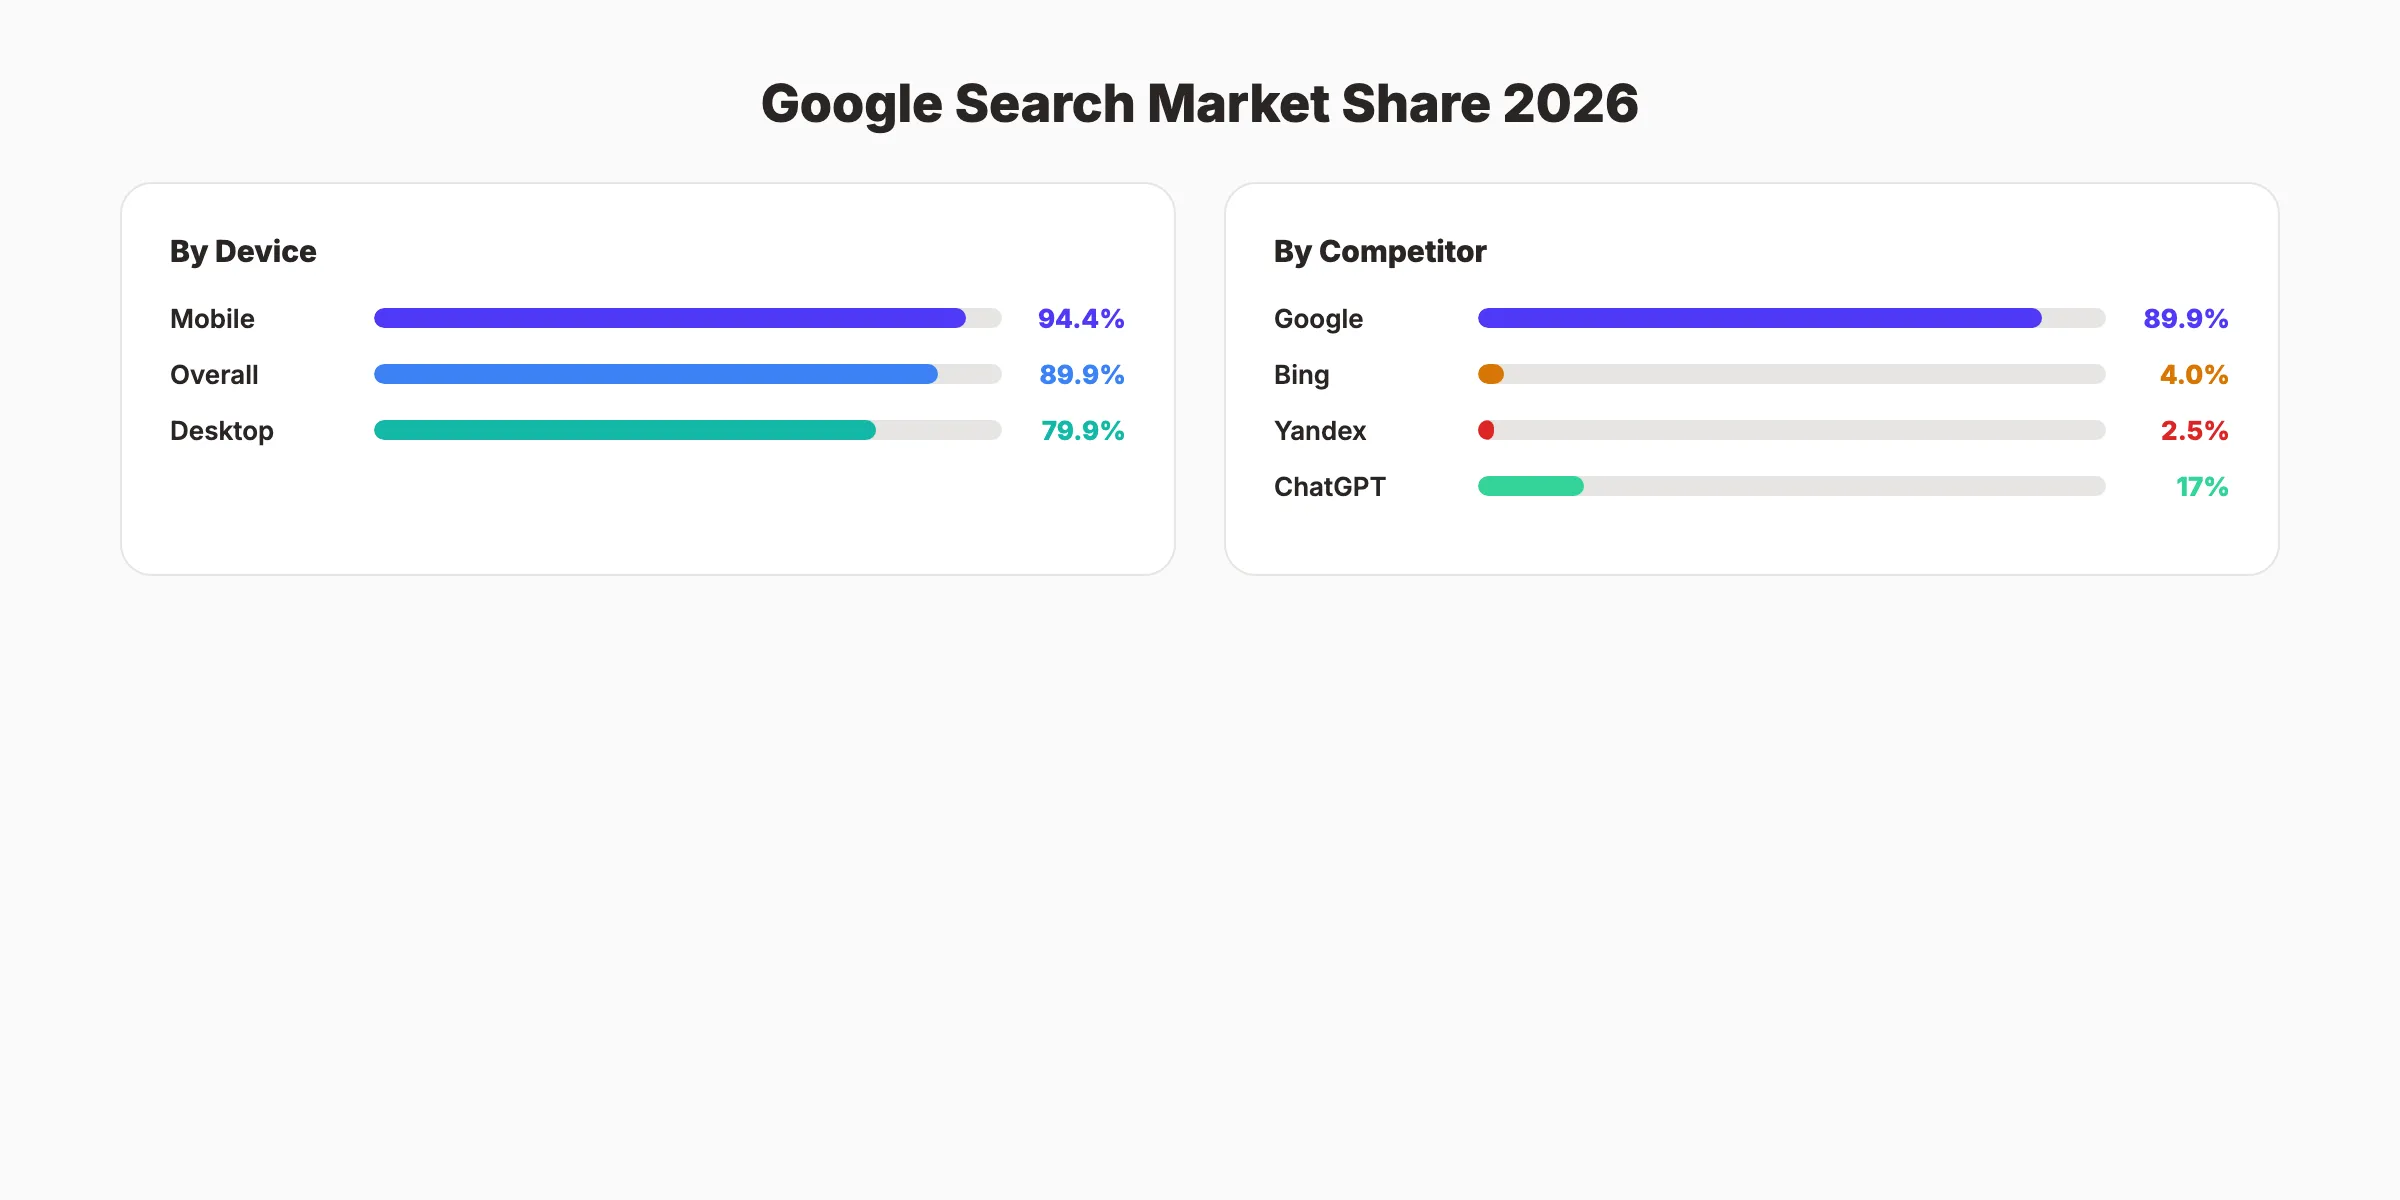
9. Google holds 89.94% of the global search engine market. (Source: StatCounter, 2026) This is down 2.07 percentage points from the prior year. The largest annual drop in a decade.
10. Bing holds 4.01% of the global search market. (Source: StatCounter, 2026) Bing is the second-largest search engine globally.
11. Yandex holds 2.51% of the global search market. (Source: StatCounter, 2026) Yandex dominates in Russia but has minimal presence elsewhere.
12. ChatGPT commands 17% of search queries globally. (Source: First Page Sage, 2026) ChatGPT represents the greatest competitive threat Google has faced in over 20 years.
13. Google holds 97% market share in Africa and 95% in South America. (Source: StatCounter, 2026) Regional saturation varies dramatically. Nigeria reaches 98.69%.
14. Google holds 79.88% of the desktop search market. (Source: StatCounter, 2025) Desktop is where Google faces the most competition from Bing and AI alternatives.
15. Google holds 94.35% of the mobile search market. (Source: DemandSage, 2026) Mobile remains Google's strongest position due to Android integration.
Mobile Search Statistics
16. 60% of all Google searches come from mobile devices. (Source: DemandSage, 2026) Mobile surpassed desktop for Google searches several years ago and continues to grow.
17. 63% of Google organic search traffic in the U.S. comes from mobile. (Source: DemandSage, 2026) For mobile SEO, optimizing for mobile users is not optional.
18. Mobile search volume on Google has doubled compared to 5 years ago. (Source: DemandSage, 2026) The growth curve shows no signs of slowing.
19. 3 in 5 people use their mobile devices to conduct Google searches. (Source: DemandSage, 2026) The majority of your potential customers find businesses through their phones.
20. Google holds 94.35% of the mobile search engine market. (Source: DemandSage, 2026) On mobile, Google is effectively the only search engine that matters for SEO.
Voice and Visual Search Statistics
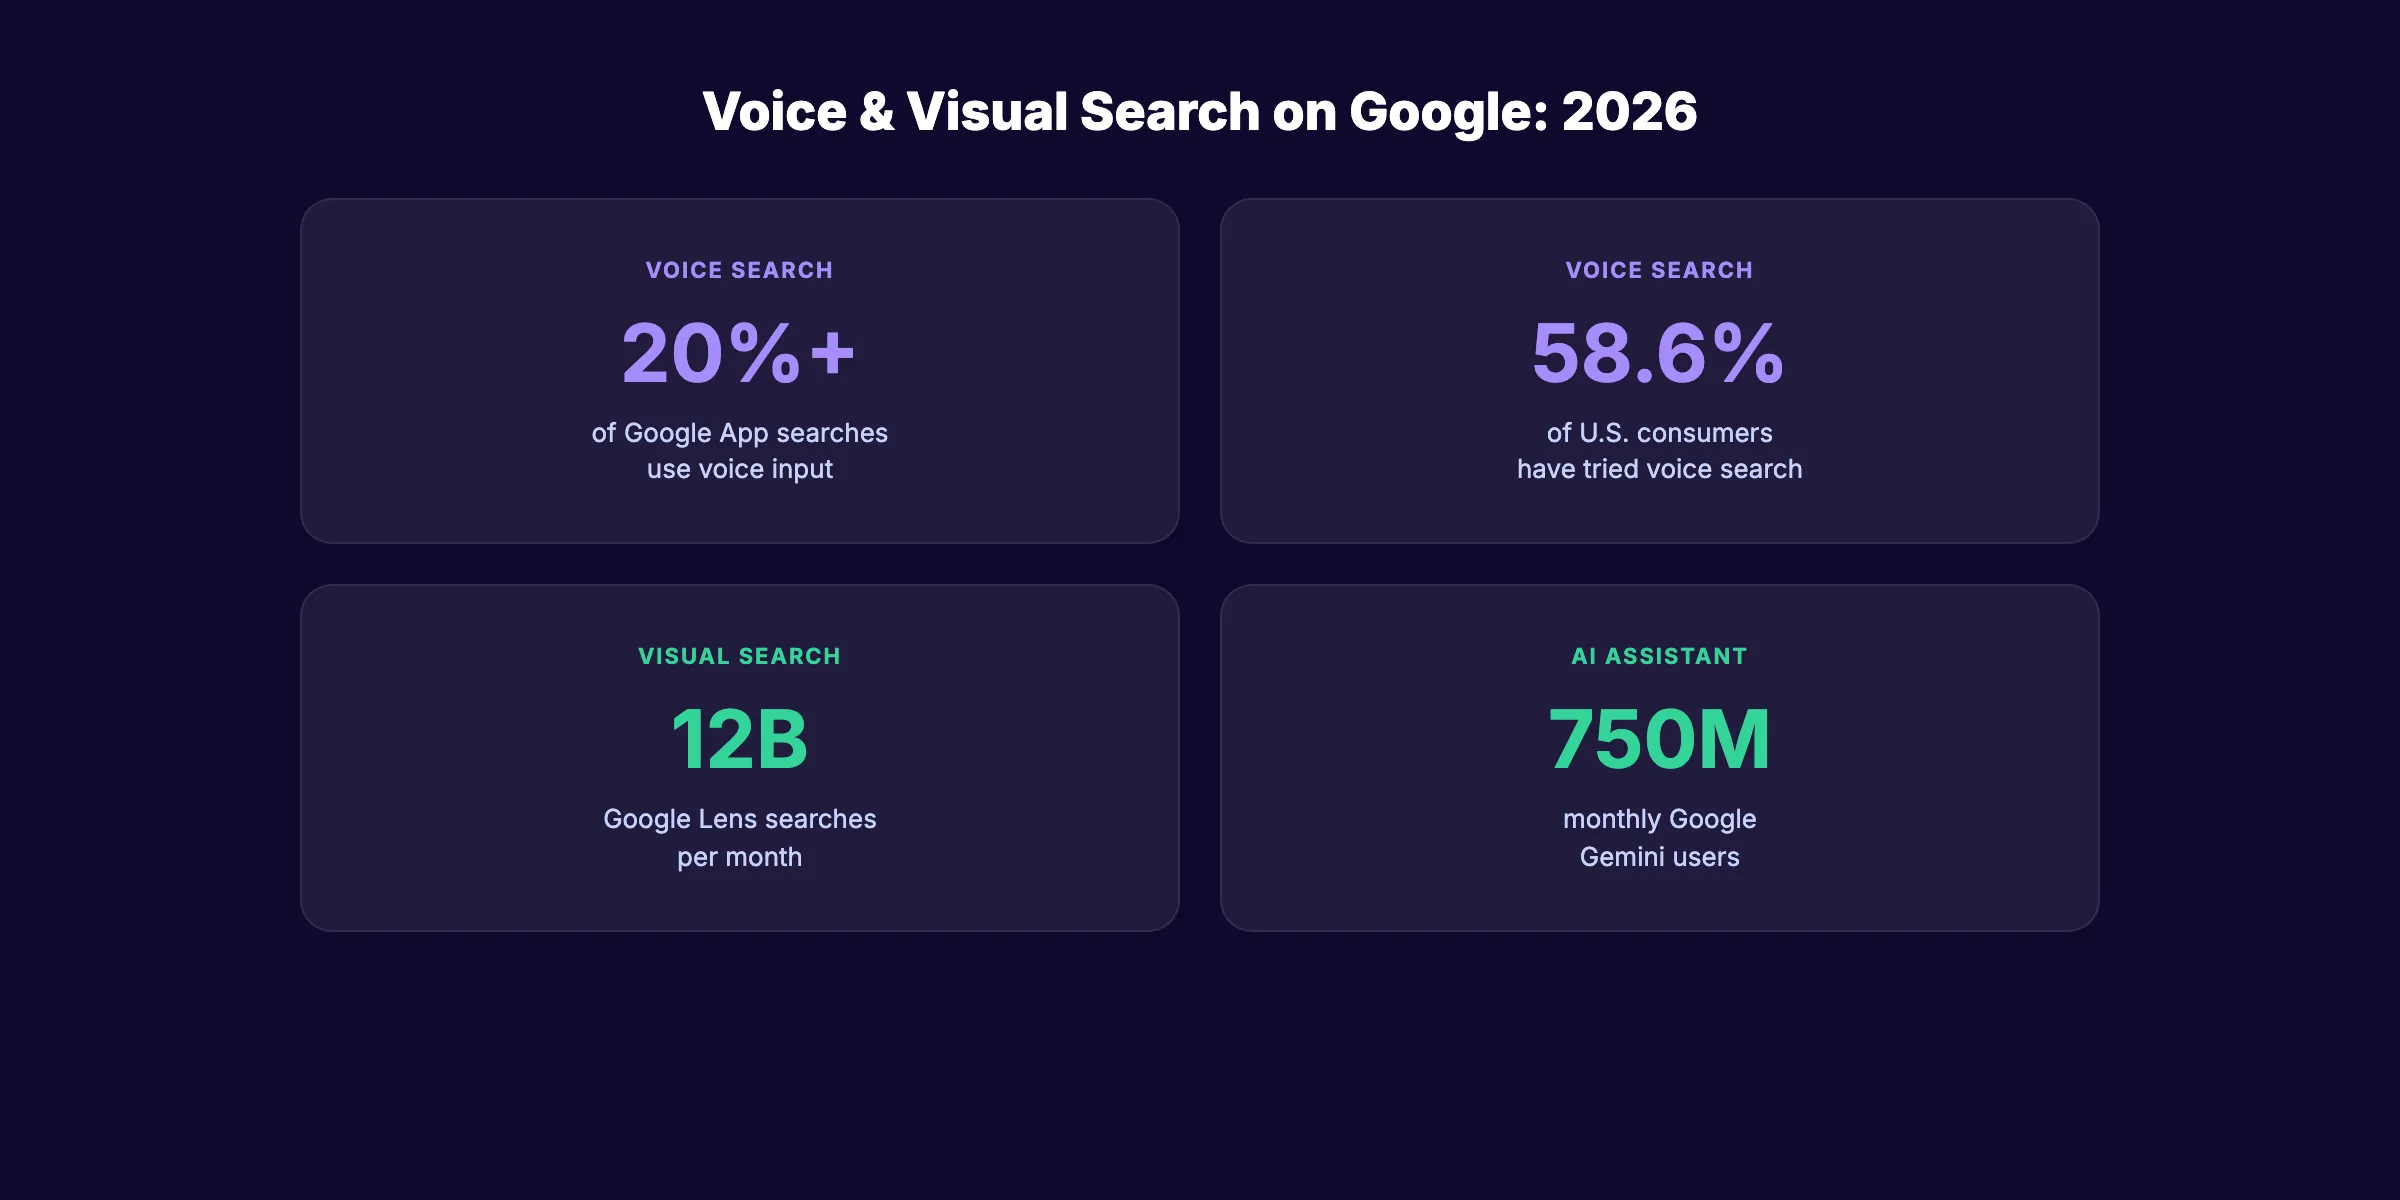
21. More than 20% of searches in the Google App use voice. (Source: DemandSage, 2026) Voice search represents a growing share of total search volume.
22. 27% of people use voice search on their mobile devices. (Source: DemandSage, 2026) Voice search skews heavily toward mobile users.
23. 58.6% of U.S. consumers have tried voice search. (Source: DemandSage, 2026) More than half of U.S. consumers have direct experience with voice-activated search.
24. The 18-to-34 age group uses voice search the most. 77% use voice search on smartphones. (Source: DemandSage, 2026) Younger demographics are driving voice search adoption.
25. Google Lens processes 12 billion visual searches per month. (Source: DemandSage, 2026) That is 3,086 visual searches per second. Visual search is growing faster than text-based search.
26. 32.5% of Google Lens results have a matching keyword in the page title tag. (Source: DemandSage, 2026) On-page SEO fundamentals still apply to visual search results.
27. 750 million people use Google Gemini every month. (Source: DemandSage, 2026) Gemini usage shows strong adoption of Google AI features.
Your SEO team. $99 per month. 30 optimized articles, published automatically. No writers. No agencies.
Click-Through Rate Statistics
28. The first organic result on Google receives a 39.8% CTR. (Source: First Page Sage, 2026) Position 1 captures nearly 4 in 10 clicks. No other position comes close.
29. Position 2 receives an 18.7% CTR. Position 3 receives 10.2%. (Source: First Page Sage, 2026) The drop-off from position 1 to 2 is over 50%. From 2 to 3, another 45%.
30. Position 1 organic CTR has dropped 32% year-over-year. (Source: First Page Sage, 2026) AI Overviews and expanded paid results push organic listings further down the page.
31. Organic click share dropped 11 to 23 percentage points year-over-year depending on vertical. (Source: ALM Corp, 2026) The decline in organic clicks is the most significant shift in Google search behavior in years.
32. Paid search text ads gained 7 to 13 percentage points of click share year-over-year. (Source: ALM Corp, 2026) As organic CTR falls, paid search absorbs the difference.
33. Classic organic results captured 50 to 84% of clicks in January 2026, down from 60 to 95% a year earlier. (Source: ALM Corp, 2026) The range varies by industry, but the trend is consistent across all verticals.
34. Brands cited in AI Overviews receive 35% higher organic CTR. (Source: ALM Corp, 2026) Getting cited in AI search results provides a measurable ranking advantage.
For a deeper breakdown of CTR by position, see our organic CTR by position analysis.
AI Search and AI Overviews Statistics
35. AI Overviews appear in 20.5% of all Google searches. (Source: DemandSage, 2025) Roughly 1 in 5 searches now includes an AI-generated summary at the top of results.
36. Organic CTR for queries with AI Overviews fell 61% from mid-2024 to late 2025. (Source: Search Engine Land, 2025) Organic CTR dropped from 1.76% to 0.61% for informational queries with AI Overviews.
37. Paid CTR for queries with AI Overviews fell 68% in the same period. (Source: Search Engine Land, 2025) Paid CTR dropped from 19.70% to 6.34%. AI Overviews reduce both organic and paid traffic.
38. Brands cited within AI Overviews receive 91% higher paid CTR than non-cited competitors. (Source: ALM Corp, 2026) Getting cited in AI Overviews is becoming a critical ranking factor.
39. ChatGPT web search processes approximately 17% of all search queries globally. (Source: First Page Sage, 2026) AI-native search is growing. Optimizing for AI search is no longer optional.
40. Google AI Overviews are most common for informational and research-intent queries. (Source: Search Engine Land, 2025) Commercial and transactional queries see fewer AI Overviews. Product and local searches remain largely traditional.
Local Search Statistics
41. 46% of all Google searches have local intent. (Source: DemandSage, 2026) Nearly half of all Google searches are looking for something nearby. Local SEO captures this demand.
42. Google processes 97 billion local searches per month. (Source: DemandSage, 2026) That is 3.19 billion local searches per day.
43. 78% of local mobile searches on Google result in an offline purchase. (Source: DemandSage, 2026) Local search has the highest purchase intent of any search category.
44. 46% of product searches begin on Google. (Source: DemandSage, 2026) Google remains the starting point for nearly half of all product research.
45. "Near me" searches have grown over 150% in the past 3 years. (Source: Google, 2025) Hyper-local search terms continue to surge. Google Maps SEO captures this traffic.
46. Businesses with complete Google Business Profiles receive 7x more clicks. (Source: Google, 2025) A fully optimized Google Business Profile is one of the highest-ROI local marketing activities.
For more local search data, see our full local SEO statistics page.
3,500+ blogs published. Every article is SEO-scored before publish. See what theStacc can do for your site.
Google Search Revenue and Business Statistics
47. Google Search generated $198.1 billion in ad revenue in 2024. (Source: Alphabet Q4 2024 Earnings, 2025) Search advertising remains Google's primary revenue driver.
48. Google Ads average CPC across all industries is $2.69. (Source: First Page Sage, 2026) Cost per click varies dramatically by industry. Legal and insurance exceed $6 per click.
49. Google controls 28.6% of all global digital advertising revenue. (Source: Statista, 2025) Google captures more ad dollars than any other single platform.
50. Alphabet (Google parent company) reported $350.8 billion in total revenue for 2024. (Source: Alphabet Earnings Report, 2025) Search ads account for more than 56% of total Alphabet revenue.
Key Takeaways
- 16.4 billion searches per day make Google the starting point for almost every online journey
- 89.94% market share but dropping. The 2.07-point decline is the largest in a decade.
- 60% of searches are mobile. Mobile optimization is not optional for any business.
- 39.8% CTR for position 1 but falling 32% year-over-year due to AI Overviews
- 20.5% of searches show AI Overviews. These reduce organic CTR by 61% on affected queries.
- 46% of searches have local intent. Nearly half of all Google searches seek a local result.
- 78% of local mobile searches lead to an offline purchase. Local search drives real-world revenue.
Methodology
Sources: DemandSage, StatCounter, First Page Sage, ALM Corp, Search Engine Land, Google/Alphabet Earnings Reports, Statista, Backlinko
Last updated: March 2026
We update this page quarterly to ensure all statistics remain current. Each stat includes the original source and year. If a stat has changed since original publication, we note the updated date.
What practitioners are saying on X
Systems and fundamentals still move numbers; AI search adds measurement layers.
- @jakezward (Feb 2026): 2026 SEO predictions emphasize AI Overview share-of-SERP, schema for LLM token efficiency, brand mentions in AI answers as a KPI, proprietary data as a moat, and content refresh beating net-new AI slop. See the post on X.
- @hridoyreh (Mar 2026): Widely shared SEO skill tree: foundations, research, technical, on-page, content, links, AI SEO/GEO, analytics, UX, brand, programmatic — useful map for stats and how-to posts. See the post on X.
- @HlynurStefDev (Jul 2026): Public case: niche site traffic jumped from ~18 to 4,162 Google visits/month after focused technical/on-page SEO work (GSC screenshots claimed) — reminds that fundamentals still move numbers. See the post on X.
Grok, AI Overviews, and multi-engine visibility
Statistics pages on “google search statistics” earn AI citations when every major number has a year, source, and definition. Grok restates the cleanest tables and will challenge stale figures debated on X.
- Google AI Overviews: Use passage-ready answers, tables, and FAQ schema where relevant.
- ChatGPT / Perplexity: Cite named sources next to key claims.
- Grok: Maintain accurate entity facts on-site and in high-signal X posts.
Publish content built for Google and AI citations. theStacc’s Content SEO module ships SEO-scored articles structured for rankings and generative engines — including clearer entity pages models like Grok can quote.
FAQ
The 61% drop in organic CTR for queries with AI Overviews is the most significant data point for SEO professionals. It signals a fundamental shift in how Google distributes clicks. Businesses that optimize for AI visibility will capture traffic that others lose.
Google processes approximately 16.4 billion searches per day as of 2026. That equals 189,815 searches per second or 5.9 trillion searches per year. The number continues to grow despite competition from AI search tools.
60% of all Google searches come from mobile devices. In the U.S., 63% of organic search traffic originates from mobile. Google holds 94.35% of the mobile search engine market.
We update this page quarterly. Last updated: March 2026. All statistics include their original source and year of publication. Subscribe to our blog for notifications when new data is available.
Focus on the trends that affect your business. If 46% of searches are local, invest in local SEO. If position 1 CTR is falling, diversify into AI search optimization. If 60% of searches are mobile, ensure your site passes Google Search Console mobile usability checks.
Google search remains the foundation of digital marketing in 2026. The numbers are shifting toward AI and mobile, but the core principle holds: businesses that show up in search results get the customers. The data tells you exactly where to invest.
Related Statistics
- Google AI Overviews in 2026: 48% of Searches Have Them (40+ Stats)
- Google Reviews Statistics 2026: 97% Read Them Before Buying (47 Stats)
- Mobile Search Statistics 2026: 63.8% of Traffic Is Mobile (45 Stats)
- Voice Search Statistics 2026: 50%+ of Searches Are Voice (50+ Stats)
- Voice Search Statistics 2026: 55 Facts and Figures
Sources & references
- [1] Princeton / Georgia Tech et al. — GEO research (arXiv:2311.09735)
- [2] @jakezward on X — 2026 SEO predictions emphasize AI Overview share-of-SERP, schema for LLM token efficiency, brand mentions in AI answers
- [3] @e_tartakovsky on X — When an AI summary appears, organic CTR can fall (cited ~8% vs ~15% traditional), but remaining clicks may convert highe
- [4] @hridoyreh on X — Widely shared SEO skill tree: foundations, research, technical, on-page, content, links, AI SEO/GEO, analytics, UX, bran
- [5] Referenced source — www.demandsage.com

Plan topics, review article drafts, and publish to a connected CMS.
Weekly local SEO teardowns
One practical email a week. Map Pack, GBP, AI Overviews — no fluff. Unsubscribe anytime.