Content ROI (2026): Strategies, Tactics & Examples
Step-by-step content roi guide guide for 2026: proven tactics, real examples, common mistakes to avoid, and implementation tips.
Your content budget is under review. Leadership wants numbers. Not impressions. Not page views. Revenue.
Content ROI is the single metric that determines whether your program survives the next budget cycle. Yet only 36% of marketers can accurately measure it, according to the Content Marketing Institute. The other 64% guess, deflect, or report vanity metrics that nobody trusts.
The gap between “content is working” and “here is proof” costs teams their budget, their headcount, and their credibility. We have published 3,500+ blog posts across 70+ industries and tracked the revenue impact of every one. This guide covers everything we know about content ROI. From the basic formula to advanced attribution models.
Here is what you will learn:
- The exact formula for calculating content ROI (with real numbers)
- Which metrics matter at each funnel stage. And which are noise
- How to set up multi-touch attribution in GA4
- Industry benchmarks so you know what “good” looks like
- Why content ROI compounds over time (and paid ads do not)
- How to build a reporting dashboard your CFO will trust
- What to do when content ROI turns negative
What Content ROI Actually Means
Content ROI measures the revenue generated by content relative to the cost of creating and distributing it. Simple concept. Difficult execution.
Most teams confuse activity metrics with outcome metrics. Publishing 30 articles per month is an activity. Generating $47,000 in pipeline from those articles is an outcome. Content ROI only cares about outcomes.
The Difference Between Content ROI and Content Performance
Content performance tells you what happened. Content ROI tells you what it was worth.
| Metric Type | Examples | Answers |
|---|---|---|
| Performance | Page views, time on page, scroll depth | ”Did people engage?” |
| ROI | Revenue attributed, cost per lead, pipeline value | ”Did it make money?” |
Both matter. But when the budget conversation starts, performance metrics lose to ROI metrics every time.
Why Content ROI Is Hard to Measure
Three problems make content ROI harder than paid ad ROI:
1. Long time horizons. A blog post published today might generate its first lead 90 days from now. Paid ads show ROI in hours. Content shows ROI in months.
2. Multi-touch journeys. A buyer reads 3 blog posts, downloads a guide, attends a webinar, and then books a demo. Which piece of content gets credit? All of them. None of them. The answer depends on your attribution model.
3. Dark social. Someone shares your article in a Slack channel or group text. The reader arrives via direct traffic. Your analytics never see the referral. SparkToro research estimates that 70-80% of content sharing happens in private channels that analytics cannot track.
These problems are real. They are not excuses. The sections below show you how to solve each one.
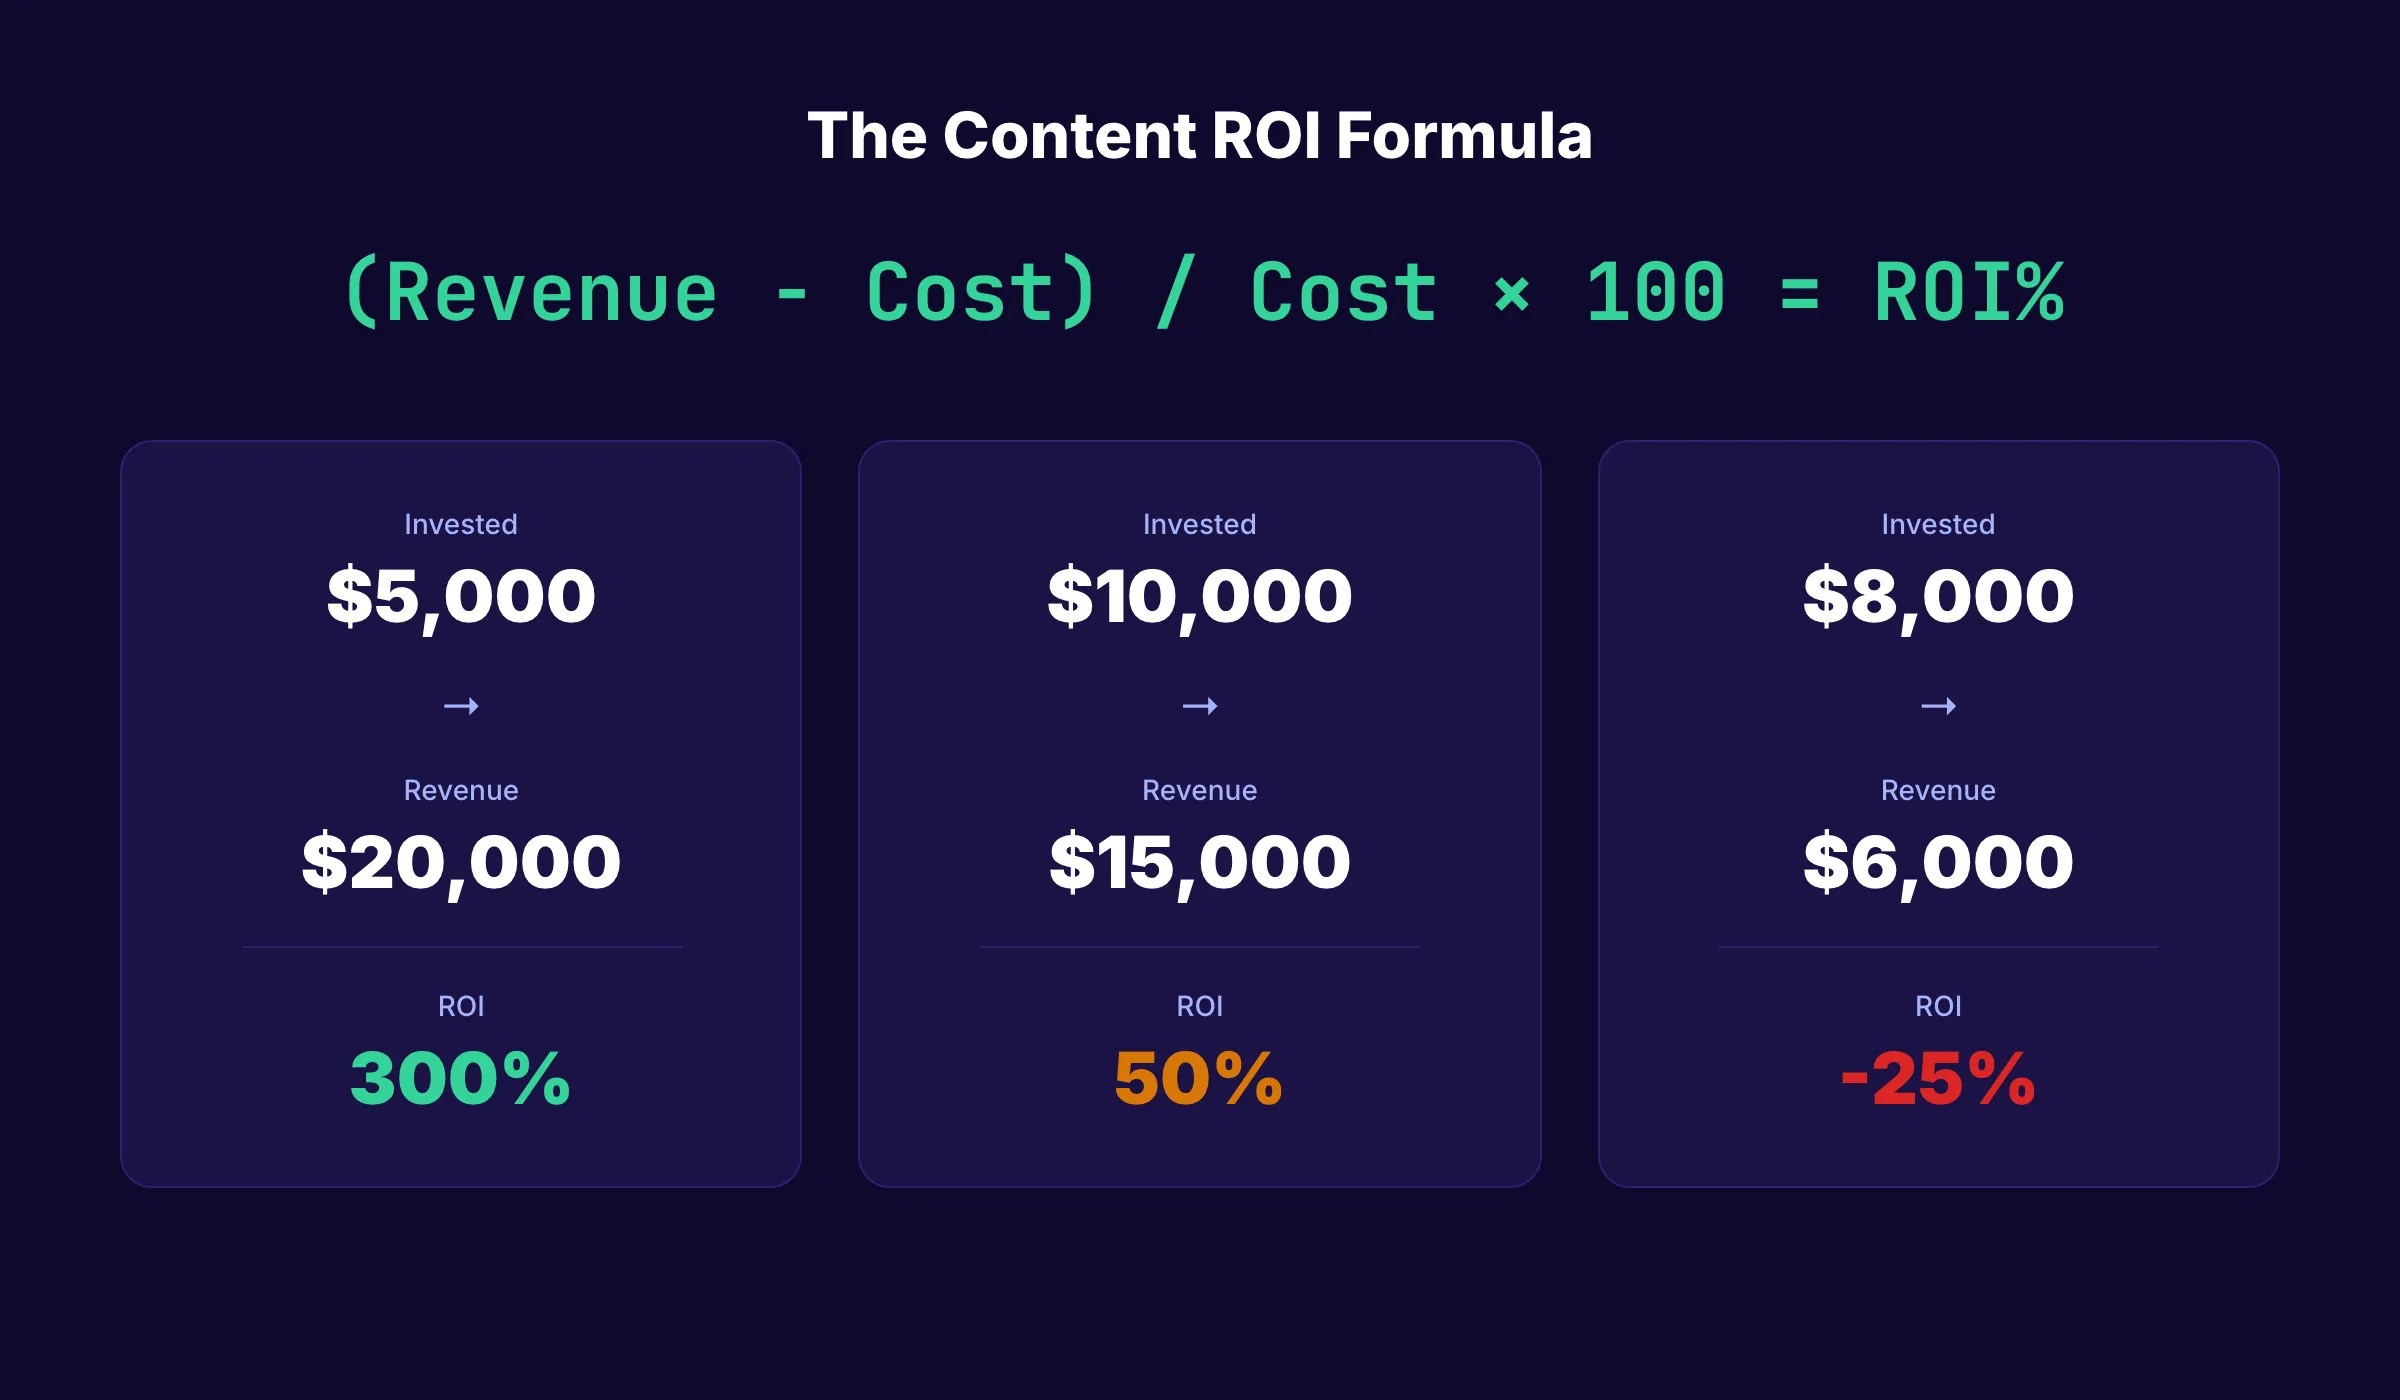
The Content ROI Formula
The core formula is straightforward:
Content ROI = (Revenue from Content - Cost of Content) / Cost of Content × 100
A $5,000 investment that generates $20,000 in revenue yields a 300% ROI. That number is clean, defensible, and universally understood.
How to Calculate Content Cost
Content cost includes every dollar spent producing and distributing content:
| Cost Category | What to Include |
|---|---|
| Production | Writers, editors, designers, tools, AI subscriptions |
| Distribution | Paid promotion, email platform, social scheduling |
| Management | Content strategist salary (prorated), project management time |
| Technical | CMS hosting, SEO tools, analytics platforms |
Most teams undercount costs by 30-40%. They track writer fees but ignore the strategist who spent 8 hours on the content calendar or the designer who created 5 graphics.
How to Calculate Content Revenue
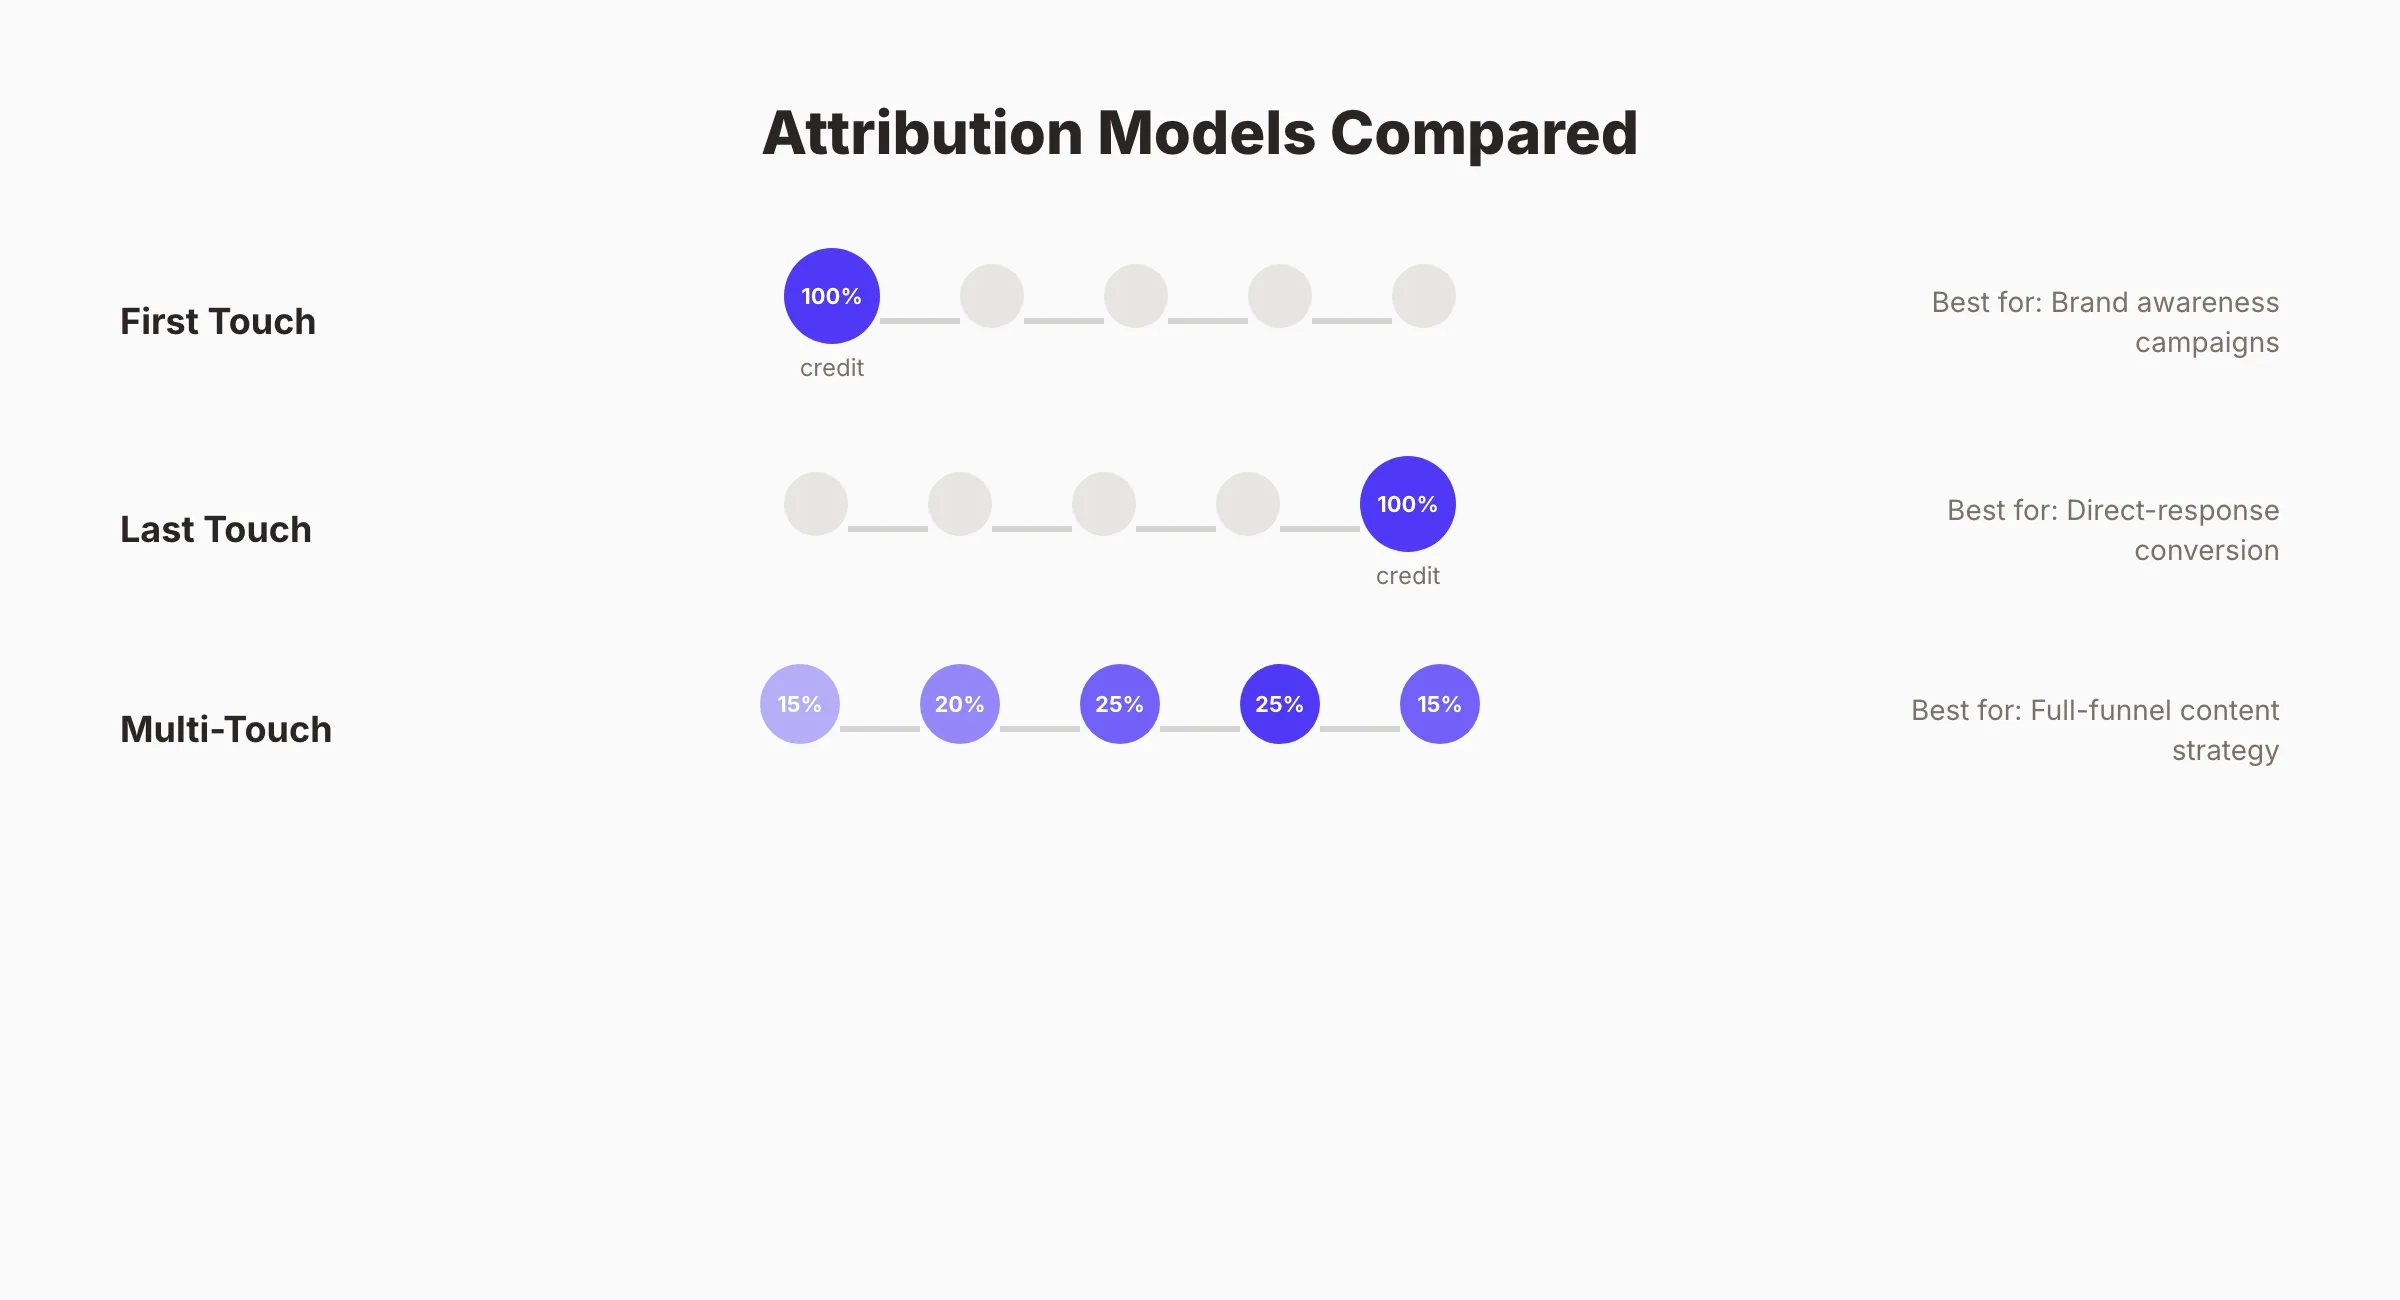
Revenue attribution is where most teams fail. Three models dominate:
First-touch attribution credits the first content piece a buyer interacted with. Best for understanding what drives awareness.
Last-touch attribution credits the final content piece before conversion. Best for understanding what closes deals.
Multi-touch attribution distributes credit across every touchpoint. Best for understanding the full journey. This is the model we recommend.
For a detailed walkthrough of setting up each model, see our guide on how to measure content marketing ROI.
Stop guessing. Start proving. Stacc publishes 30 SEO articles per month and tracks every conversion. See the results for yourself. Start for $1 →
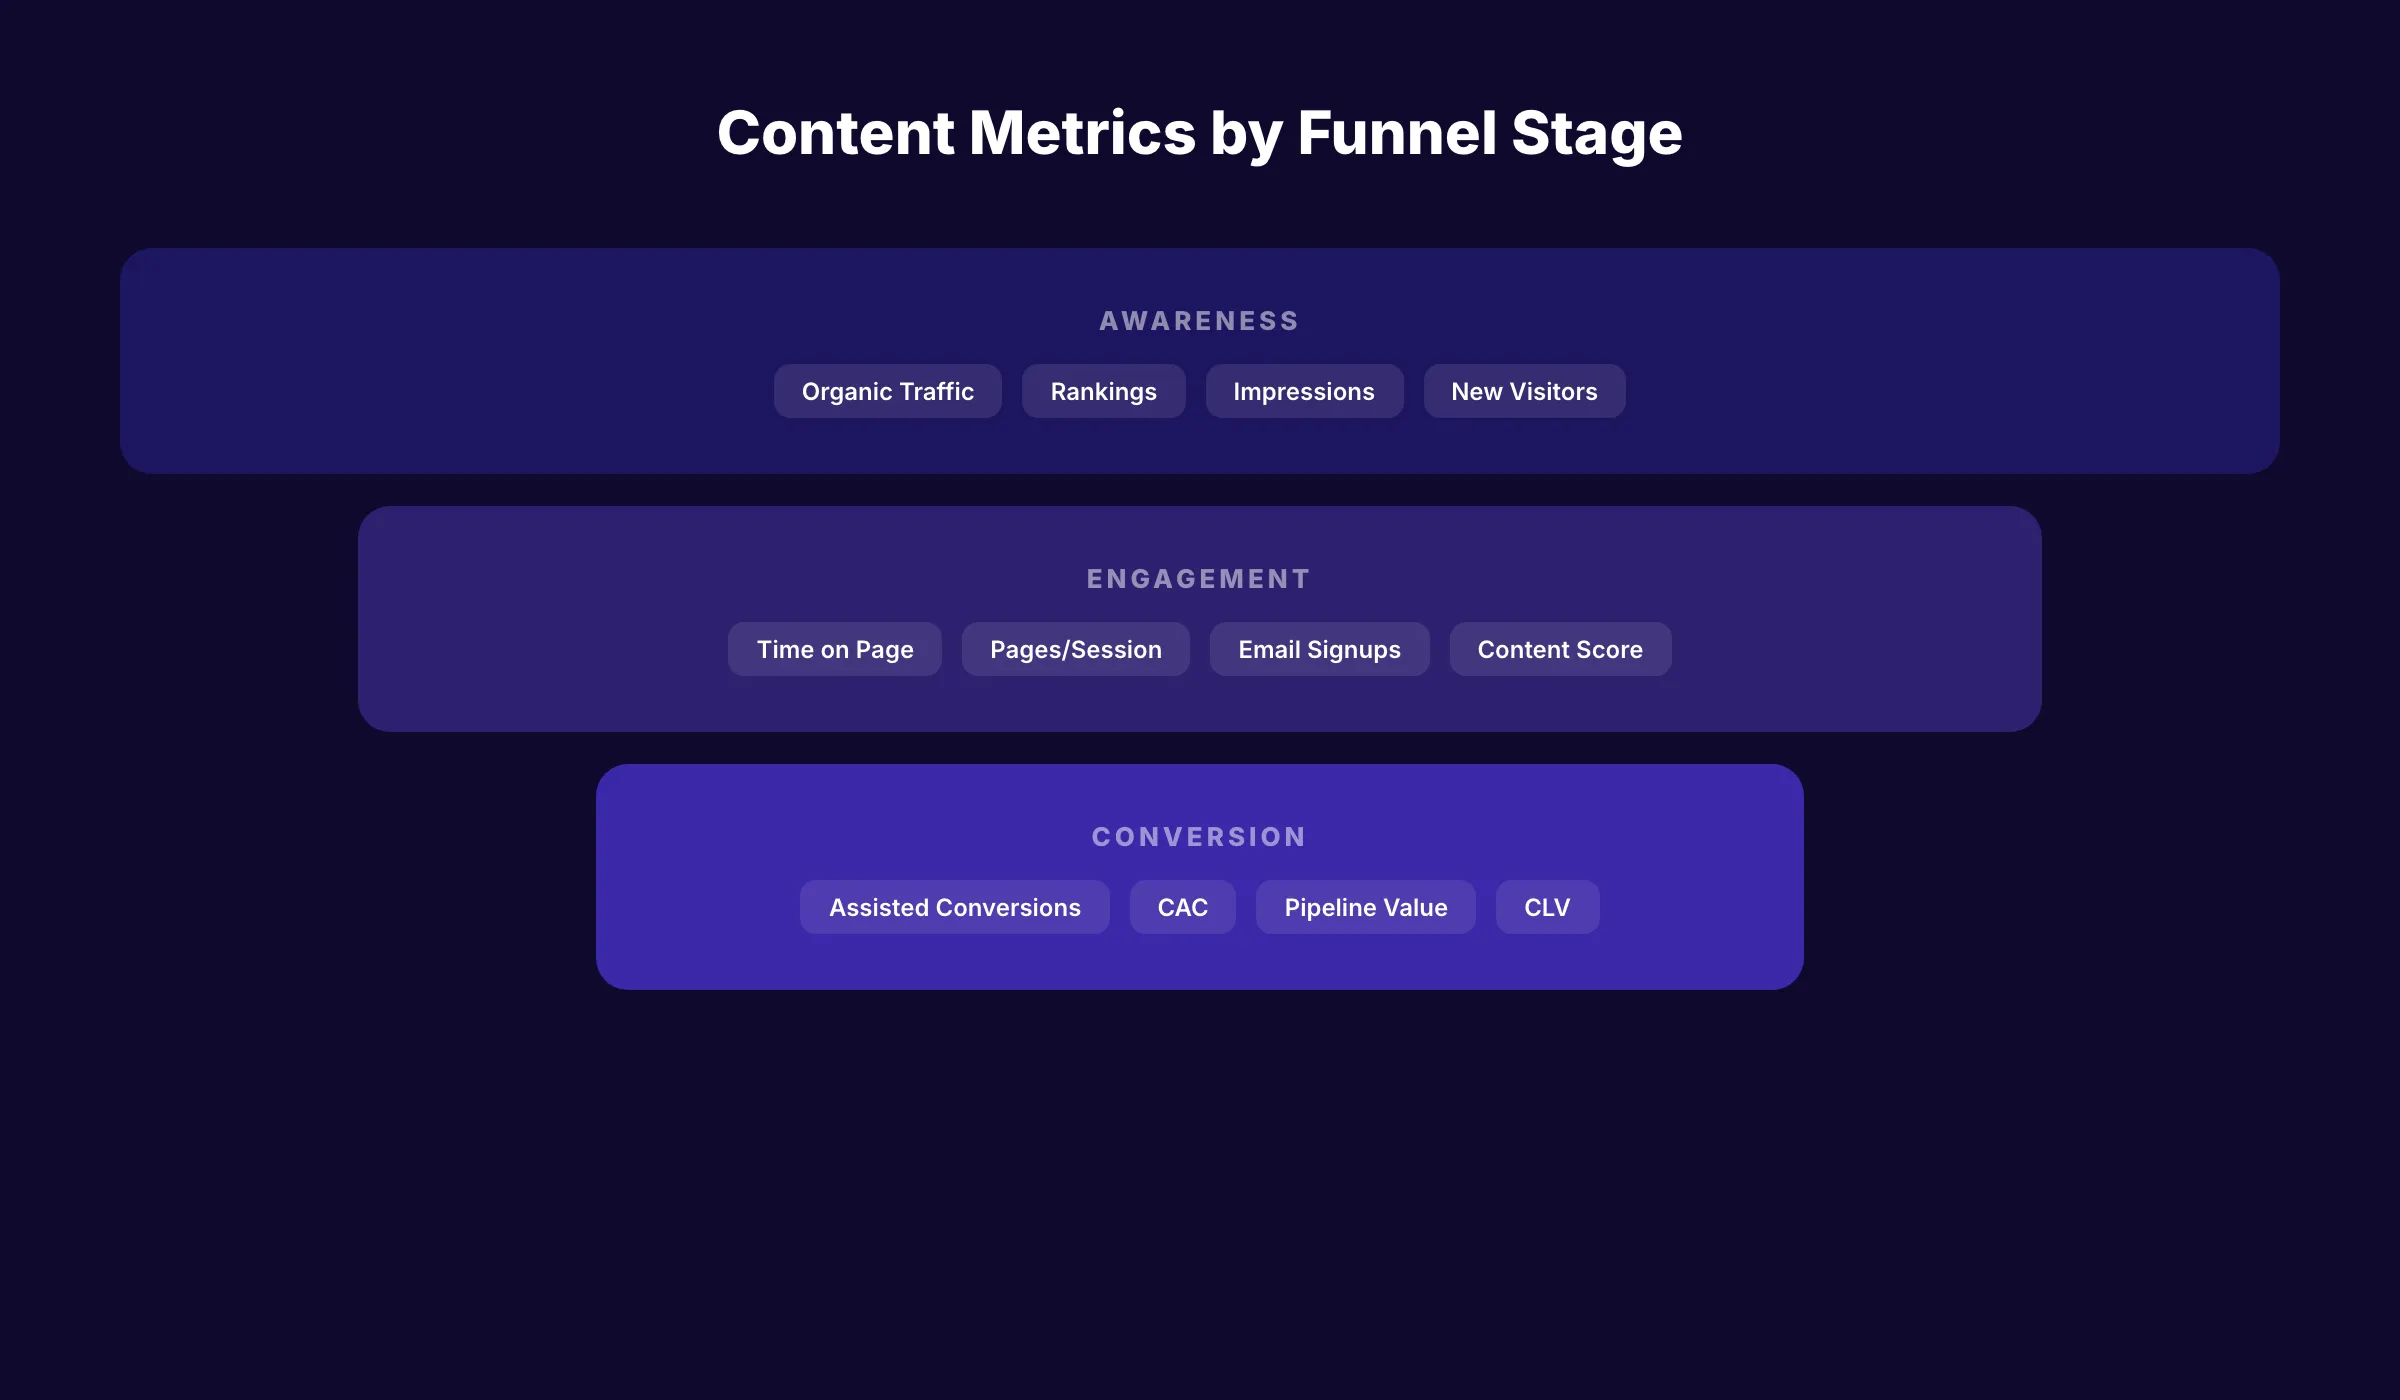
Which Metrics to Track at Every Funnel Stage
Not every metric matters at every stage. Tracking the wrong KPIs at the wrong stage creates noise that obscures real ROI signals.
Top of Funnel: Awareness Metrics
These metrics tell you whether content is reaching the right audience:
- Organic traffic. Total sessions from search. The foundation of content ROI. Track in Google Search Console.
- Keyword rankings. Positions for target keywords. Leading indicator of future traffic.
- Impressions. Search visibility before the click. Useful for trend analysis.
- New vs. returning visitors. High new visitor percentage means content is attracting fresh audience.
Do not optimize for awareness metrics alone. A post with 50,000 page views and zero conversions has zero ROI.
Middle of Funnel: Engagement Metrics
These metrics tell you whether content is moving readers toward action:
- Time on page. Longer engagement signals content relevance.
- Pages per session. Multiple page views indicate deeper interest.
- Email signups. First-party data capture from content readers.
- Content scoring. Assign weighted scores to engagement actions. Our content scoring guide covers the setup.
Bottom of Funnel: Conversion Metrics
These metrics tie directly to revenue:
- Content-assisted conversions. Pages in the conversion path before a sale.
- Customer acquisition cost. Total content spend divided by customers acquired through content.
- Pipeline value. Dollar value of deals influenced by content.
- Customer lifetime value from content leads. Do content-sourced customers retain longer?
The answer to that last question is almost always yes. Demand Metric research shows content marketing generates 3 times more leads per dollar than outbound marketing, and those leads convert at higher rates because they are already educated.
How to Set Up Attribution in GA4
Google Analytics 4 handles attribution differently than Universal Analytics. The default model is data-driven attribution, which uses machine learning to distribute credit. Here is how to configure it for content ROI tracking.
Step 1: Define Your Conversions
In GA4, go to Admin → Conversions. Mark these events as conversions:
- Form submissions (demo requests, contact forms)
- Email signups (newsletter, lead magnets)
- Purchase events (for e-commerce)
- Custom events (pricing page visits, CTA clicks)
Step 2: Set Up Content Grouping
Create content groups to analyze ROI by content type:
| Content Group | URL Pattern | Purpose |
|---|---|---|
| Blog posts | /blog/* | Organic acquisition |
| Case studies | /case-studies/* | Sales enablement |
| Landing pages | /for/* | Industry targeting |
| Tool pages | /tools/* | Product-led growth |
Content grouping lets you answer “which content type drives the most revenue?” instead of analyzing individual URLs.
Step 3: Enable Enhanced Measurement
GA4 tracks scroll depth, outbound clicks, and file downloads automatically with enhanced measurement. Enable all options under Admin → Data Streams → Enhanced Measurement.
For a full GA4 walkthrough, see our Google Analytics 4 setup guide.
Step 4: Connect to Your CRM
The real power of attribution comes from connecting GA4 to your CRM. When a blog reader becomes a lead and that lead becomes a customer, you need both systems talking.
Set up offline conversion imports or use a middleware tool like Segment or Zapier to pass GA4 client IDs to your CRM. This closes the loop between “read a blog post” and “became a paying customer.”
Your SEO team. $99 per month. 30 optimized articles, published automatically. Every one tracked for performance. Start for $1 →
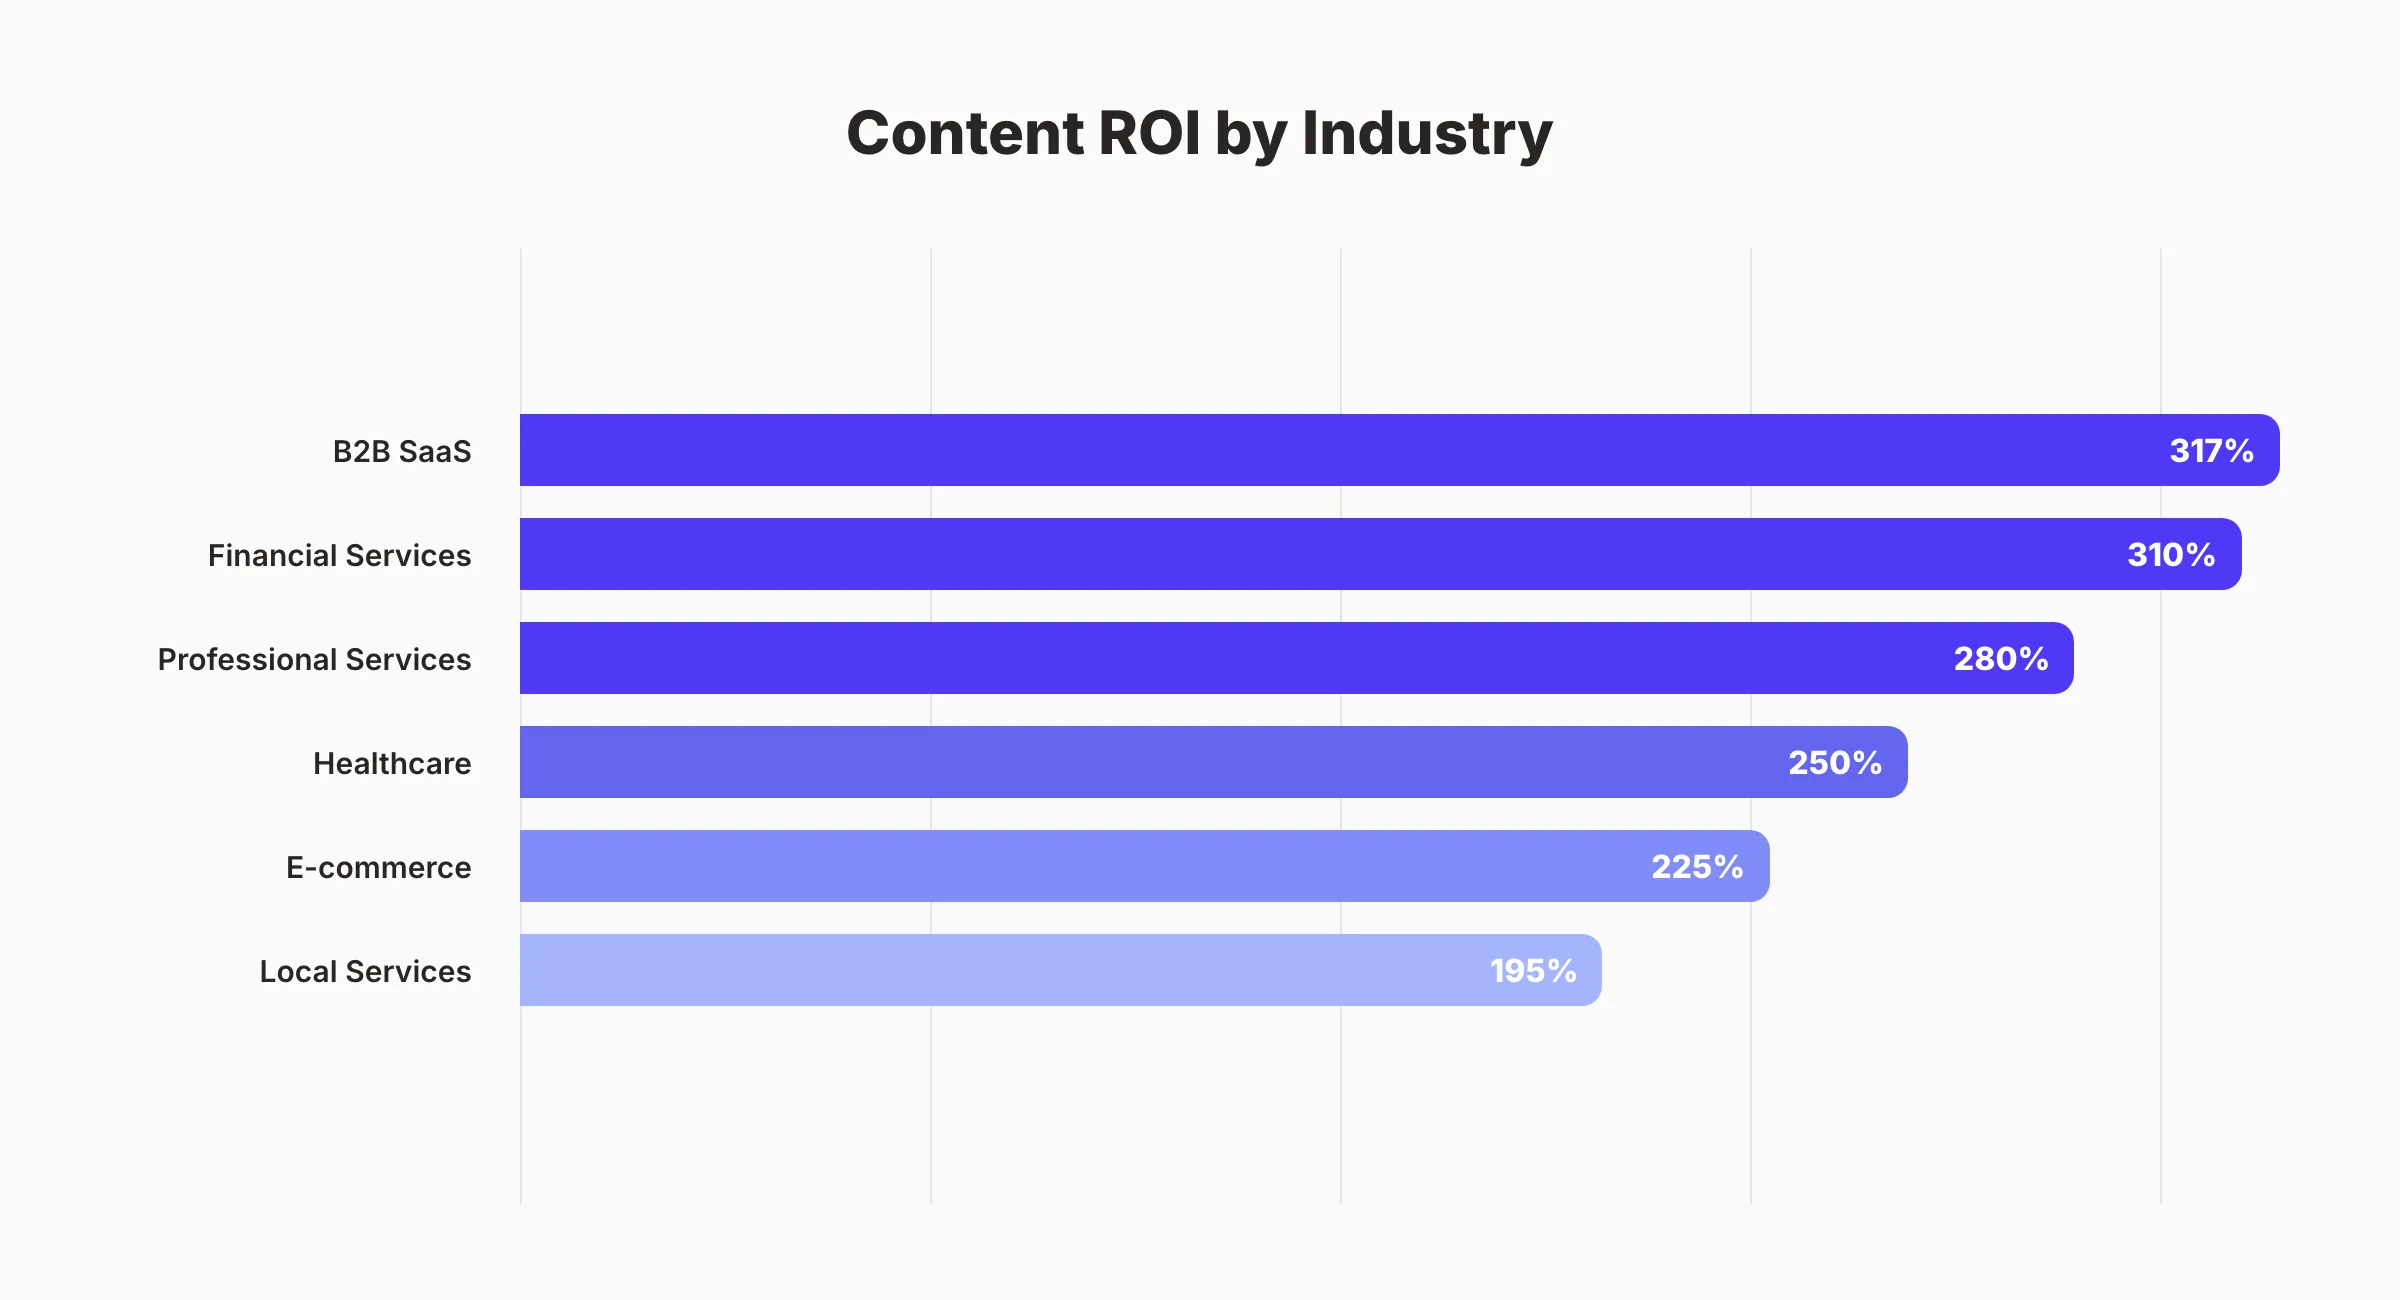
Content ROI Benchmarks by Industry
“Is our content ROI good?” depends entirely on your industry. A 200% ROI in SaaS means something different than 200% in local services.
Industry Benchmark Table
| Industry | Average Content ROI | Median Time to ROI | Top Performer ROI |
|---|---|---|---|
| B2B SaaS | 317% | 6-9 months | 748% |
| E-commerce | 225% | 3-6 months | 520% |
| Professional Services | 280% | 4-8 months | 610% |
| Local Services | 195% | 3-5 months | 440% |
| Healthcare | 250% | 6-12 months | 490% |
| Financial Services | 310% | 8-14 months | 680% |
Sources: Semrush State of Content Marketing 2025, HubSpot Marketing Statistics, First Page Sage ROI study.
What Affects Your Benchmark
Four variables shift your expected ROI:
1. Content velocity. Teams publishing 16+ articles per month see 3.5 times more traffic than those publishing 4 or fewer. Higher content velocity compresses the time to ROI.
2. Domain authority. Sites with higher authority rank faster, which accelerates the return curve. Build authority through consistent publishing and topical authority strategies.
3. Sales cycle length. A plumber books a customer in 48 hours. An enterprise SaaS deal takes 9 months. Longer sales cycles delay ROI measurement but often yield higher lifetime values.
4. Content quality. Thin, generic content produces thin, generic results. High-scoring content. Measured by tools and content audits. Outperforms low-scoring content by 3-5 times in organic traffic.
The Content Compounding Effect
Paid ads stop working the moment you stop paying. Content keeps working for years. This compounding effect is the single most important concept in content ROI.
How Compounding Works
A blog post published in January ranks on page 2 by March. It reaches page 1 by June. It generates 500 organic visits per month by September. Those visits continue for 2-3 years with minimal maintenance.
The math is striking. A single article costing $150 to produce (or far less with Stacc’s content engine) generates $150 in value in month 1, $300 in month 3, $500 in month 6, and $1,200 by month 12. That is an 8x return on a single piece of content. And it keeps climbing.
Multiply this across 30 articles per month, and the compounding becomes exponential. Our blog frequency study analyzed the data: businesses publishing 30+ posts per month generate 13 times more organic traffic than those publishing fewer than 4.
Content ROI vs. Paid Ads ROI
| Factor | Content Marketing | Paid Ads (PPC) |
|---|---|---|
| Month 1 ROI | -80% to 0% | 50% to 200% |
| Month 6 ROI | 100% to 300% | 50% to 200% |
| Month 12 ROI | 300% to 700% | 50% to 200% |
| Cost when paused | $0 (content still ranks) | Revenue drops to $0 |
| Marginal cost per click | Decreasing over time | Fixed or increasing |
| Asset value | Appreciating | Zero |
Paid ads are a rental. Content is ownership. Both have a place. But only one compounds.
The Stacc Stack Method
The Content Compound Effect multiplies when you combine Blog SEO with Local SEO. A dental practice publishing 30 blog posts per month builds organic authority that lifts local pack rankings. The local posts reinforce the blog authority. Each channel amplifies the other.
This dual-channel compounding is why our clients see organic traffic growth 2-3 times faster than clients running blog SEO alone.
3,500+ blogs published. 92% average SEO score. See what Stacc can do for your site. Start for $1 →
How to Build a Content ROI Dashboard
A dashboard is only useful if the right people see the right numbers. Build different views for different stakeholders.
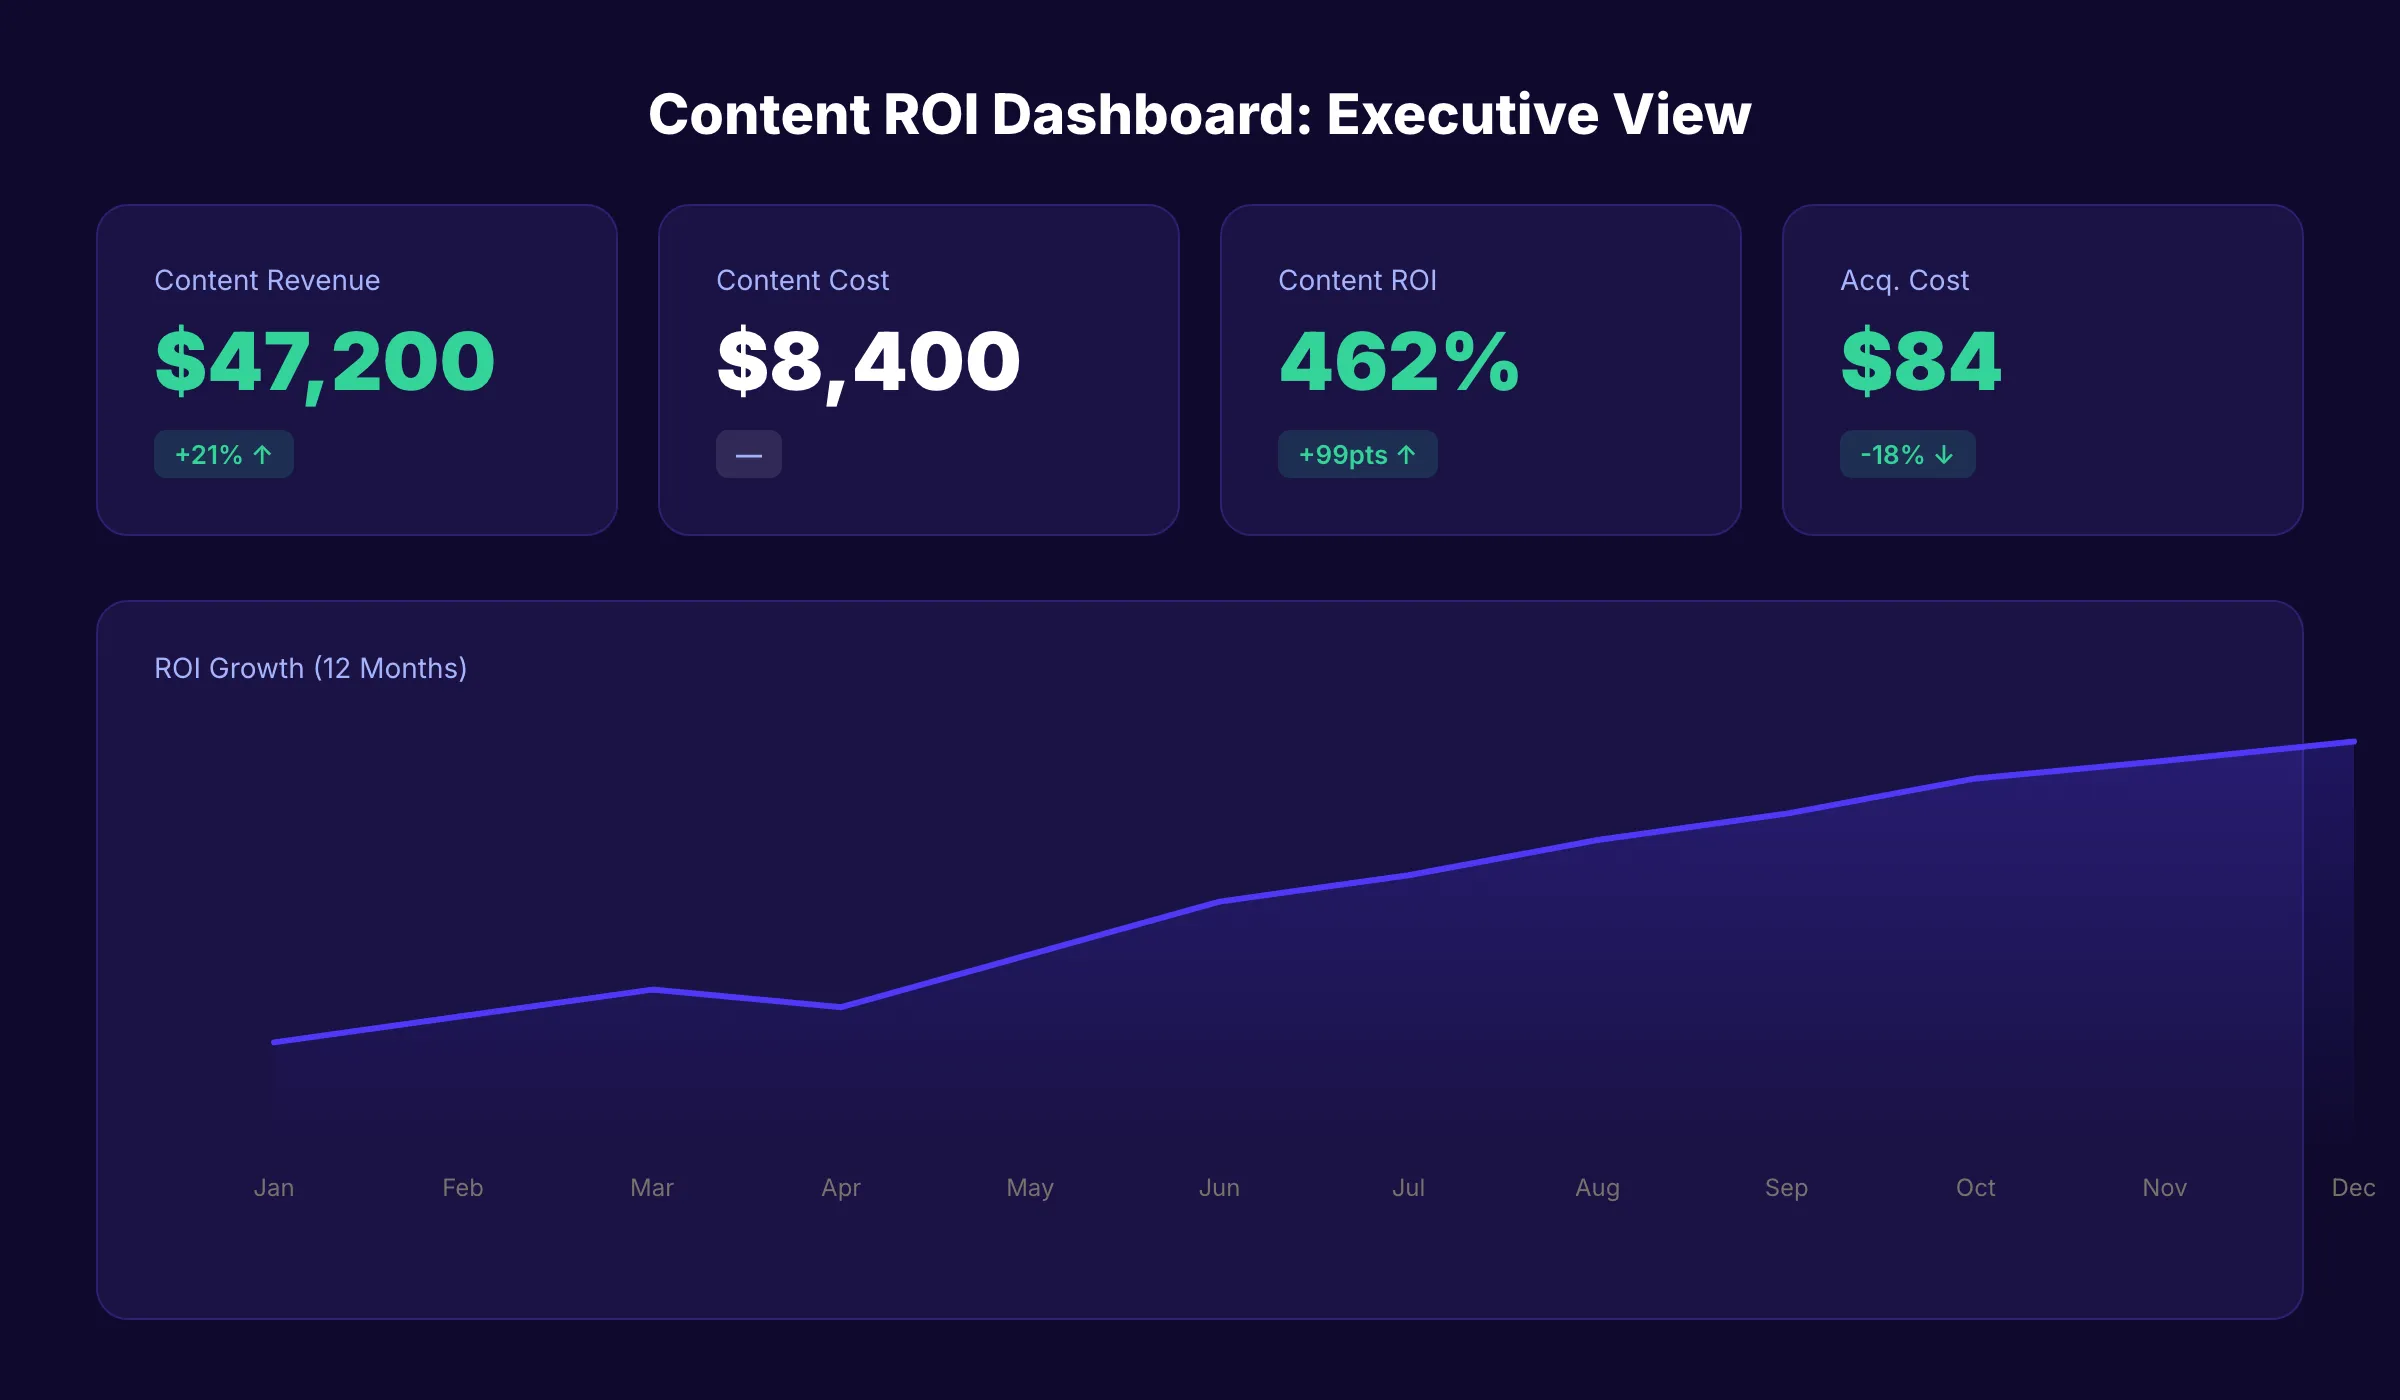
The Executive View (CFO/CEO)
Four numbers. No charts. No jargon.
| Metric | This Month | Last Month | Trend |
|---|---|---|---|
| Content Revenue | $47,200 | $38,900 | +21% |
| Content Cost | $8,400 | $8,400 | , |
| Content ROI | 462% | 363% | +99pts |
| Customer Acquisition Cost | $84 | $102 | -18% |
Executives do not want to see page views. They want to see revenue, cost, and the ratio between them.
The Marketing Manager View
Add these metrics to the executive view:
- Organic traffic by content group
- Top 10 converting pages (with revenue attributed)
- Content pipeline value (leads in progress)
- Content decay alerts (pages losing traffic)
- Publishing velocity vs. target
The Content Team View
Add operational metrics:
- Articles published vs. planned
- Average SEO score per article
- Time from brief to publish
- Keyword ranking distribution (positions 1-3, 4-10, 11-20)
- Internal link coverage
Tools for Dashboard Building
| Tool | Best For | Cost |
|---|---|---|
| Google Looker Studio | Free dashboards with GA4 data | Free |
| HubSpot | CRM-connected content attribution | $800+/mo |
| Databox | Automated reporting with templates | $72+/mo |
| Google Sheets | Manual but flexible | Free |
For most teams, Looker Studio connected to GA4 and Google Search Console covers 80% of reporting needs at zero cost.
What to Do When Content ROI Is Negative
Negative ROI does not mean content failed. It means something specific broke. Diagnose before you react.
The Diagnostic Framework
Work through these questions in order:
1. Is the timeline too short? Content typically needs 3-6 months to generate measurable ROI. If you are measuring at 30 days, the result is meaningless. Extend the window.
2. Is the content reaching the right audience? Check your keyword targeting. Content ranking for informational queries with zero commercial intent will struggle to produce revenue. Align keywords with search intent.
3. Is the content converting? High traffic but zero conversions means the page lacks clear calls to action, the offer does not match the audience, or the conversion path is broken. Run a content audit focused on conversion elements.
4. Is attribution set up correctly? Broken tracking produces broken numbers. Verify your GA4 conversions are firing. Check that UTM parameters are intact. Confirm CRM integration is passing data.
5. Is the content quality high enough? Low-quality content ranks lower, engages less, and converts worse. Use content scoring to benchmark quality across your library.
The Recovery Playbook
| Problem | Fix | Timeline |
|---|---|---|
| Too early to measure | Wait. Re-evaluate at 6 months. | 3-6 months |
| Wrong keywords | Audit and re-optimize for commercial intent | 30-60 days |
| No conversions | Add CTAs, improve offers, fix conversion paths | 14-30 days |
| Broken tracking | Fix GA4 events, verify CRM sync | 1-7 days |
| Low content quality | Update, expand, or replace underperforming posts | 30-90 days |
The most common mistake is killing a content program at month 3 because the ROI is negative. Every content program has negative ROI for the first 2-4 months. That is the investment period. The compounding begins after.
Content ROI in the AI Search Era
AI search engines like Google AI Overviews, ChatGPT, and Perplexity are changing how content generates value. Your ROI framework needs to account for these new channels.
New Metrics to Track
Traditional content ROI tracks organic clicks. AI search introduces new value streams:
- AI citation rate. How often AI models cite your content in responses. See our guide on getting cited by AI search engines.
- Zero-click brand impressions. Your brand appears in an AI Overview even if the user never clicks through.
- AI referral traffic. Visits from ChatGPT, Perplexity, and other AI platforms. Track with UTM parameters or referral source filtering.
How AI Search Affects Content ROI
The impact is mixed. AI Overviews reduce click-through rates for some queries by 30-60%. But they also create new discovery channels. Content that AI models cite gains authority signals that improve traditional rankings.
The winning strategy is creating content that is highly citable. Clear definitions, original data, structured answers. While maintaining the conversion paths that drive revenue. Our AI search and SEO guide covers this in detail.
Rank everywhere. Do nothing. Blog SEO, Local SEO, and Social on autopilot. Start for $1 →
FAQ
What is a good content ROI percentage?
Anything above 200% is strong for most industries. B2B SaaS averages 317%. Local services average 195%. The key is measuring consistently and trending upward over 6-12 months.
How long does it take to see positive content ROI?
Most content programs break even between month 3 and month 6. Full ROI typically materializes between month 6 and month 12. Programs publishing at higher velocity reach breakeven faster.
What is the difference between content ROI and content marketing ROI?
They are the same metric. “Content ROI” refers to the return on any content investment. “Content marketing ROI” specifically refers to content used for marketing purposes. The formula is identical.
How do you measure content ROI without a CRM?
Use GA4 goal tracking for form submissions, email signups, and purchase events. Assign dollar values to each conversion type based on historical close rates. This provides an estimated ROI without full CRM integration.
Does content ROI include organic traffic value?
Yes. Calculate organic traffic value by multiplying monthly organic visits by the equivalent cost-per-click for those keywords in Google Ads. If your content ranks for keywords that would cost $5 per click, and you get 10,000 visits, that is $50,000 in equivalent paid value per month.
Can Stacc help track content ROI?
Stacc publishes the content and provides SEO scoring for every article. For ROI tracking, connect your Google Analytics 4 and Search Console accounts to monitor traffic and conversions from published content.
Content ROI is not a mystery. It is a system. Set up the formula, configure attribution, track the right metrics at each funnel stage, and give the program enough time to compound. The teams that measure content ROI correctly are the teams that keep their budget. And grow it.
Related Tools & Resources
Free SEO Tools:
Best Lists:

Written by
Siddharth GangalSiddharth is the founder of theStacc and Arka360, and a graduate of IIT Mandi. He spent years watching great businesses lose organic traffic to competitors who simply published more. So he built a system to fix that. He writes about SEO, content at scale, and the tactics that actually move rankings.
30 SEO blog articles published every month
Keyword-optimized, scheduled, and live on your site. Automatically.
30-day trial · Cancel anytime
theStacc
Stop writing SEO content manually
30 blog articles, 30 GBP posts, and social media content. Published every month. Automatically.
Start Your $1 Trial$1 for 3 days · Cancel anytime