Content Scoring (2026): Build a Framework That Improves SEO
Content scoring framework for SEO: key metrics, quality rubrics, scoring tools, and automation. Measure content quality objectively and improve rankings systematically.
Content Scoring: The Complete Guide (2026)

You published 30 blog posts last quarter. Organic traffic barely moved. The problem is not volume. The problem is that you have no way to measure whether any of those posts deserve to rank.
Content scoring fixes this. It replaces gut instinct with a repeatable, measurable grading system. Every page gets a number. That number tells you what to publish, what to fix, and what to delete.
We publish 3,500+ blogs across 70+ industries at Stacc. Every single one runs through a content scoring framework before it goes live. The result is a 92% average SEO score across our entire portfolio.
Here is what you will learn in this guide:
- What content scoring is and why it predicts ranking performance
- The 5 types of content scores every marketer should track
- How to build a custom scoring rubric from scratch
- The exact metrics that separate pages that rank from pages that rot
- Which tools automate content scoring (and their limitations)
- How to use scores for content audits and prioritization
- How to score new content versus existing pages
- How to automate scoring at scale without sacrificing accuracy
Table of Contents
- Chapter 1: What Content Scoring Is and Why It Matters
- Chapter 2: The 5 Types of Content Scores
- Chapter 3: How to Build a Content Scoring Framework
- Chapter 4: Key Metrics for Your Content Score
- Chapter 5: Tools That Automate Content Scoring
- Chapter 6: Using Content Scores for Audits and Prioritization
- Chapter 7: Scoring New Content vs Existing Pages
- Chapter 8: Automating Content Scoring at Scale
- Chapter 9: Common Content Scoring Mistakes
- FAQ: Content Scoring
Chapter 1: What Content Scoring Is and Why It Matters {#ch1}
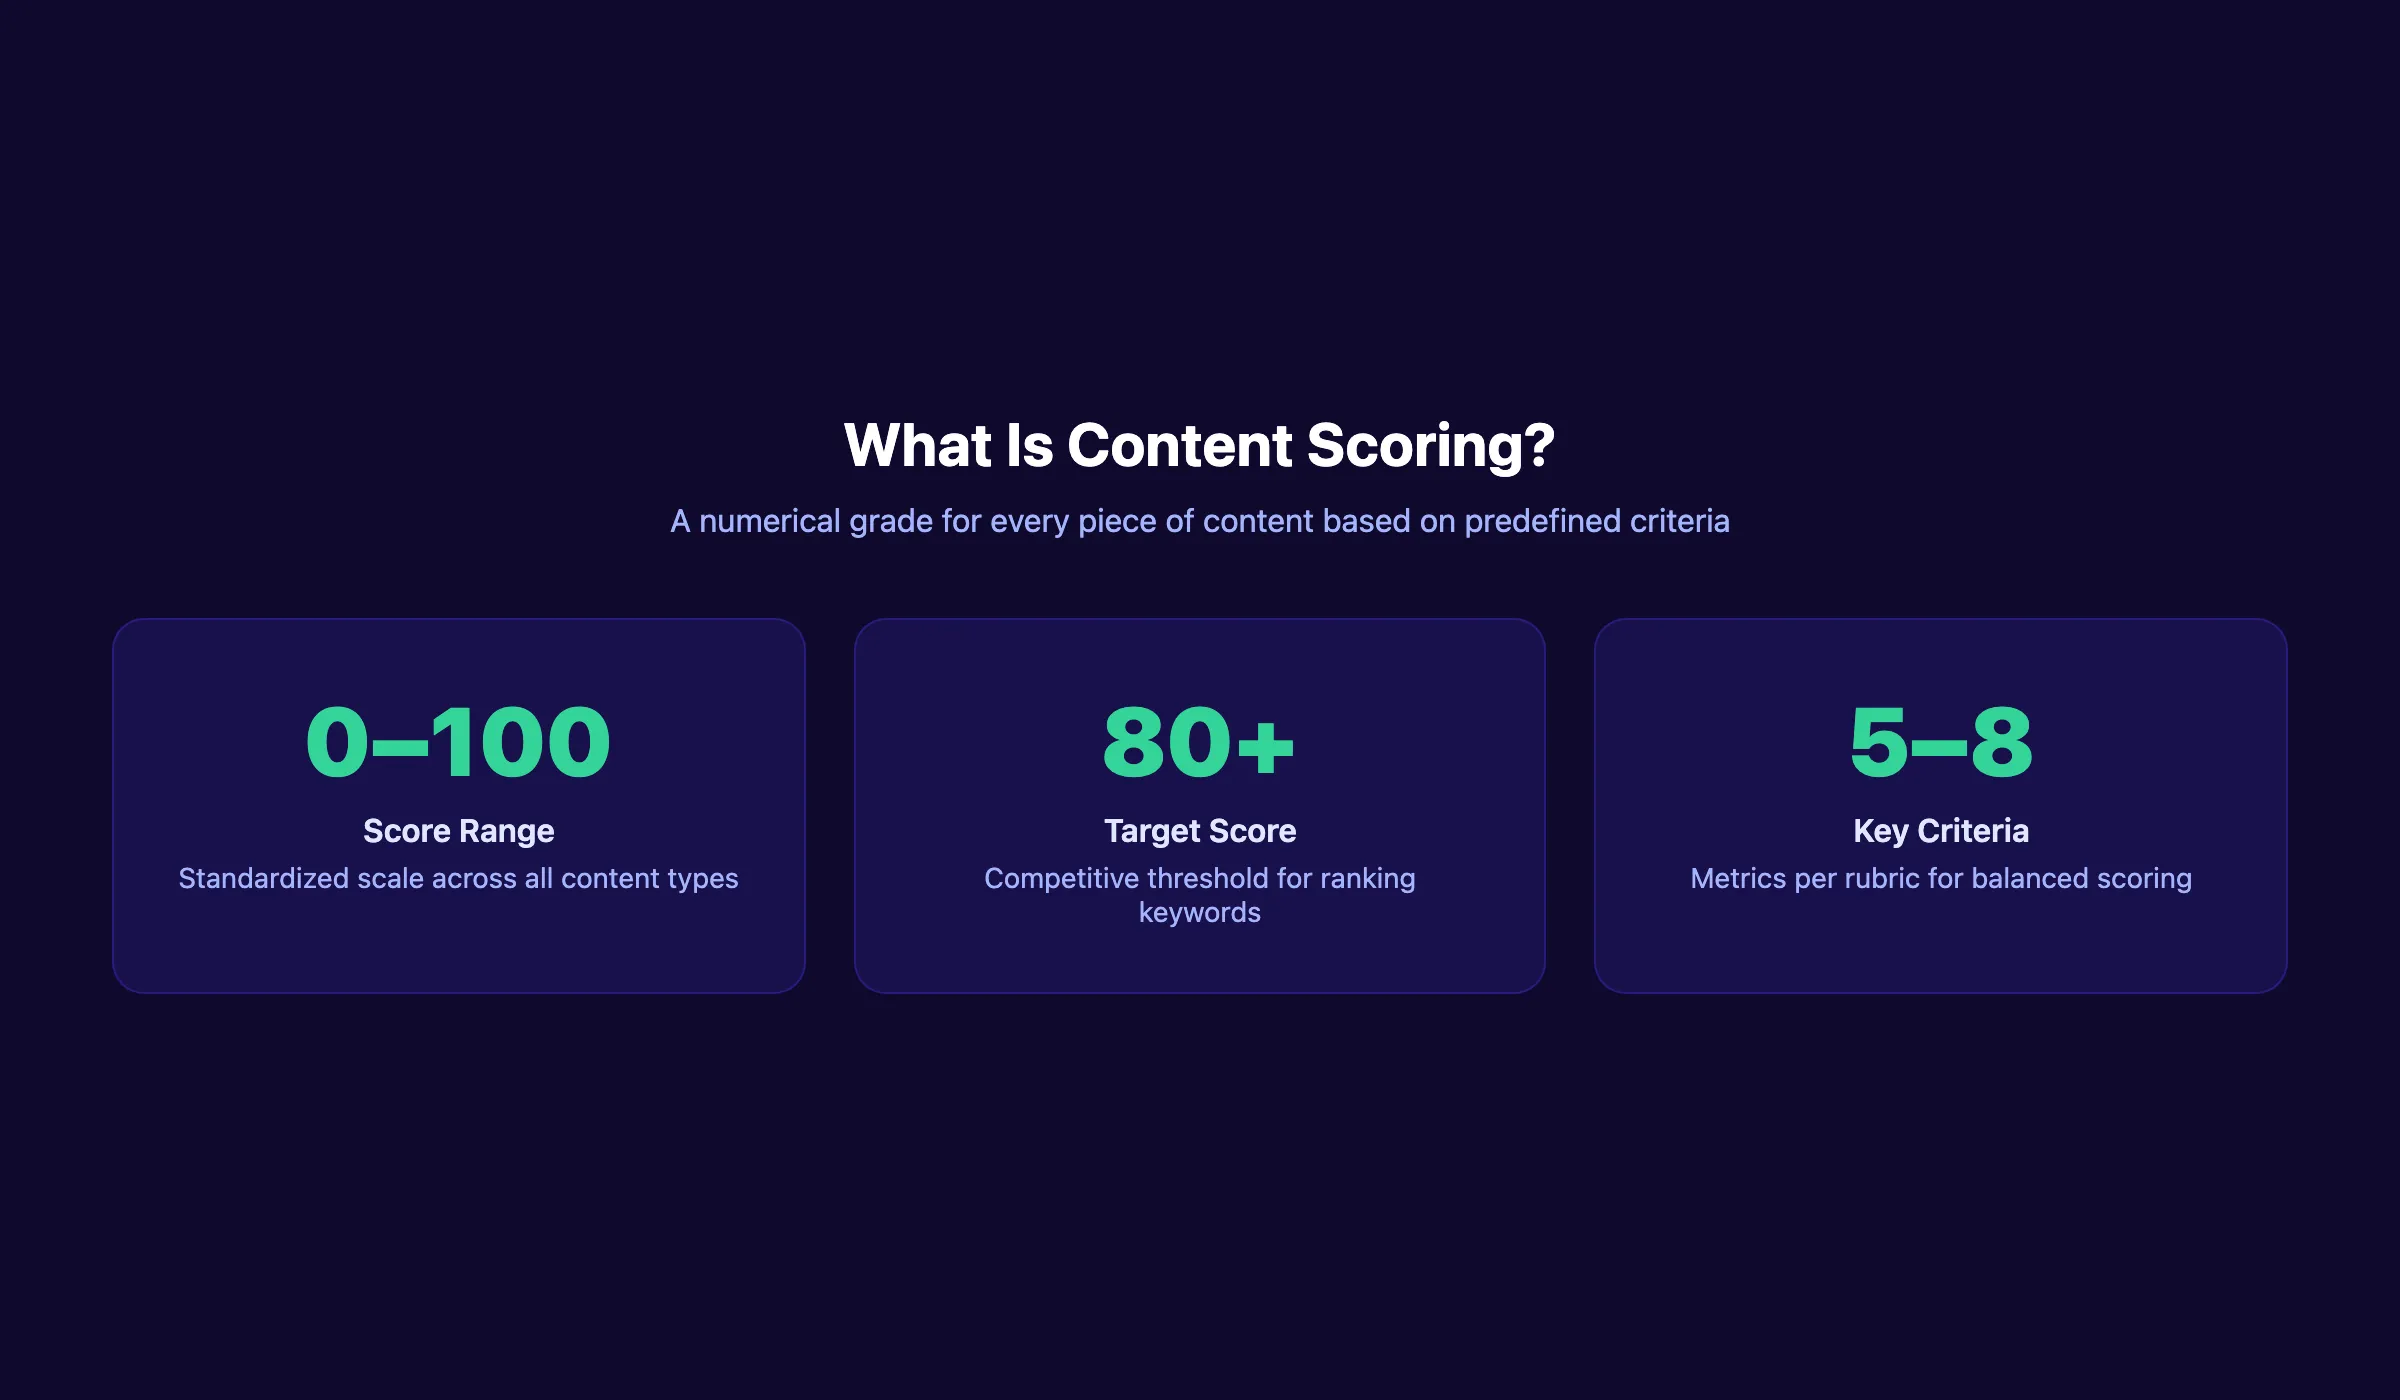
Content scoring assigns a numerical grade to a piece of content based on predefined criteria. Those criteria measure how well the content aligns with SEO targets, reader needs, and business goals. The score is not a vanity metric. It is a decision-making tool that tells you exactly where to invest your time.
The Definition
A content score is a number, typically 0 to 100, that reflects how well a page meets a set of quality and optimization benchmarks. The benchmarks vary by tool and framework. But the core idea stays the same: replace subjective opinions with objective measurement.
Surfer SEO calculates its score by comparing your draft against the top 20 pages ranking for your target keyword. MarketMuse evaluates topical depth and coverage gaps. Both approaches produce a single number that predicts competitive readiness.
The concept is not new. Editors have used rubrics for decades. Content scoring just automates the rubric and ties it to search data.
Why Scores Beat Gut Instinct
HubSpot found that 87% of marketers call data their most underused asset. That statistic explains why most content programs run on opinion instead of evidence.
Without scoring, you face 3 problems:
- No prioritization. Every page feels equally important.
- No baseline. You cannot measure improvement without a starting point.
- No accountability. Writers produce content that “feels good” but underperforms.
A scoring framework solves all 3. It creates a shared standard that every team member can measure against.
What a Score Does Not Tell You
A high content score does not guarantee a first-page ranking. Google evaluates hundreds of factors beyond on-page optimization. Domain authority, backlinks, site speed, and user behavior all affect rankings.
Content scoring addresses the first gate in Google’s pipeline: on-page relevance. If your content does not pass this gate, nothing else matters. But passing this gate alone is not enough. Think of your content score as a floor, not a ceiling.
Chapter 2: The 5 Types of Content Scores {#ch2}
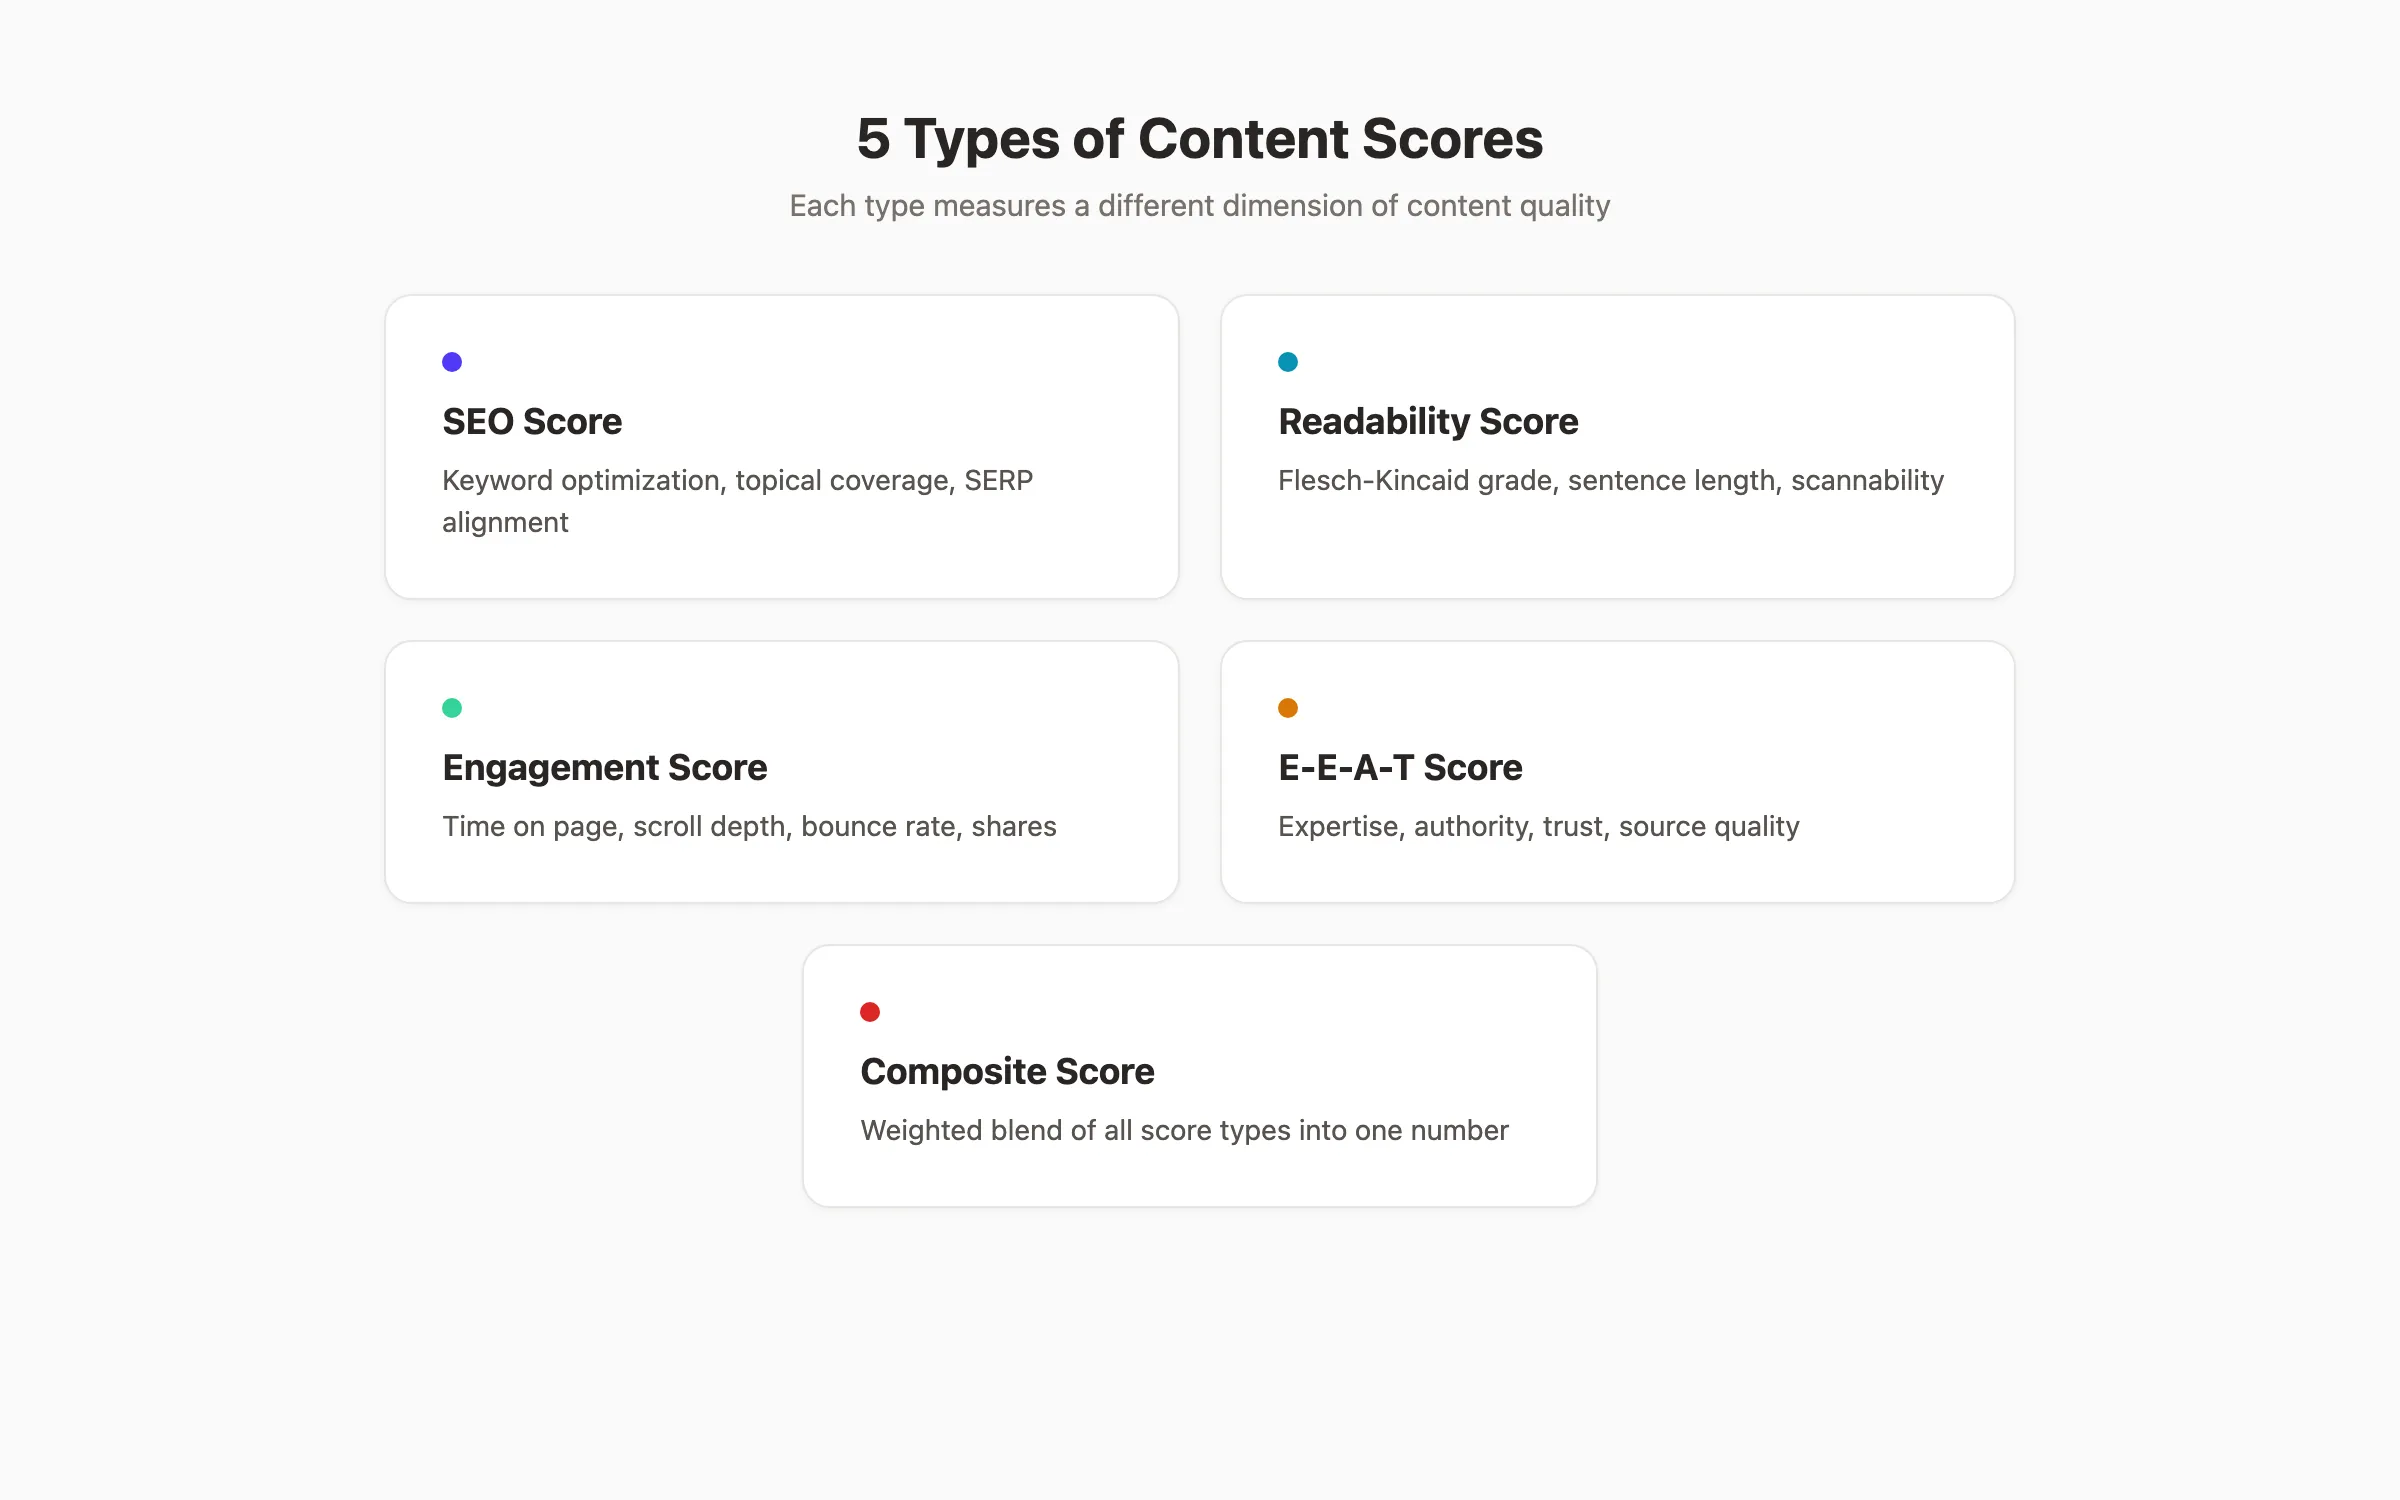
Not all content scores measure the same thing. Different scoring systems target different aspects of content quality. Understanding the 5 main types helps you pick the right one for your goals.
SEO Score
An SEO score measures how well your content is optimized for a target keyword. It evaluates keyword placement, heading structure, meta descriptions, content length, and topical coverage.
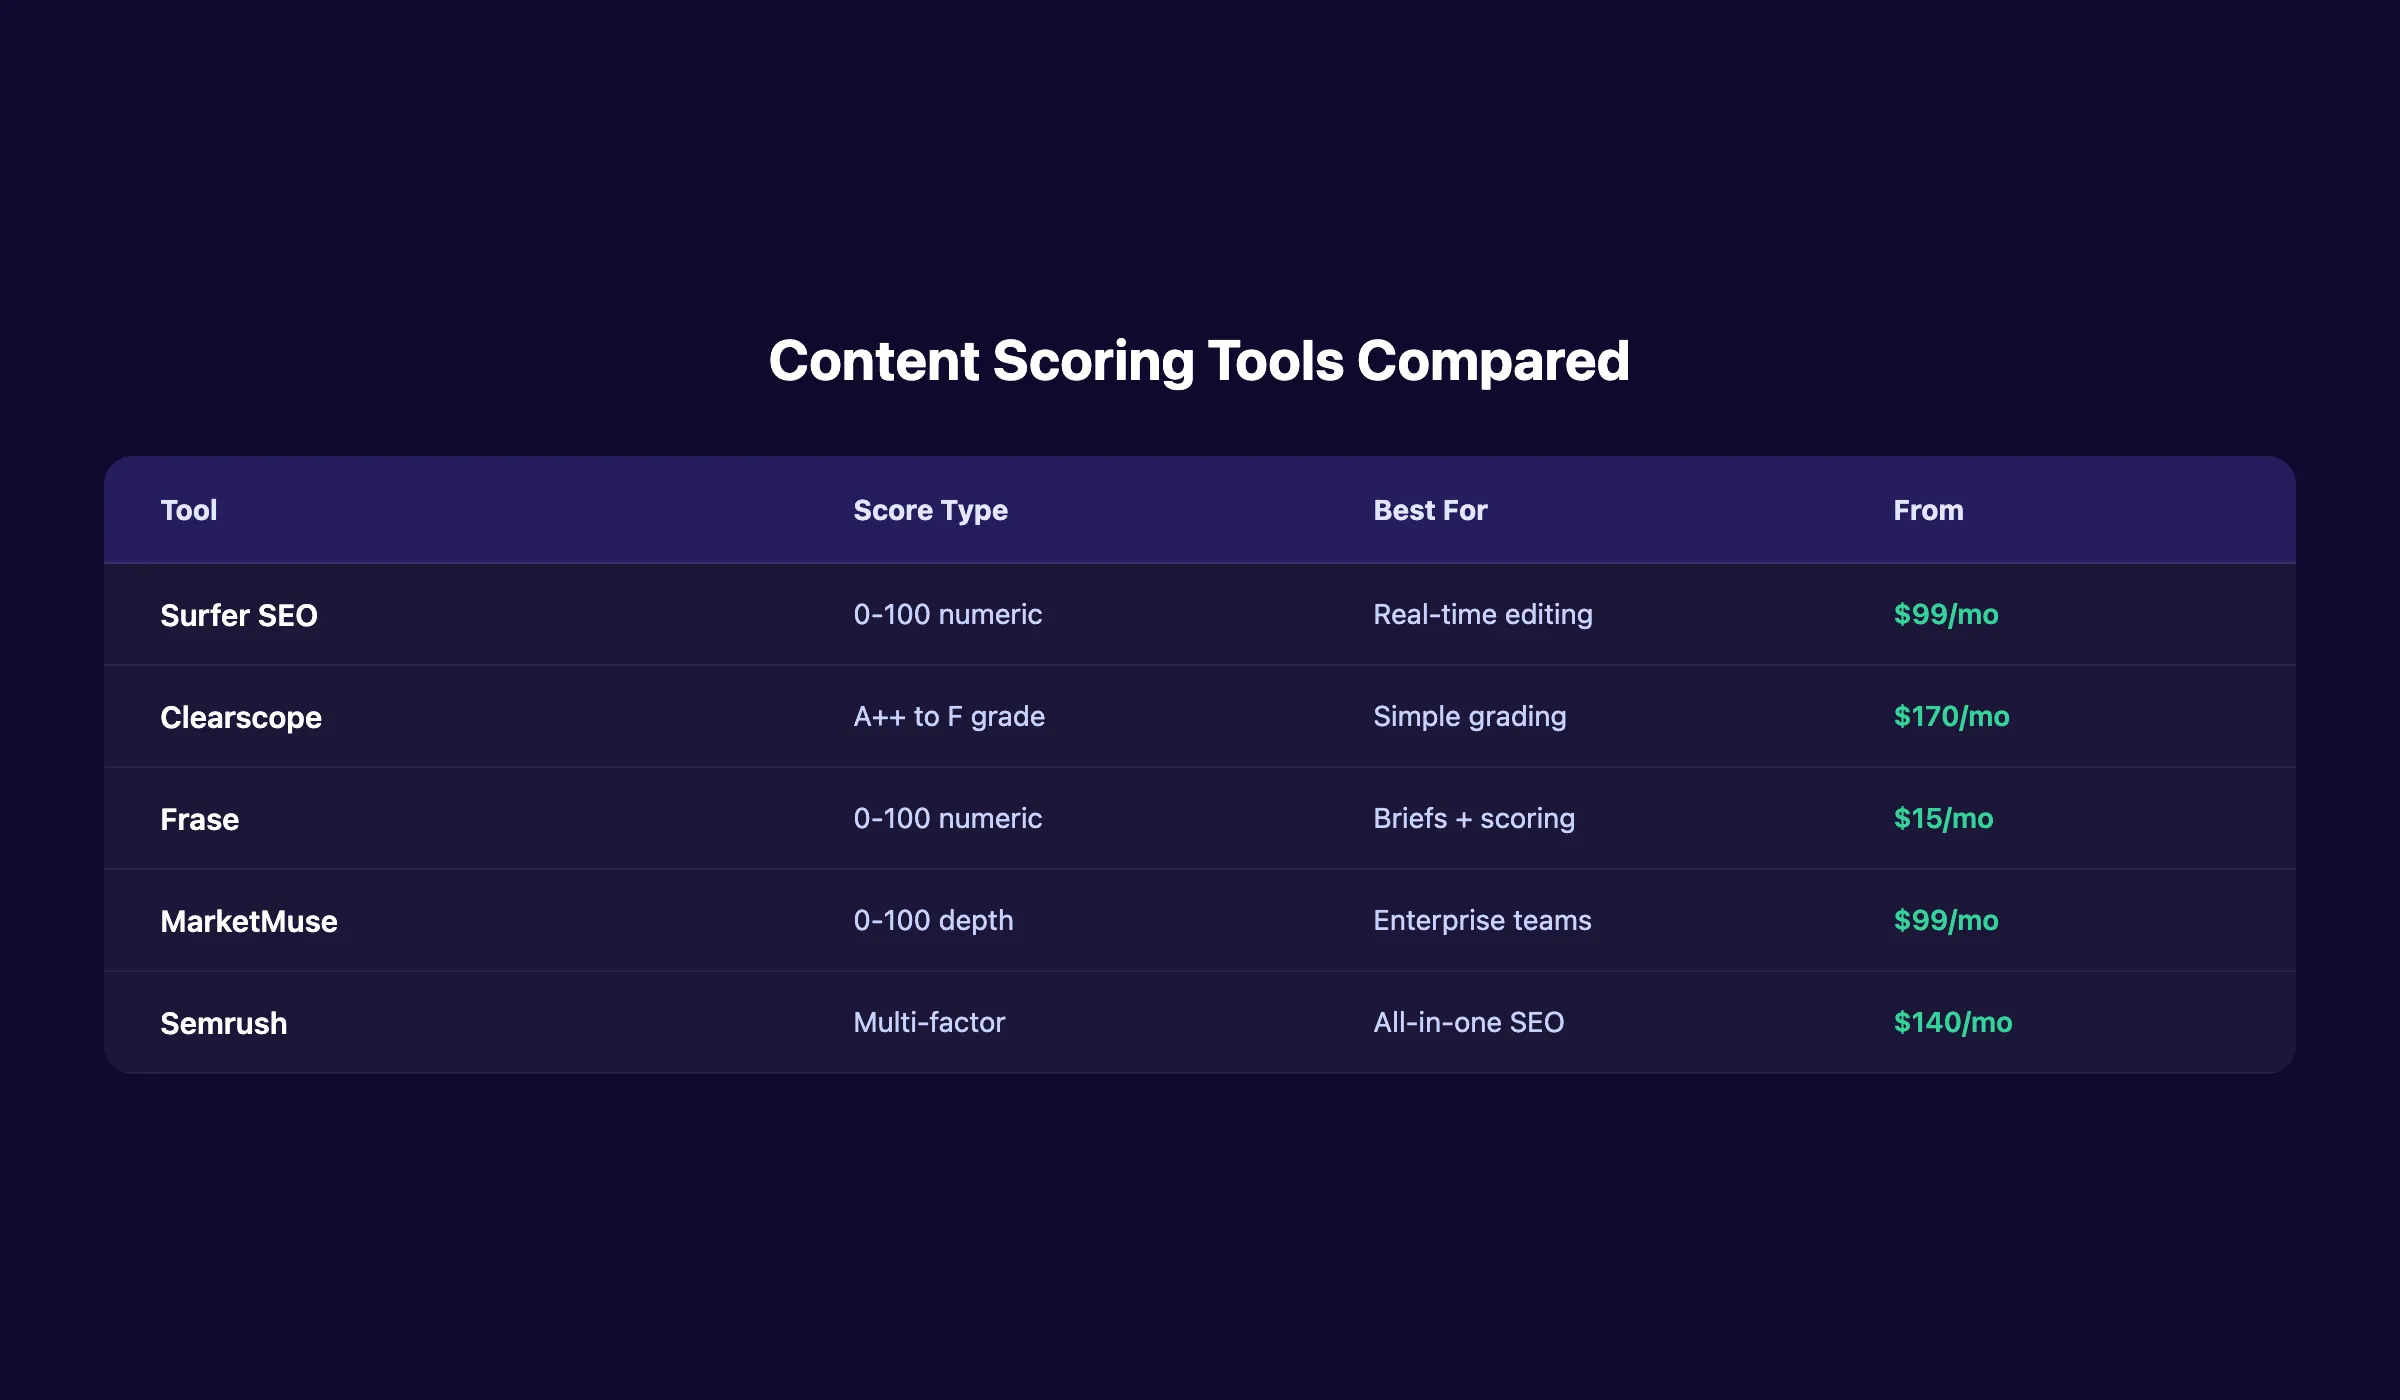
Most content optimization tools produce this type of score. Surfer SEO, Clearscope, and Frase all calculate an SEO-specific number that compares your content against top-ranking competitors.
| Tool | Score Range | Primary Factors |
|---|---|---|
| Surfer SEO | 0–100 | Keywords, NLP terms, length, headings |
| Clearscope | A++ to F | Topic coverage, readability, word count |
| Frase | 0–100 | Topic depth, keyword usage, SERP match |
| MarketMuse | 0–100 | Topical authority, coverage gaps |
A strong SEO score typically falls above 70. Aim for 80+ if you are targeting competitive keywords.
Readability Score
Readability scores measure how easy your content is to read. The Flesch-Kincaid scale is the most common. A score of 60–70 means most adults can read the content comfortably.
Readability matters for SEO because it affects dwell time and engagement. If readers bounce after 10 seconds, Google notices. Clear, scannable writing keeps people on the page longer.
Grammarly provides readability scoring alongside grammar and tone checks. Google Docs has built-in readability analysis. Both are free options for basic scoring.
Engagement Score
Engagement scores use behavioral data to grade content performance after publication. Metrics include time on page, scroll depth, bounce rate, social shares, and comments.
This score type is retrospective. You cannot calculate it before publishing. But you can use it to identify content decay and pages that need updates.
Quality Score (E-E-A-T)
A quality score evaluates expertise, experience, authoritativeness, and trustworthiness. Google’s E-E-A-T framework is the standard here.
Quality scoring checks for:
- Author credentials and bylines
- Citations to authoritative sources
- Original data, research, or first-hand experience
- Factual accuracy and recency
- Proper disclosure and transparency
No tool fully automates E-E-A-T scoring yet. Most teams use a manual rubric with a 1–5 scale across each dimension.
Composite Score
A composite score blends multiple scoring types into a single weighted number. This is the most useful type for content operations at scale.
Example composite formula:
- SEO score (40% weight)
- Readability score (20% weight)
- E-E-A-T score (20% weight)
- Engagement score (20% weight)
The weights depend on your business goals. An affiliate site might weight SEO at 60%. A B2B SaaS company might weight E-E-A-T at 40%.
Stop guessing which content will rank. Stacc publishes 30 SEO-optimized articles per month, each scored and graded before publishing. Start for $1 →
Chapter 3: How to Build a Content Scoring Framework {#ch3}
Off-the-shelf tools give you a score. But a custom framework gives you a scoring system aligned to your specific business, audience, and content goals. Here is how to build one from scratch.
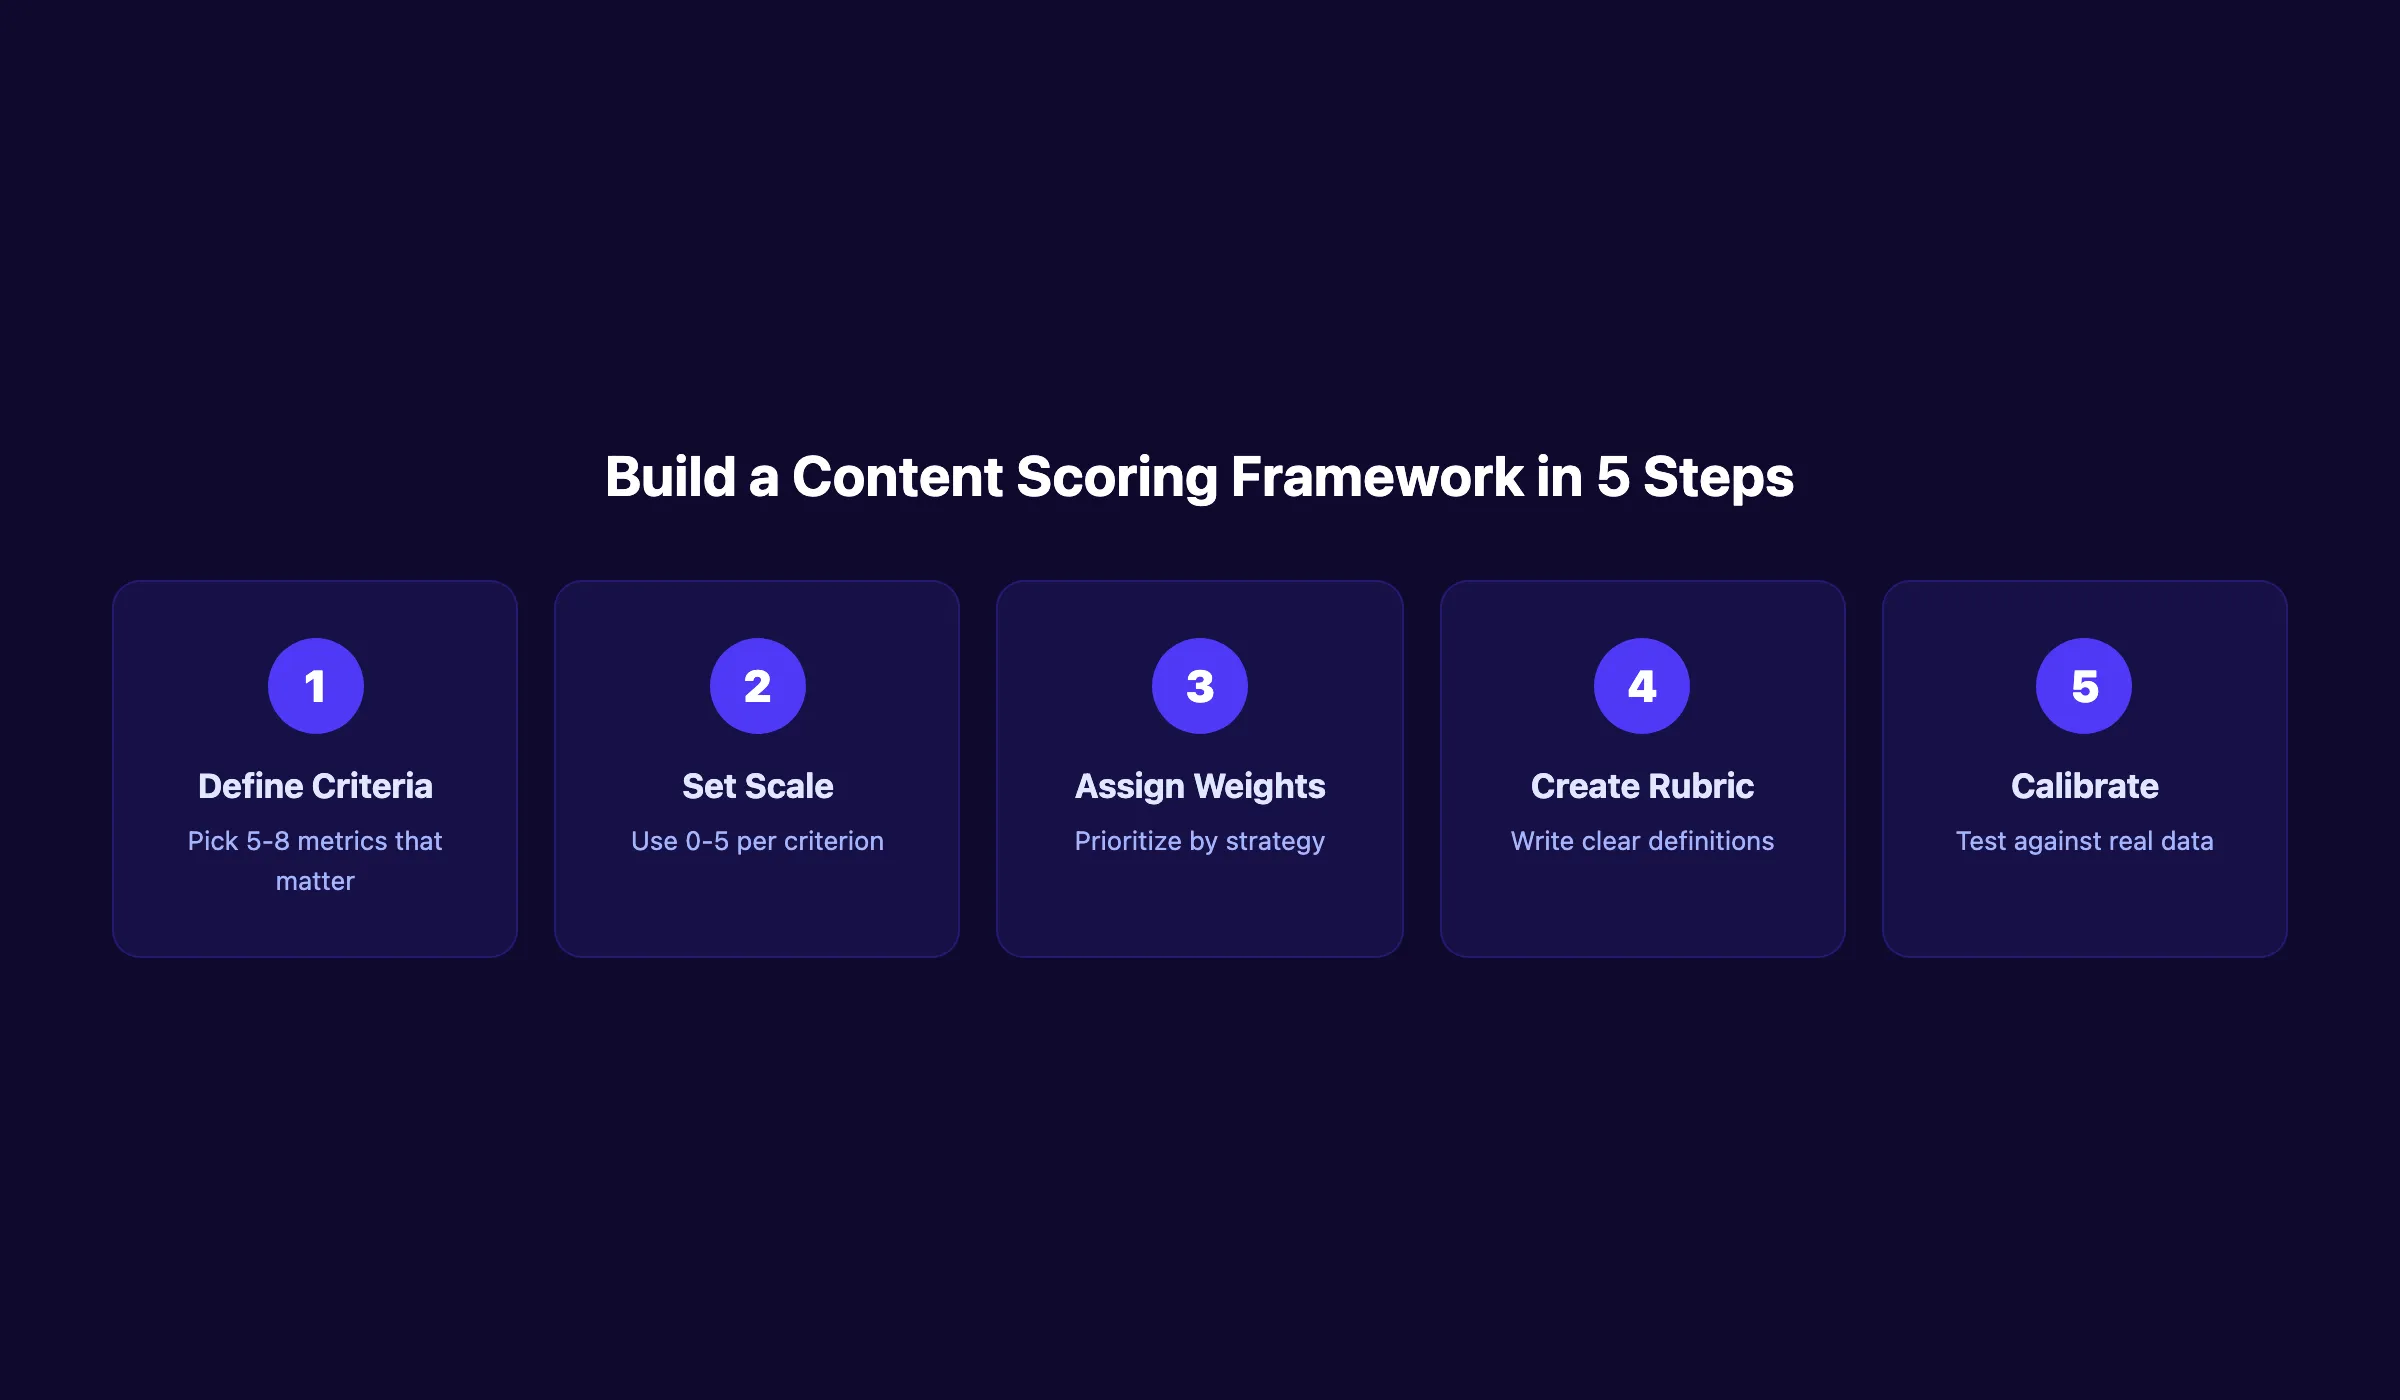
Step 1: Define Your Scoring Criteria
Start with 5–8 criteria that matter most to your content program. Pull from this master list:
- Keyword optimization (target keyword in title, H1, first 100 words)
- Topical depth (covers all relevant subtopics)
- Readability (Flesch-Kincaid 60+ or grade level 8 or below)
- Structure (proper heading hierarchy, short paragraphs)
- Internal links (3–5 per 1,000 words)
- External citations (2–3 authoritative sources)
- Freshness (updated within 12 months)
- E-E-A-T signals (author bio, credentials, sources)
- Search intent alignment (matches the query type)
- Visual elements (images, tables, charts every 300–500 words)
Select the criteria that align with your ranking goals. A local business blog and an enterprise knowledge base will have different priorities.
Step 2: Set Your Scoring Scale
Use a 0–5 scale for each criterion. It is simple enough for manual scoring and granular enough for meaningful differentiation.
| Score | Meaning |
|---|---|
| 0 | Missing entirely |
| 1 | Present but poor |
| 2 | Below average |
| 3 | Acceptable |
| 4 | Strong |
| 5 | Excellent |
Multiply each criterion score by its weight. Sum the weighted scores. Normalize to a 0–100 scale for easy comparison.
Step 3: Assign Weights
Not all criteria deserve equal weight. Assign percentages based on your strategic priorities.
For an SEO-focused content strategy:
| Criterion | Weight |
|---|---|
| Keyword optimization | 25% |
| Topical depth | 20% |
| Search intent alignment | 20% |
| Readability | 15% |
| Internal links | 10% |
| E-E-A-T signals | 10% |
For a brand authority strategy, you might flip keyword optimization and E-E-A-T weights.
Step 4: Create Your Rubric Document
Write clear definitions for each score level within each criterion. Ambiguity kills consistency. Two reviewers should give the same content the same score.
Example rubric entry for “Keyword Optimization”:
- 5: Target keyword in title, H1, first 100 words, 1+ H2, meta description, and 1+ image alt text. Keyword density between 0.5% and 1.5%.
- 3: Keyword in title and H1. Missing from meta or alt text. Density acceptable.
- 1: Keyword appears but not in strategic positions. Over or under-optimized.
Document rubrics like this for every criterion. Store the rubric where your entire team can access it.
Step 5: Test and Calibrate
Score 10 existing pages using your new framework. Compare the results against actual performance data from Google Search Console.
Pages scoring 80+ should correlate with your top-performing content. If they do not, adjust your weights or criteria. Calibration typically takes 2–3 rounds before the framework accurately predicts performance.
Chapter 4: Key Metrics for Your Content Score {#ch4}
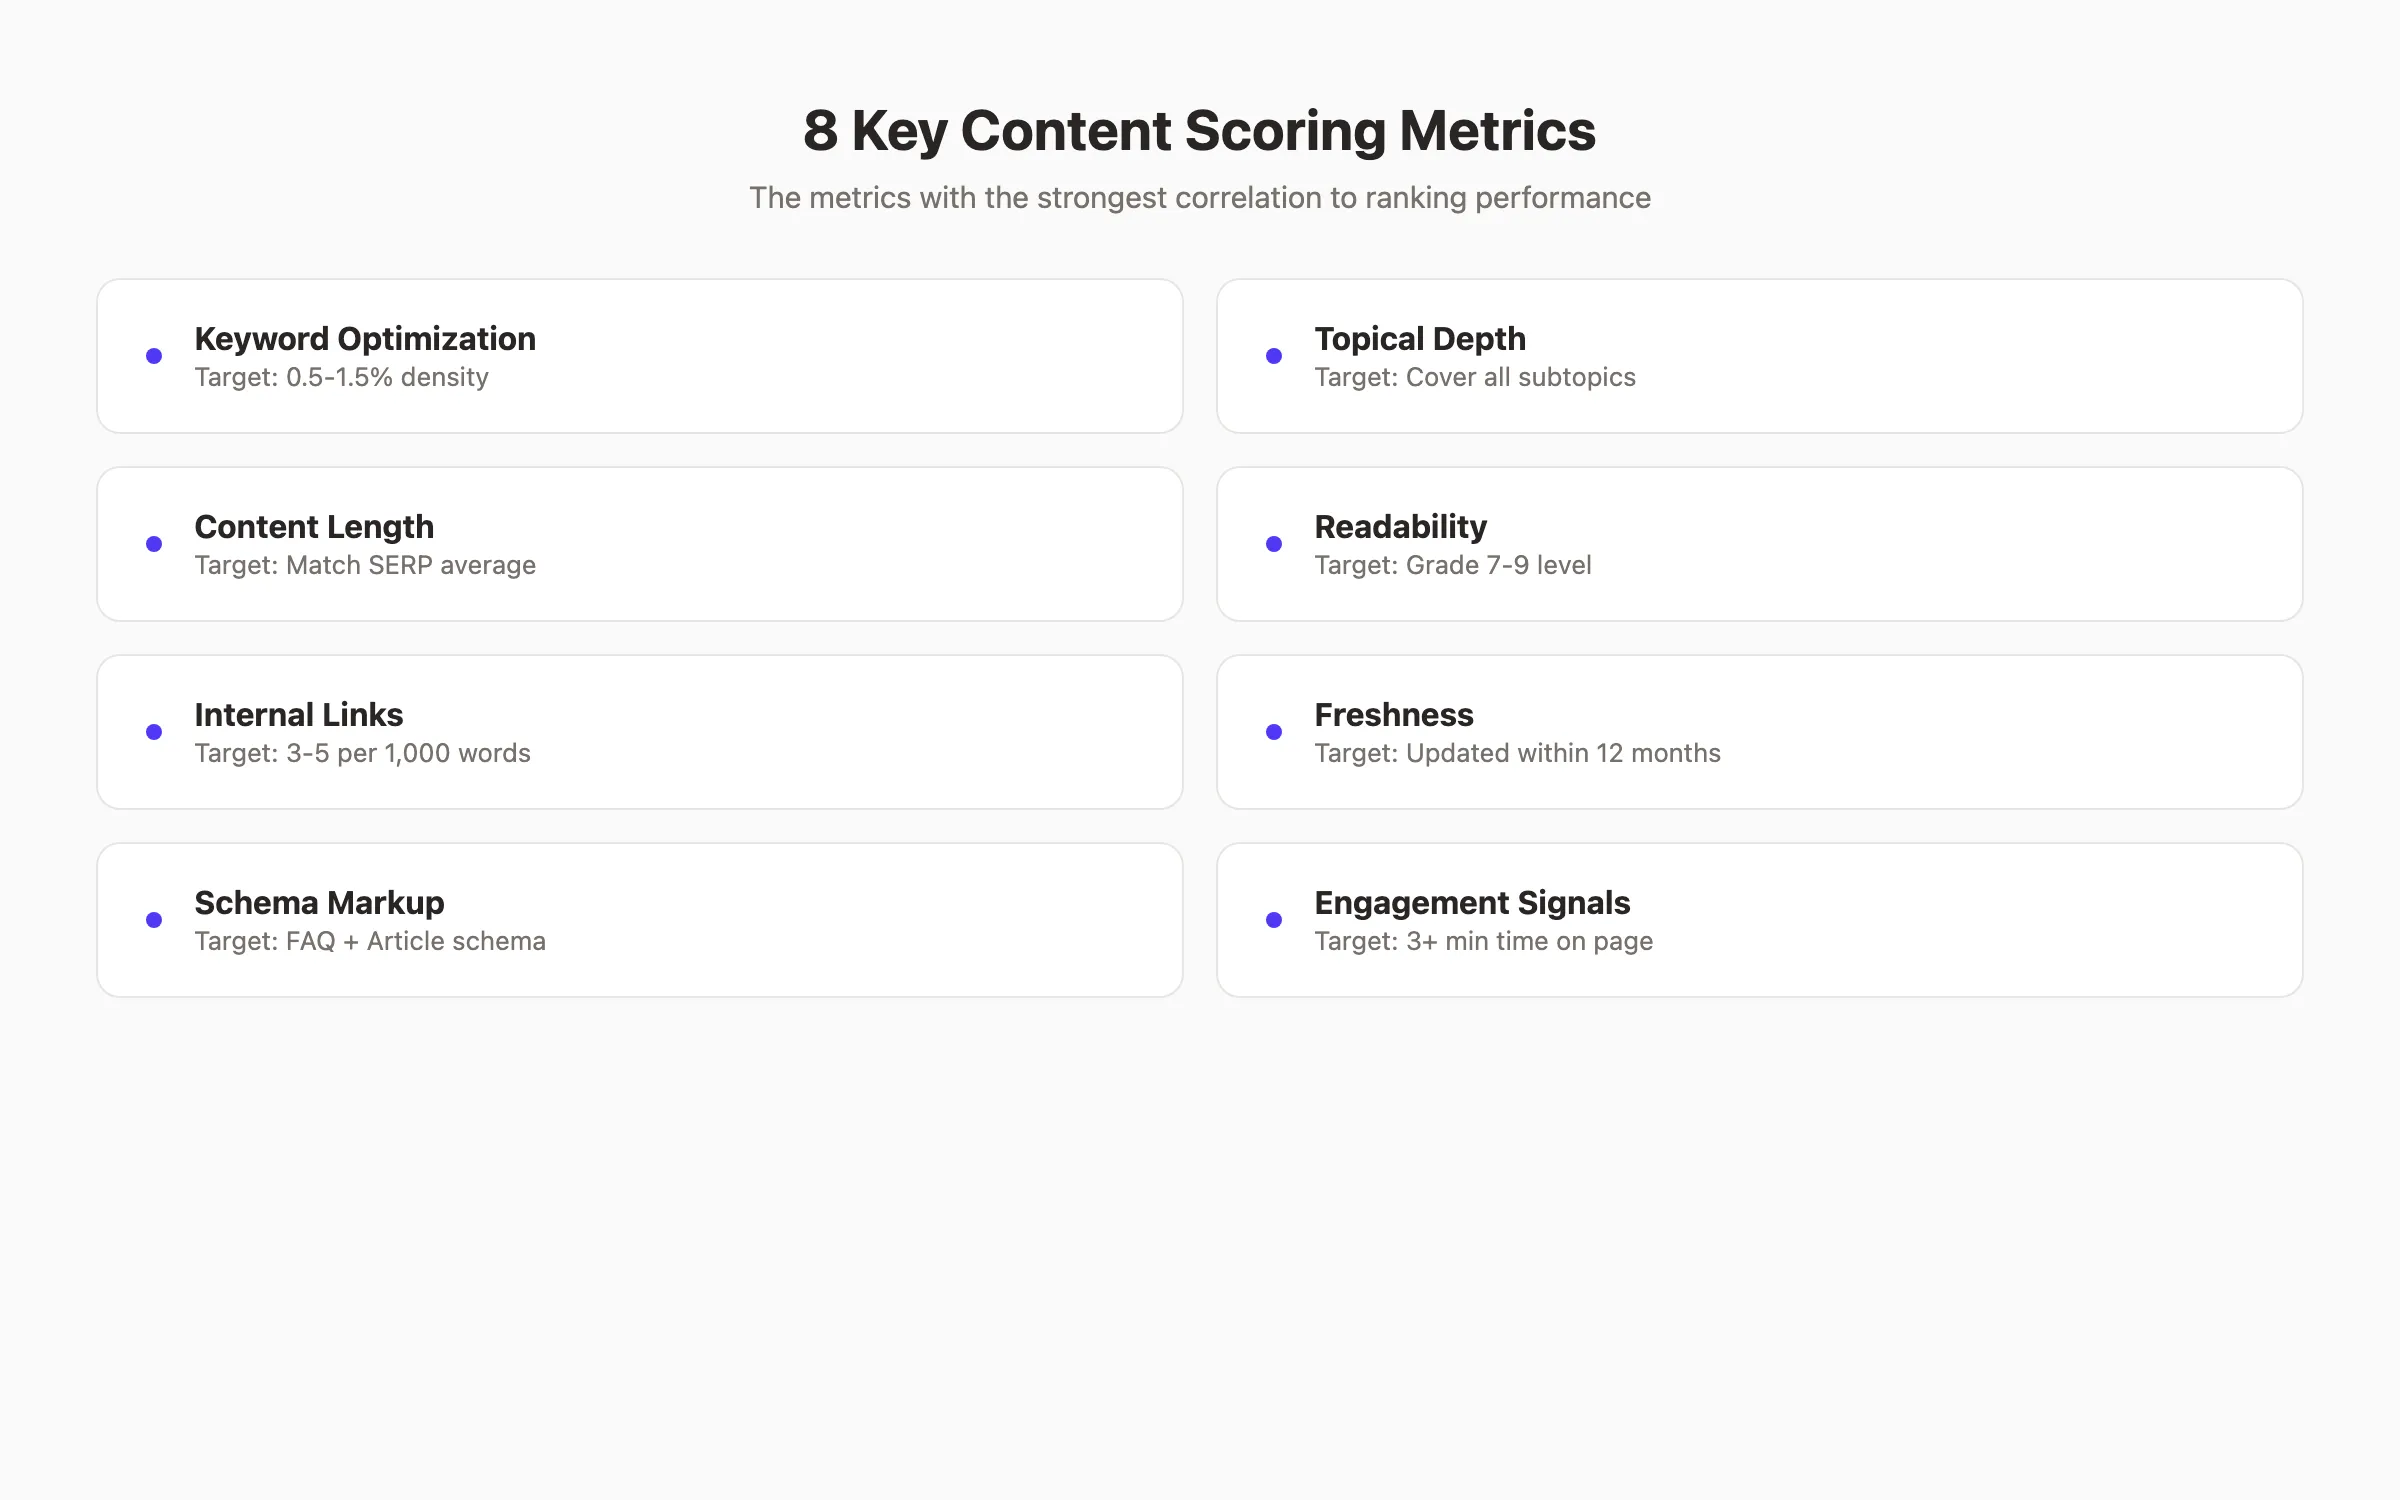
A content score is only as good as the metrics behind it. These are the 8 metrics that have the strongest correlation with ranking performance.
Keyword Optimization
Keyword research identifies what to target. Keyword optimization ensures the target appears in the right places. The checklist is straightforward:
- Primary keyword in the title tag
- Primary keyword in the H1
- Primary keyword in the first 100 words
- Primary keyword in at least 1 H2
- Primary keyword in the meta description
- Primary keyword in at least 1 image alt attribute
- Secondary keywords distributed naturally across the body
Over-optimization hurts more than it helps. A keyword density above 2% triggers spam signals. Keep it between 0.5% and 1.5%.
Topical Depth and Coverage
Google rewards pages that cover a topic thoroughly. A page about “content scoring” should also discuss scoring rubrics, metrics, tools, and common pitfalls.
MarketMuse calls these “topic models.” Surfer SEO calls them “NLP terms.” The concept is the same: your content should include the related terms that top-ranking pages include.
Topical depth is the single biggest differentiator between pages that rank and pages that do not. Building topical authority across an entire cluster amplifies this effect.
Content Length
Blog post length correlates with rankings because longer content tends to cover topics more thoroughly. But length alone means nothing.
The target word count should match the SERP average for your keyword. If the top 10 results average 2,500 words, publishing 800 words puts you at a disadvantage. Publishing 5,000 words of filler puts you at a different disadvantage.
Readability
Average reading level for top-ranking content sits between grade 7 and grade 9. Sentences over 20 words reduce readability. Paragraphs over 3 sentences reduce scannability.
Readability metrics to track:
- Flesch-Kincaid grade level (target: 7–9)
- Average sentence length (target: under 15 words)
- Paragraph length (target: 1–3 sentences)
- Passive voice percentage (target: under 10%)
Internal Link Density
Internal links pass authority between pages and help Google understand site structure. A page with 0 internal links is an orphan. An orphan page rarely ranks.
Target 3–5 internal links per 1,000 words. Use descriptive anchor text that includes the target keyword of the linked page.
Freshness Signals
Google’s Query Deserves Freshness algorithm boosts recently updated content for time-sensitive queries. Pages with dates older than 12–18 months lose ranking momentum.
Freshness metrics:
- Publication date within the last 12 months
- “Updated for [year]” in the title or body
- No outdated statistics, screenshots, or references
- Regular content updates on a quarterly schedule
Schema Markup
Schema markup helps search engines understand your content type and structure. FAQ schema, HowTo schema, and Article schema all improve visibility in rich results.
Pages with FAQ schema earn 35% more SERP real estate on average. That extra visibility drives higher click-through rates.
Engagement Signals
Post-publication metrics reveal how real users interact with your content. Track these through Google Analytics and Google Search Console:
- Average time on page (target: above 3 minutes)
- Scroll depth (target: 70%+ reach the bottom)
- Bounce rate (target: below 55%)
- Click-through rate from SERPs (target: above 3%)
Your content scored and published on autopilot. Stacc handles keyword research, writing, optimization, and publishing for $99 per month. Start for $1 →
Chapter 5: Tools That Automate Content Scoring {#ch5}
Manual scoring works for small content libraries. Once you pass 50 pages, you need automation. These 6 tools handle different aspects of content scoring.
Surfer SEO
Surfer SEO provides the most granular on-page content scoring in the market. Its Content Score compares your draft against the top 20 SERP results in real time.
What it scores: Keyword usage, NLP terms, heading structure, content length, keyword density, True Density (keyword placement, not just frequency).
Best for: Writers who want real-time optimization guidance while drafting.
Limitation: The score reflects on-page optimization only. It does not account for backlinks, domain authority, or technical SEO.
Pricing: Plans start at $99 per month.
Clearscope
Clearscope grades content on an A++ to F scale using topic coverage and readability as primary factors. Its reports show exactly which terms your content needs to include.
What it scores: Topic relevance, readability, word count, term usage.
Best for: Content teams that want simple, letter-grade scoring.
Limitation: Higher price point than competitors. No real-time editor in the base plan.
Pricing: Plans start at $170 per month.
Frase
Frase combines content scoring with content brief generation. Its score evaluates topical coverage against SERP competitors.
What it scores: Topic depth, keyword usage, SERP alignment, content structure.
Best for: Teams that need briefs and scoring in one workflow.
Limitation: The scoring algorithm weighs topic coverage heavily. Readability and engagement get less attention.
Pricing: Plans start at $15 per month.
MarketMuse
MarketMuse uses topic modeling to score content depth. In one case study, 45 of 50 pages improved rankings after using MarketMuse scores to guide optimization.
What it scores: Topical authority, coverage gaps, content depth relative to SERP competitors.
Best for: Enterprise teams managing large content libraries.
Limitation: Steep learning curve. Expensive for small teams.
Pricing: Free plan available. Paid plans start at $99 per month.
Semrush Content Analyzer
Semrush offers content scoring within its broader SEO platform. The Writing Assistant plugin integrates with Google Docs and WordPress.
What it scores: SEO, readability, originality, tone of voice.
Best for: Teams already using Semrush for keyword research and site audits.
Limitation: Scoring is less granular than dedicated content optimization tools.
Pricing: Plans start at $139.95 per month.
Free Alternatives
Not every team needs a paid tool. These free options cover basic scoring:
| Tool | What It Scores | Cost |
|---|---|---|
| Hemingway Editor | Readability, sentence complexity | Free |
| Yoast SEO (WordPress) | Keyword placement, readability | Free |
| Rank Math | Keyword optimization, schema | Free |
| Google Search Console | CTR, impressions, position | Free |
Free tools work well for individual bloggers. Teams publishing more than 10 posts per month need the depth of paid AI SEO content optimization tools.
Chapter 6: Using Content Scores for Audits and Prioritization {#ch6}
Content scoring transforms your content audit from a subjective review into a data-driven triage system. Every page gets a score. That score determines what happens next.
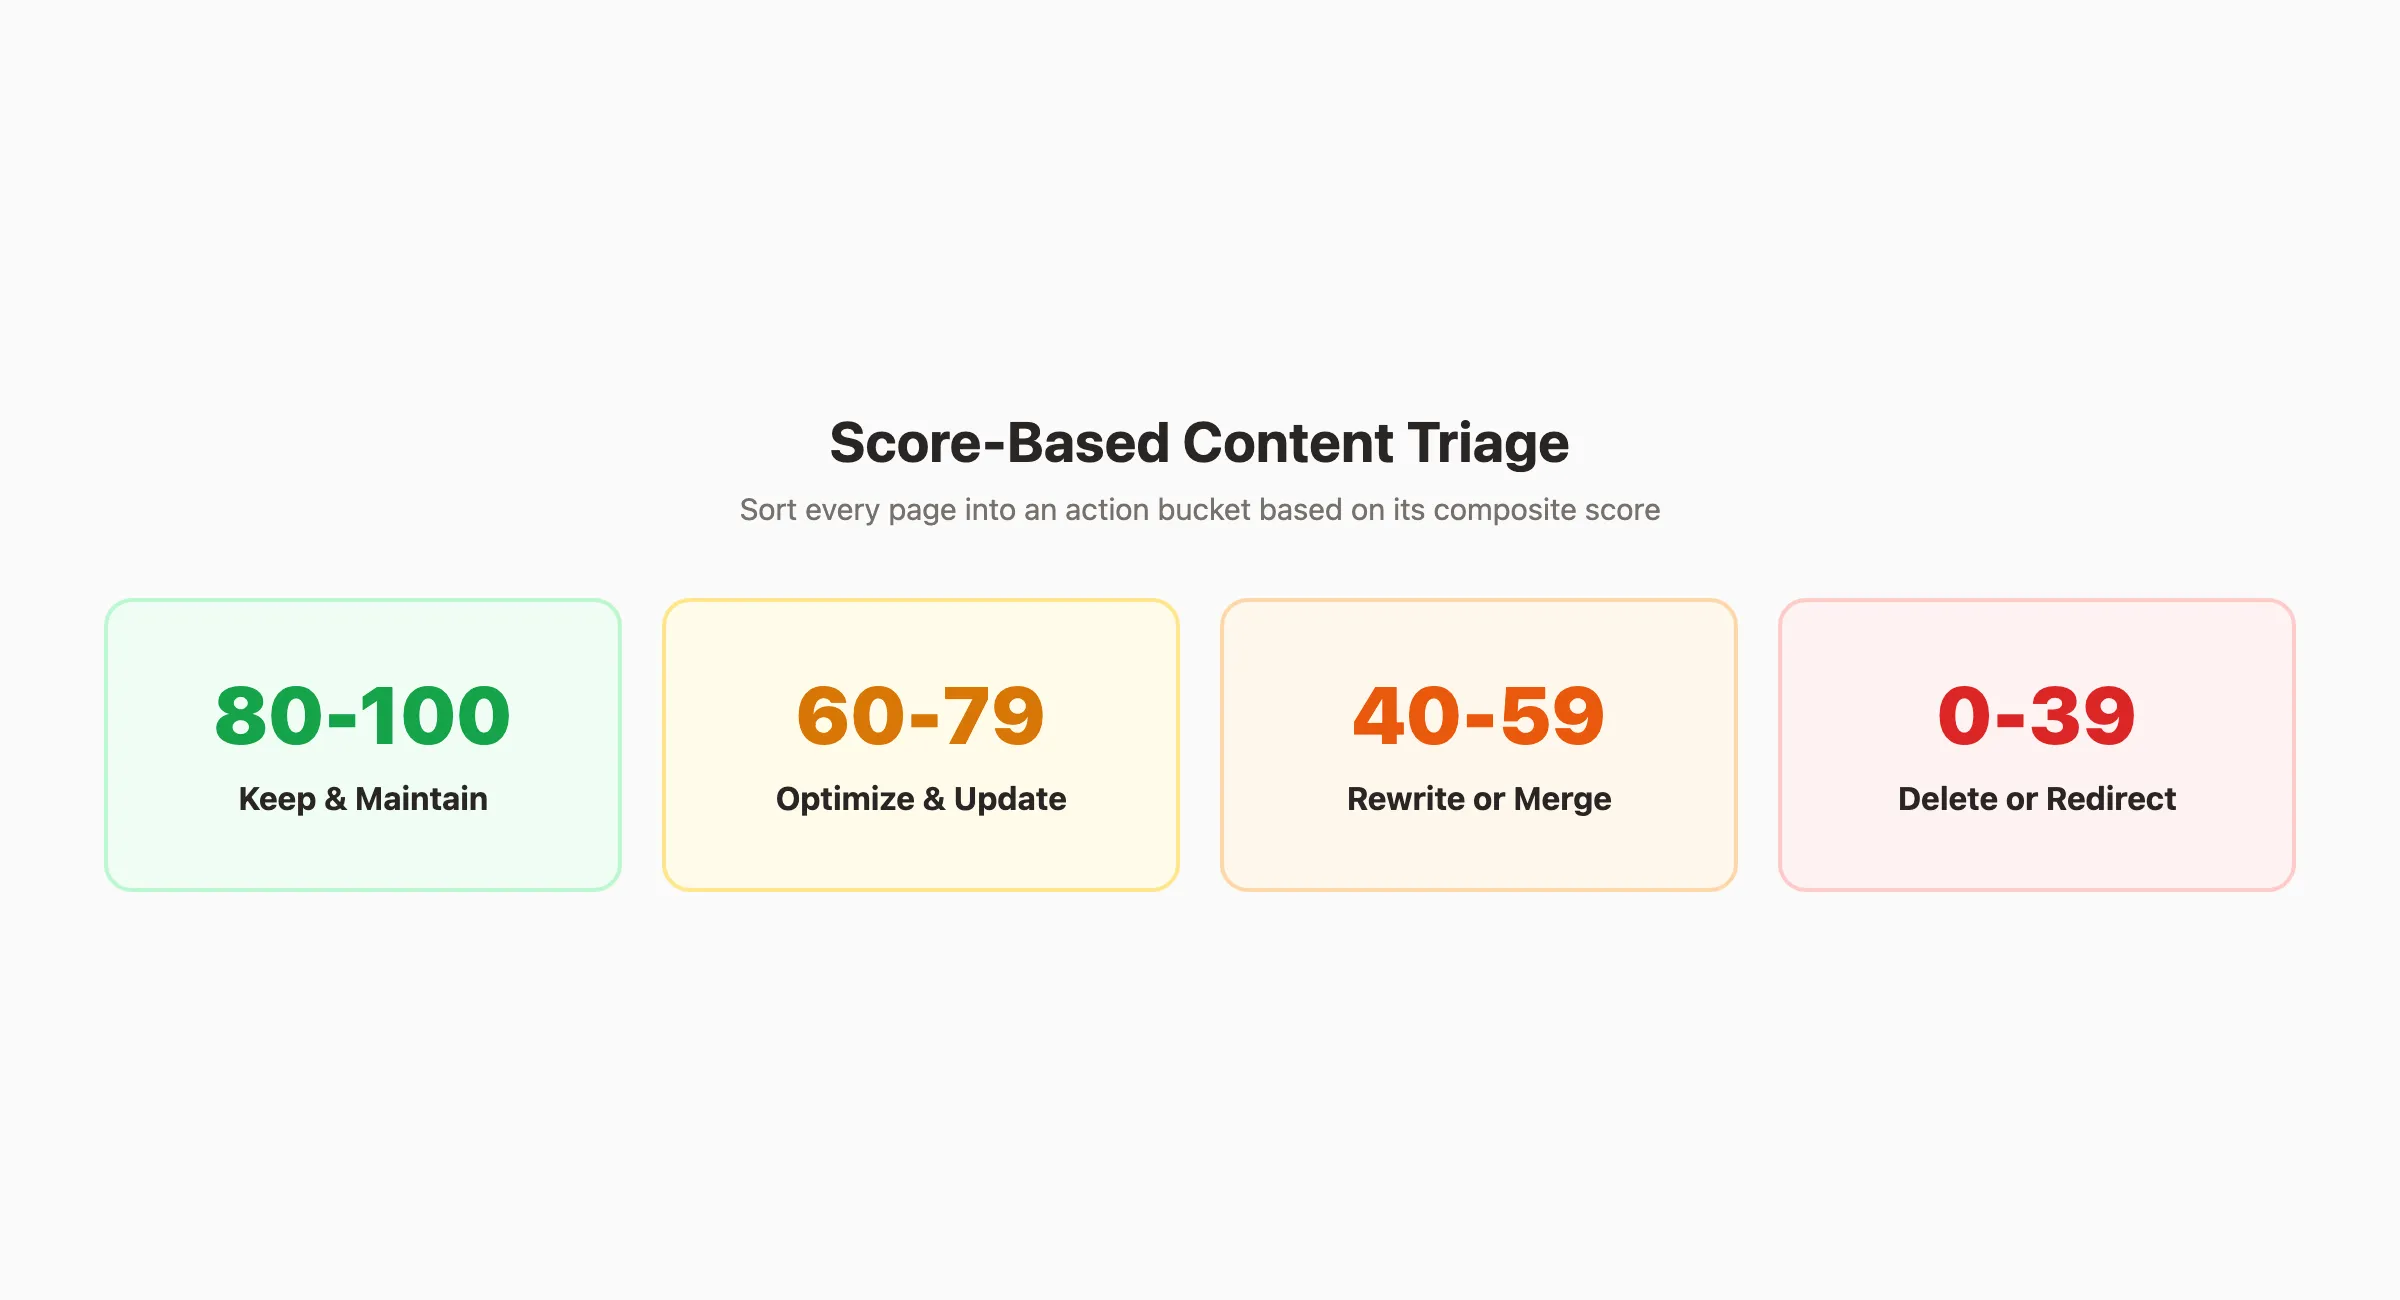
The Score-Based Triage System
Sort every page into 1 of 4 buckets based on its composite score:
| Score Range | Action | Priority |
|---|---|---|
| 80–100 | Keep and maintain | Low (quarterly review) |
| 60–79 | Optimize and update | Medium (within 30 days) |
| 40–59 | Rewrite or merge | High (within 14 days) |
| 0–39 | Delete or redirect | Immediate |
This system eliminates debate about which pages to fix first. The score decides.
Identifying Content Gaps
Pages scoring below 60 often have topical coverage gaps. Run the low-scoring page through Surfer SEO or Frase to identify which subtopics are missing.
These gaps become your content gap roadmap. Fill them with new sections, or create new supporting pages that link back to the underperforming article.
Fixing Thin Content
Pages scoring below 40 are almost always thin content. They lack depth, keyword optimization, or both. Your options:
- Rewrite if the topic has search volume and the page has backlinks
- Merge with a stronger page covering a similar topic
- Delete and 301 redirect if the page has no backlinks and no traffic
Never leave thin content live. It dilutes your site’s topical authority and wastes crawl budget.
Prioritizing Updates by ROI
Not all content updates deliver equal returns. Prioritize pages that are:
- Ranking on page 2 (positions 11–20) with a score below 70
- Generating impressions but low clicks (CTR below 2%)
- Covering high-volume keywords with commercial intent
These “striking distance” pages offer the highest ROI for optimization work. A 15-point score improvement on a page 2 article often pushes it to page 1.
Tracking Score Changes Over Time
Record scores in a spreadsheet or content management system. Track monthly changes. Rising scores should correlate with rising traffic. If they do not, your scoring framework needs recalibration.
Need a full content audit with scoring? Stacc evaluates every page, scores it, and publishes optimized replacements automatically. Start for $1 →
Chapter 7: Scoring New Content vs Existing Pages {#ch7}
The scoring process differs depending on whether you are evaluating a new draft or an existing published page. Each scenario requires a different workflow and different benchmarks.
Scoring Before Publishing
Score every draft before it goes live. This is the single most impactful habit you can build into your content workflow.
The pre-publish scoring checklist:
- Run the draft through a content optimization tool
- Verify keyword placement (title, H1, first 100 words, H2, meta)
- Check readability score (Flesch-Kincaid 60+)
- Confirm internal links (3–5 per 1,000 words)
- Validate external citations (2–3 authoritative sources)
- Review heading structure (no orphan H3s, no consecutive headings)
- Check content length against SERP average
Set a minimum publish threshold. At Stacc, nothing goes live below a 75 composite score. Pages scoring 75–85 ship with notes for improvement. Pages scoring 85+ ship confidently.
Scoring Published Pages
Published pages have additional data points available: traffic, rankings, engagement, and conversions. Add these post-publication metrics to your scoring framework.
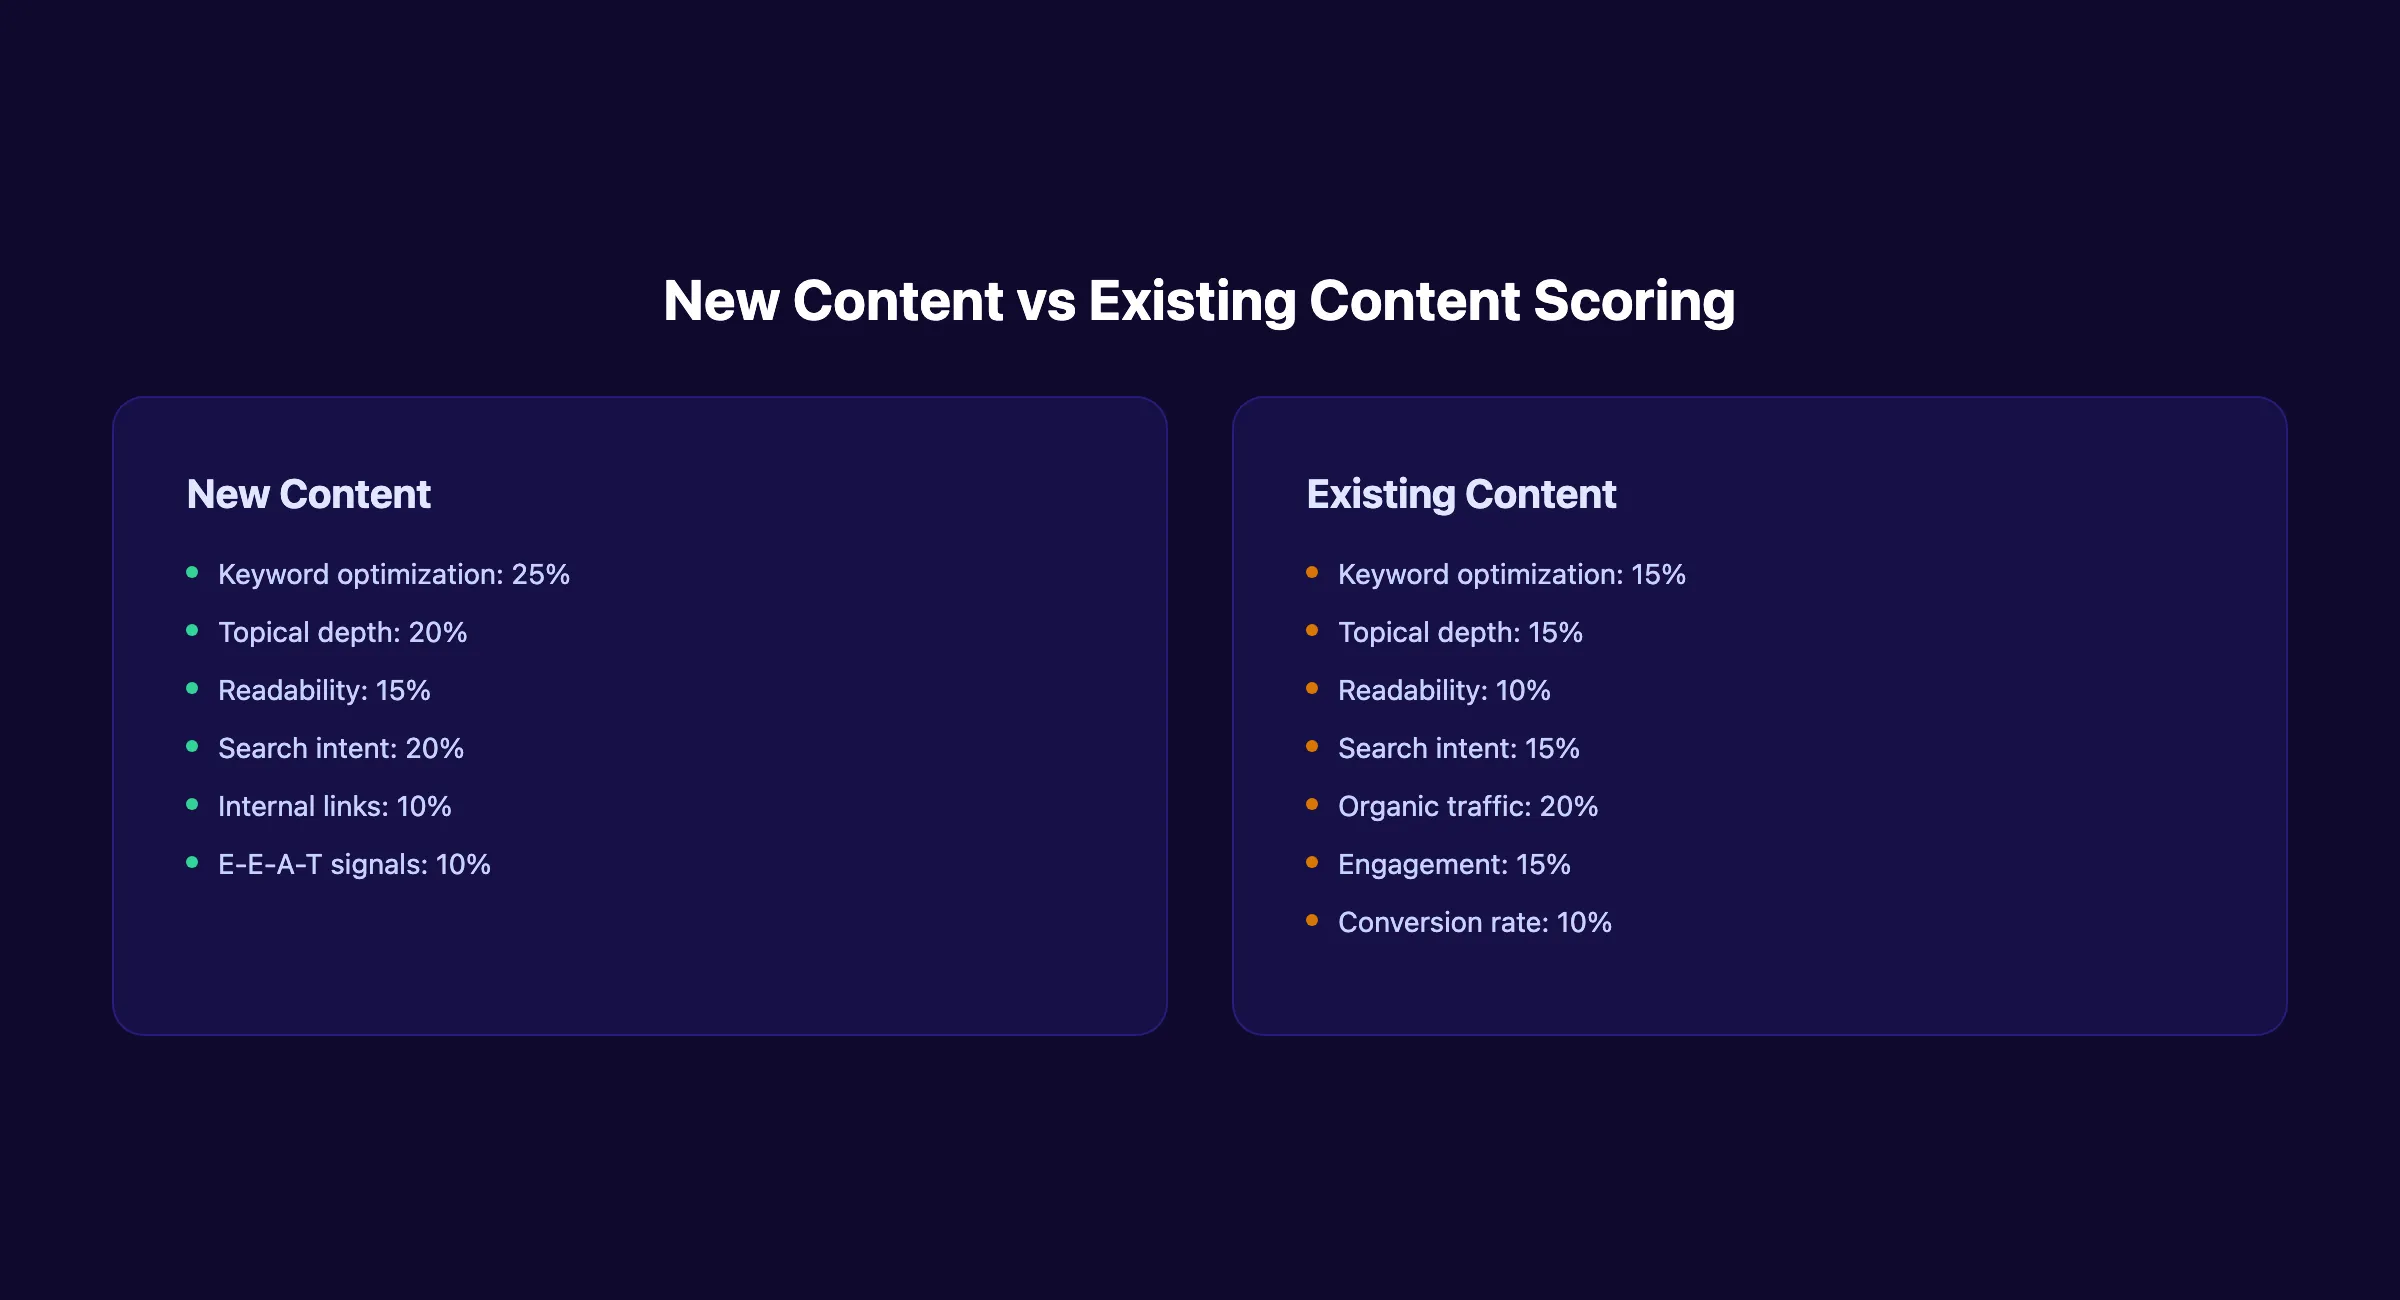
Expanded criteria for existing pages:
| Metric | Weight (New) | Weight (Existing) |
|---|---|---|
| Keyword optimization | 25% | 15% |
| Topical depth | 20% | 15% |
| Readability | 15% | 10% |
| Search intent | 20% | 15% |
| Organic traffic | 0% | 20% |
| Engagement signals | 0% | 15% |
| Conversion rate | 0% | 10% |
Notice how the weights shift. Performance data becomes the dominant factor once you have 90+ days of traffic data.
The Content Lifecycle Score
Content performance follows a predictable curve. New pages ramp up over 60–90 days. They peak. Then they decay.
Track scores at each lifecycle stage:
- Draft stage: Pre-publish optimization score
- Launch stage (0–90 days): Score + initial ranking data
- Growth stage (3–12 months): Score + traffic trends
- Maturity stage (12–24 months): Score + content decay signals
- Refresh stage: Updated score after optimization
This lifecycle approach catches declining pages before they drop off page 1.
When to Rescore
Rescore every page on a rolling basis:
- High-traffic pages: Monthly
- Medium-traffic pages: Quarterly
- Low-traffic pages: Every 6 months
- New pages: At 30, 60, and 90 days post-launch
Chapter 8: Automating Content Scoring at Scale {#ch8}
Manual scoring works for 20 pages. It breaks at 200. Automation is not optional for content teams publishing at volume.
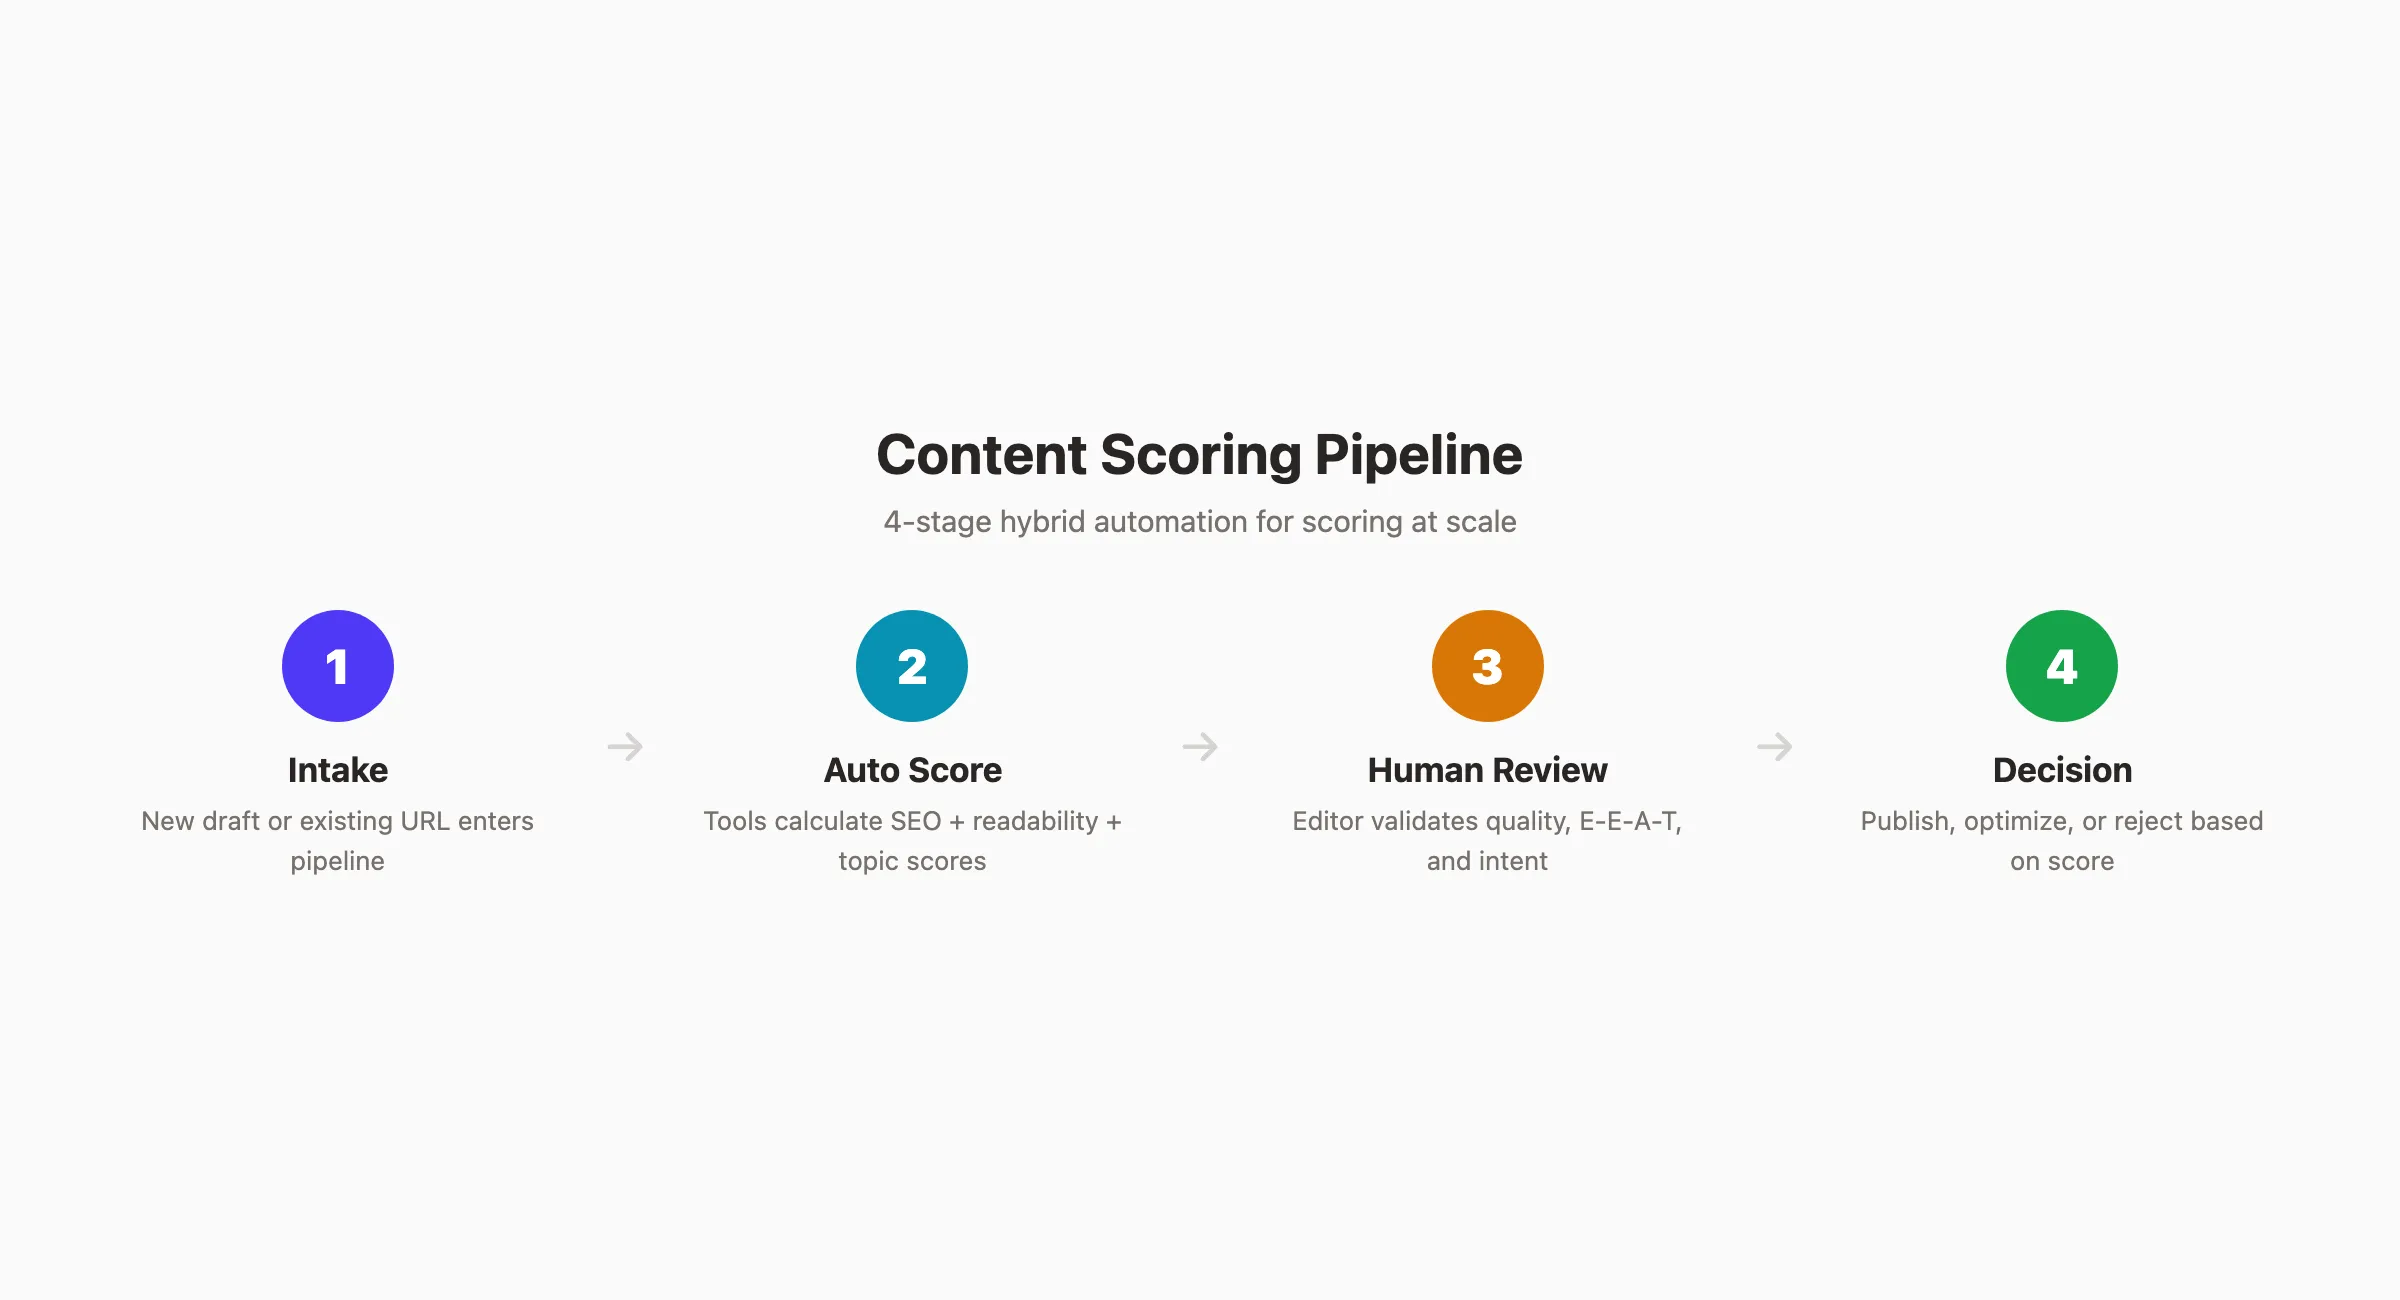
Building a Scoring Pipeline
A content scoring pipeline has 4 stages:
- Intake: Content enters the pipeline (new draft or existing page)
- Automated scoring: Tools calculate SEO, readability, and topical scores
- Human review: Editor validates quality, E-E-A-T, and intent alignment
- Decision: Publish, optimize, or reject based on composite score
Fully automated scoring misses nuance. Fully manual scoring does not scale. The hybrid pipeline handles both.
Using APIs for Batch Scoring
Surfer SEO, MarketMuse, and Semrush all offer API access. Connect these APIs to your content management system to score pages automatically.
A typical API workflow:
- Export all published URLs from your CMS
- Send each URL to the scoring API with its target keyword
- Receive scores and store them in your database
- Flag pages below your threshold for manual review
This process runs overnight and surfaces optimization opportunities every morning.
Spreadsheet-Based Scoring for Small Teams
Not every team needs API integrations. A Google Sheets scoring system works for teams publishing up to 30 posts per month.
Set up your spreadsheet with these columns:
| URL | Target Keyword | SEO Score | Readability | Internal Links | Freshness | Composite | Action |
|---|---|---|---|---|---|---|---|
| /blog/example | example keyword | 72 | 65 | 3 | Current | 68 | Optimize |
Update scores monthly. Sort by composite score to identify priorities.
Scaling With Content Services
The fastest way to automate content scoring at scale is to use a service that builds scoring into the production workflow. Instead of scoring after writing, the score becomes part of the writing process.
At Stacc, every article passes through automated keyword optimization, readability checks, and topical depth analysis before a human editor reviews it. The result: 30 SEO-optimized posts per month at a consistent quality standard.
Content scoring built into every article. Stacc writes, scores, and publishes 30 posts per month. No extra tools needed. Start for $1 →
Chapter 9: Common Content Scoring Mistakes {#ch9}
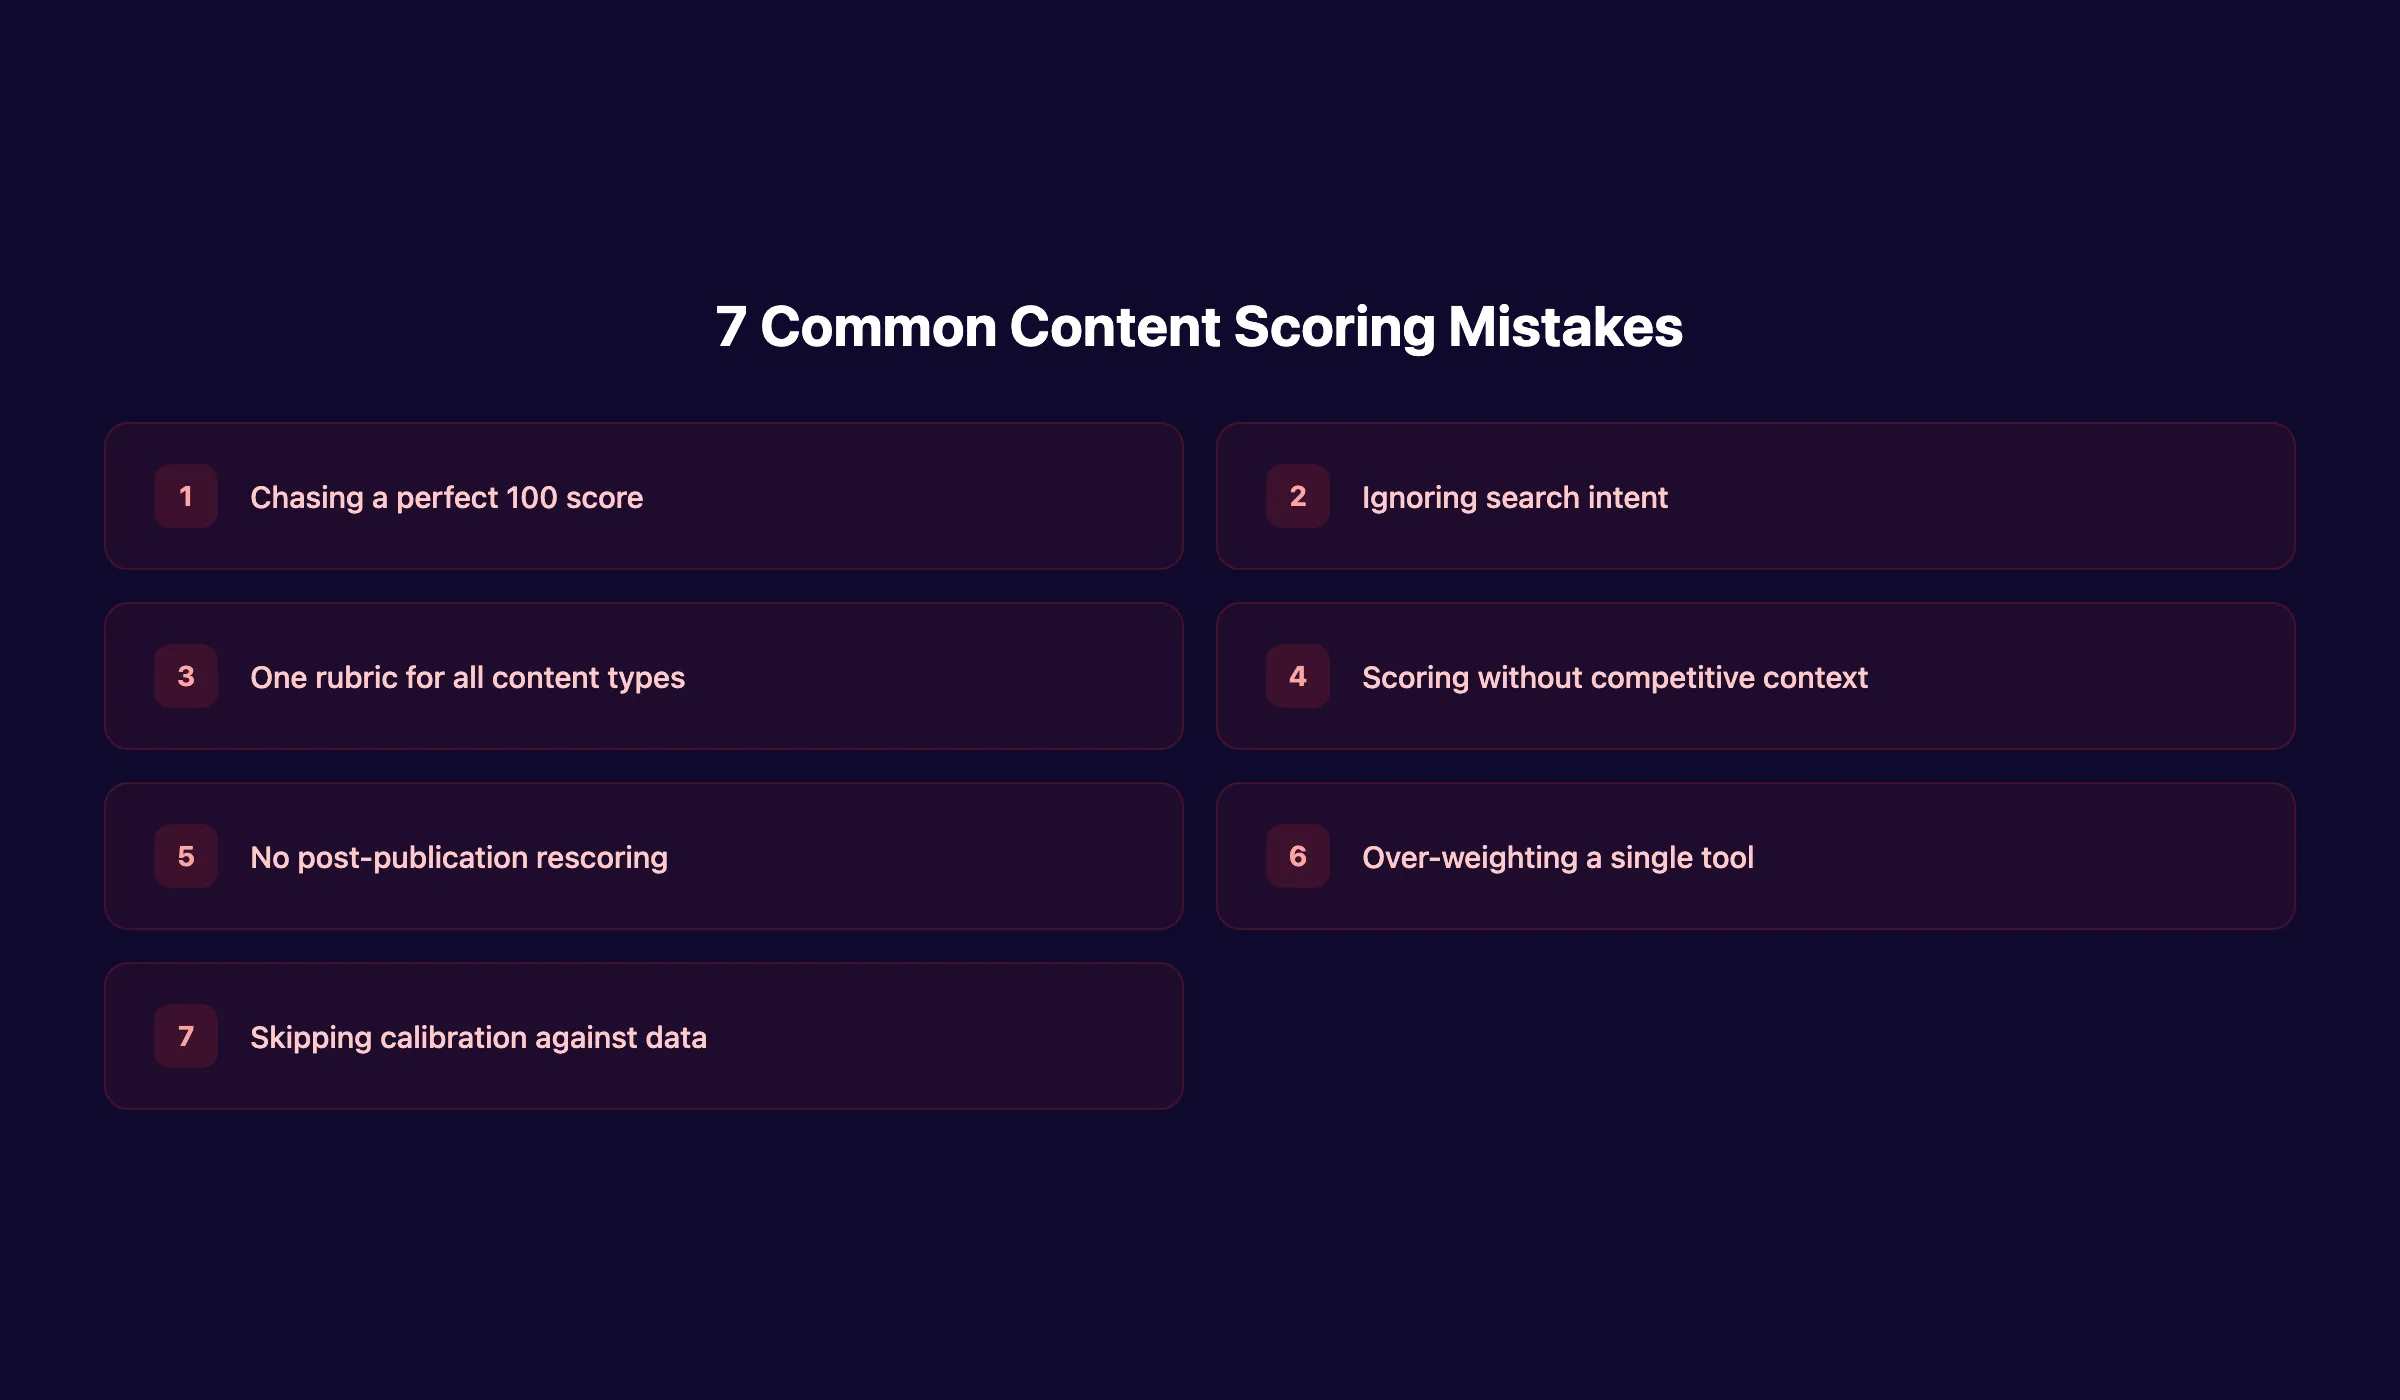
Content scoring improves outcomes when applied correctly. But misapplication creates new problems. These are the 7 mistakes that undermine scoring efforts.
Chasing a Perfect Score
A content score of 100 is not the goal. Over-optimization leads to keyword stuffing, unnatural language, and content that reads like it was written for algorithms instead of humans.
Target the competitive baseline, not perfection. If the top 5 results for your keyword average a Surfer score of 78, aim for 80–85. Going beyond 90 rarely improves rankings and often hurts readability.
Ignoring Search Intent
A perfectly optimized page that answers the wrong question will not rank. Search intent must be the foundation of every scoring framework.
Before scoring for keyword optimization, verify that your content matches the intent type:
- Informational: The searcher wants to learn
- Commercial: The searcher wants to compare
- Transactional: The searcher wants to buy
- Navigational: The searcher wants to find a specific page
A how-to guide targeting a transactional keyword will score well on optimization metrics but fail in the SERPs.
Using One Score for All Content Types
A product landing page and a 4,000-word guide need different scoring criteria. A single framework applied to all content types produces misleading scores.
Create separate rubrics for:
- Blog posts and guides
- Landing pages
- Product pages
- Knowledge base articles
- Content briefs
Each rubric should reflect the unique purpose and success metrics of that content type.
Scoring Without Context
A page about a niche B2B topic might score 65 against a general scoring model. But if every competitor scores 55 or below, that 65 is actually excellent. Scoring requires competitive context.
Always compare your scores against the SERP average for your target keyword. A “low” absolute score might be a winning relative score.
Neglecting Post-Publication Scoring
Many teams score content once (before publishing) and never revisit it. This is a critical mistake. Content performance changes over time.
Set up quarterly rescoring for all published pages. Identify content decay before it becomes a traffic cliff.
Over-Weighting Tool Scores
Surfer SEO and Clearscope are useful tools. They are not oracles. Their scores address one stage of Google’s ranking pipeline. Backlinks, domain authority, and technical SEO matter just as much.
Use tool scores as one input in your composite framework. Never let a single tool’s number be your sole decision-making criterion.
Skipping Calibration
A scoring framework that has never been validated against real performance data is just a guess. Calibrate your framework by comparing scores against traffic and ranking outcomes.
Run this calibration quarterly. Adjust weights when correlations weaken.
FAQ: Content Scoring {#faq}
What is a good content score?
A score above 70 is generally strong for SEO purposes. Most content optimization tools recommend targeting 80+ for competitive keywords. But the “right” score depends on your niche. Compare your score against the SERP average for your target keyword, not against an arbitrary universal benchmark.
Do content scores guarantee rankings?
No. A content score measures on-page optimization and content quality. Rankings depend on hundreds of additional factors including backlinks, domain authority, technical SEO, and user behavior signals. A high content score is necessary but not sufficient for ranking. Think of it as passing the first gate in a multi-stage evaluation.
How often should I rescore existing content?
High-traffic pages deserve monthly rescoring. Medium-traffic pages should be rescored quarterly. Low-traffic pages every 6 months. Any page showing a ranking decline should be rescored immediately to identify what changed.
Can I build a content scoring system without paid tools?
Yes. Use free tools like Hemingway Editor for readability, Yoast or Rank Math for basic keyword optimization, and Google Search Console for performance data. Combine these with a manual rubric in a spreadsheet. This approach works well for teams publishing fewer than 10 posts per month.
What is the difference between content score and SEO score?
An SEO score focuses specifically on search engine optimization factors: keyword placement, meta tags, heading structure, and technical elements. A content score is broader. It includes SEO factors plus readability, engagement, E-E-A-T quality, and business alignment. An on-page SEO check covers the SEO portion. A full content score covers everything.
Should I use the same scoring rubric for every piece of content?
No. Different content types serve different purposes. A blog post, a landing page, and a product page each need a unique rubric with different criteria and weights. Using one rubric for all content types produces misleading scores and poor optimization decisions.
Content scoring turns content production from a guessing game into a measurable system. Start with a simple 5-criteria rubric. Score 10 pages. Calibrate against real performance data. Then expand.
The teams that measure content quality consistently are the teams that rank higher on Google and grow organic traffic month after month.
Ready to stop guessing? Stacc publishes 30 scored, optimized articles per month. No writers, no tools, no overhead. Start for $1 →
Related Tools & Resources
Free SEO Tools:
Best Lists:

Written by
Siddharth GangalSiddharth is the founder of theStacc and Arka360, and a graduate of IIT Mandi. He spent years watching great businesses lose organic traffic to competitors who simply published more. So he built a system to fix that. He writes about SEO, content at scale, and the tactics that actually move rankings.
30 SEO blog articles published every month
Keyword-optimized, scheduled, and live on your site. Automatically.
30-day trial · Cancel anytime
theStacc
Stop writing SEO content manually
30 blog articles, 30 GBP posts, and social media content. Published every month. Automatically.
Start Your $1 Trial$1 for 3 days · Cancel anytime