Learn how to create an SEO report template that proves ROI. 10 steps, 12 required sections, free format. Used across 3,500+ blogs. Updated May 2026.
Most SEO reports get skimmed and forgotten. 42.86% of digital marketing clients are unsatisfied with their agency's reports, and the top complaint is data without insights. A 30-page PDF full of charts that nobody reads and nobody understands.
July 2026 operator note: Keep this page citation-ready: dated stats, question-style H2s, FAQ answers, and clear entities so Google AI Overviews, ChatGPT, Perplexity, and Grok can reuse it.
The cost is brutal. Agencies that send unclear reports lose 3.2x more clients than agencies that follow a structured template. In-house SEO teams without a clean report fail to defend budget at the next quarterly review. Either way, good work goes unrewarded because the proof is buried.
This guide solves that. We will walk through the exact 10-step process to create an SEO report template that actually moves the needle. We publish 3,500+ blogs across 70+ industries and maintain a 92% average SEO score across all of them. The template below is the one we use internally and license to client teams.
Here is what you will learn:
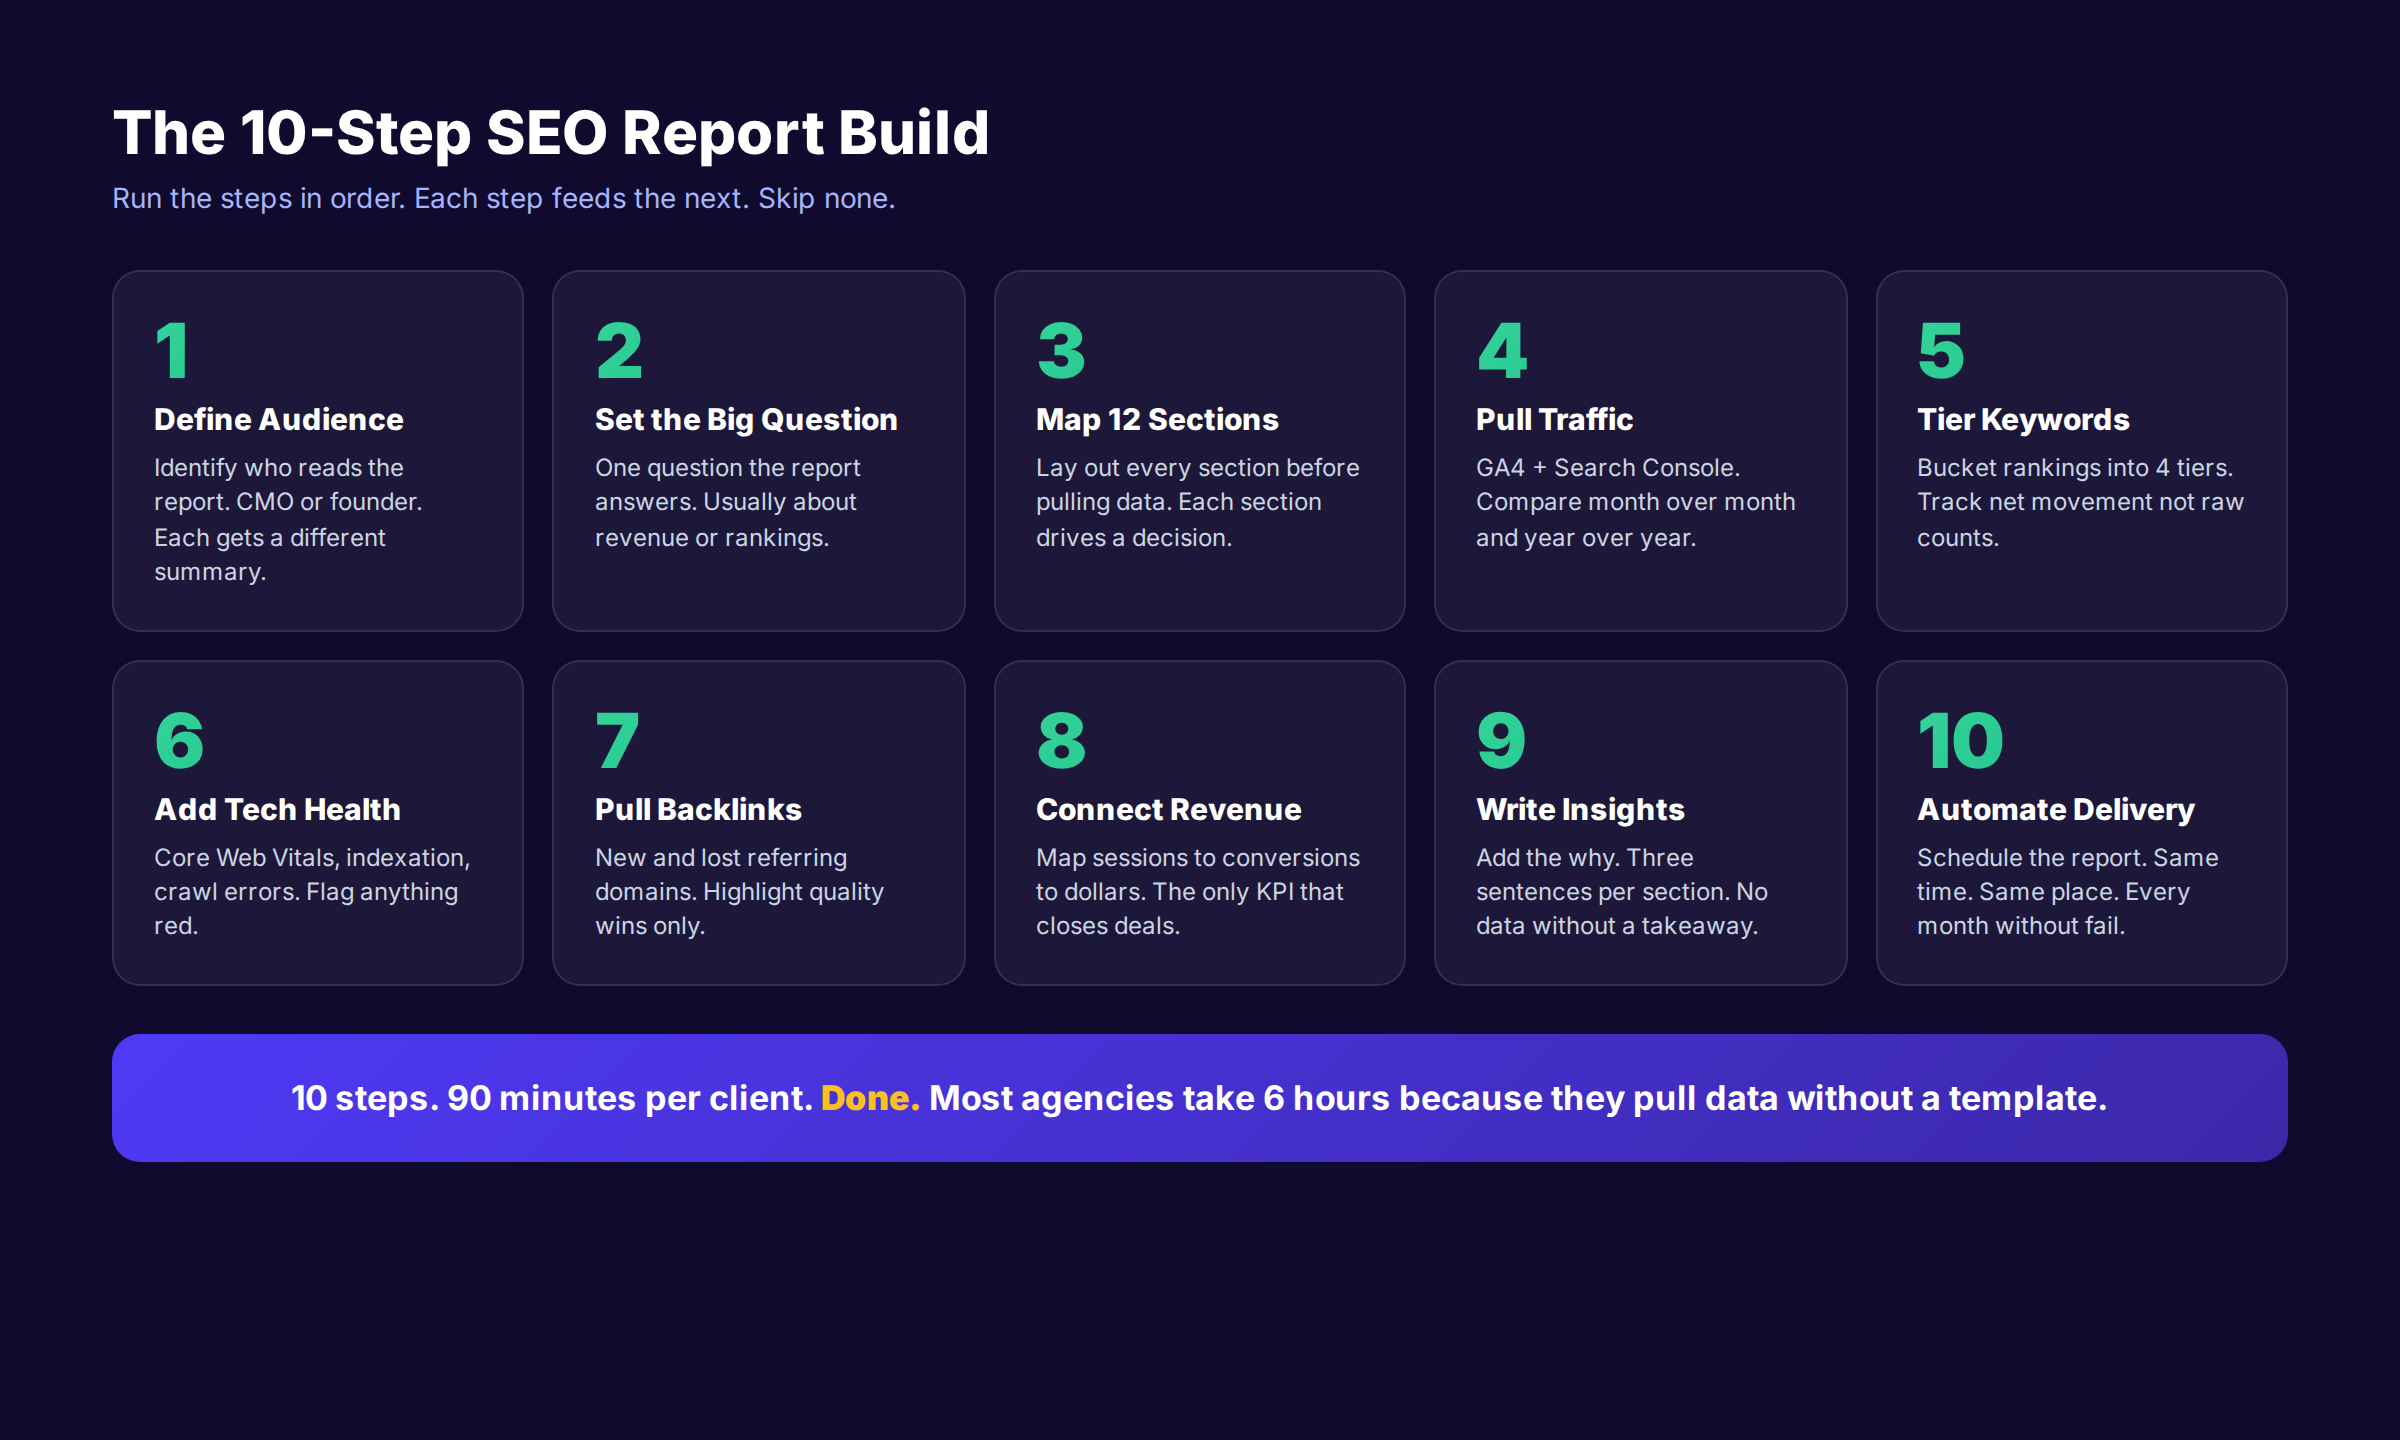
- How to create an SEO report template that takes 90 minutes per client instead of 6 hours
- The 12 required sections every report needs (and the 4 sections that are optional bloat)
- How to structure the executive summary so busy stakeholders read it in under 2 minutes
- The keyword tier system that replaces 500-row ranking tables
- How to connect organic traffic to revenue without an analytics PhD
- The 7 mistakes that kill SEO report templates and how to avoid every one
What You Need Before Starting
Time required: 90 minutes to build the template, 30 minutes per month to populate it
Difficulty: Beginner to Intermediate
What you need:
- Google Search Console (free, required)
- Google Analytics 4 (free, required)
- A keyword tracking tool: Ahrefs, Semrush, or SE Ranking
- Looker Studio, Google Slides, or AgencyAnalytics for the report itself
- Your free SEO audit report for benchmark data
| Tool | Cost | Best For |
|---|---|---|
| Looker Studio | Free | Live dashboards, recurring delivery |
| Google Slides | Free | Executive presentations, narrative-heavy reports |
| AgencyAnalytics | $59+/mo | Agencies with 10+ clients |
| Semrush | $139+/mo | Keyword + backlink + competitor data |
| Ahrefs | $129+/mo | Backlink-heavy reports, link velocity tracking |
Step 1: Define the Reader and the One Question
Every SEO report has exactly one reader. Identify that person before you pull a single data point. A founder wants to see revenue. A CMO wants to see pipeline. A head of content wants to see keyword wins. The same data set produces three different reports.
Write the reader profile at the top of your template. One line. "This report is built for the CMO at a 50-person SaaS company who needs to defend SEO budget at the next board meeting." That sentence shapes every section.
Then define the one question the report answers. Not five questions. One. Examples:
- "Are we earning back our $4,500 monthly SEO investment?"
- "Did we win or lose ground against our top 3 competitors this month?"
- "Are our priority commercial pages climbing toward page 1?"
Why this step matters: Reports without a defined reader become generic. Generic reports get archived without being read. A 4-page report that answers one question is worth more than a 30-page report that answers none.
Pro tip: Ask the client directly. "If you only had time to read one paragraph of this report, what question would it need to answer?" Use their exact answer as the headline of the executive summary.
Step 2: Build the Executive Summary First (Last)
The executive summary lives at the top of the report. You write it last. This sounds contradictory but it is the most important rule of SEO reporting.
Write the summary after you have pulled every data point and noted every insight. Then place it on page 1. Busy stakeholders read the summary in 90 seconds and decide if they need to read the rest. If the summary is weak, the report is dead.
Use a 3-part formula:
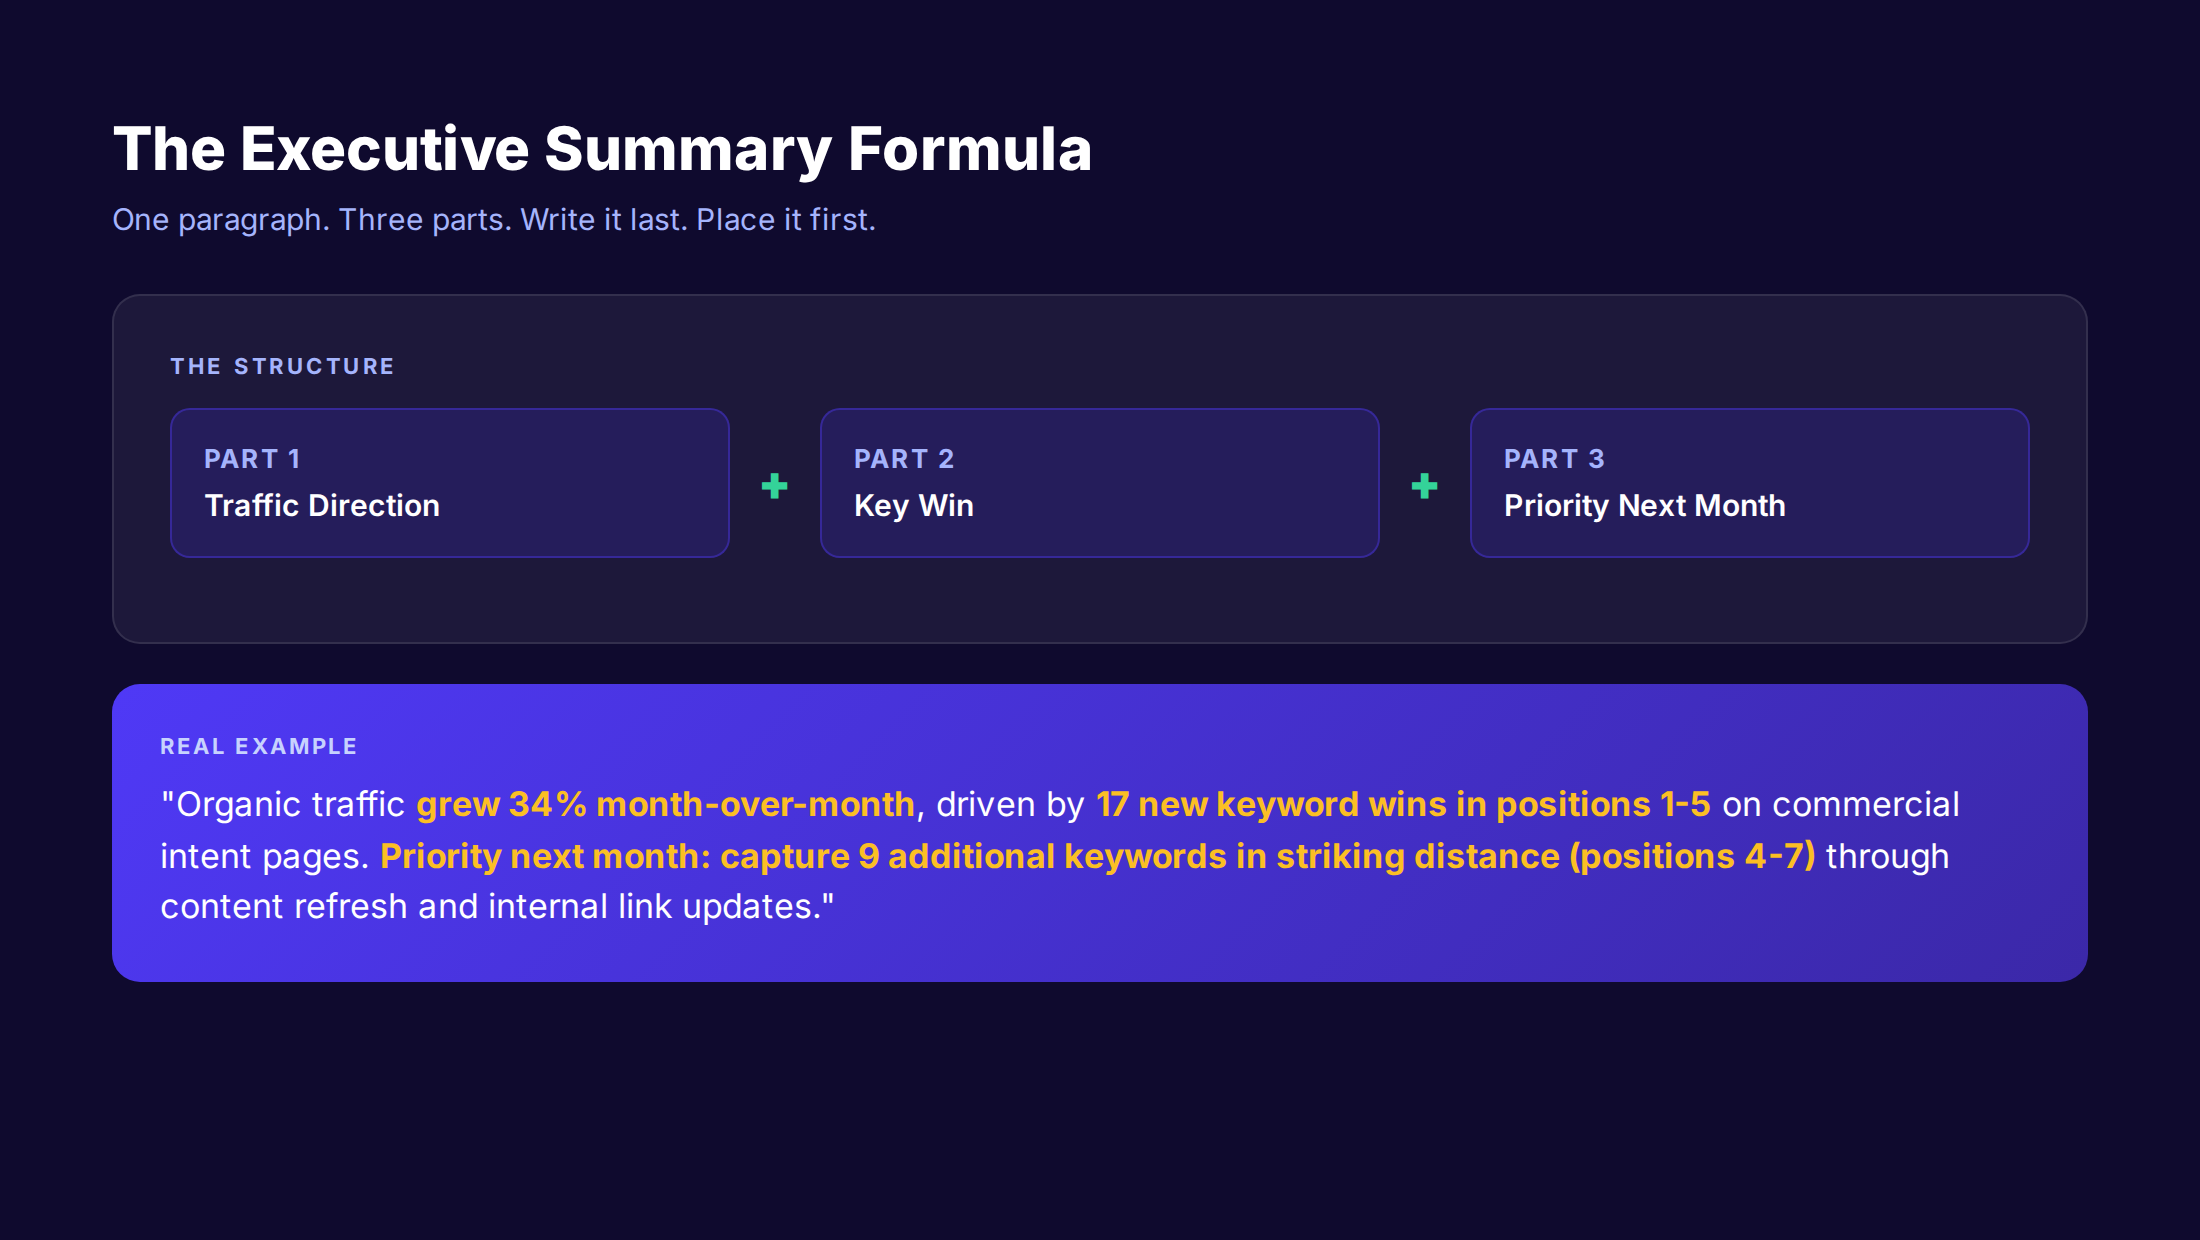
| Part | Content | Length |
|---|---|---|
| Traffic Direction | Up, down, flat with percentage and context | 1 sentence |
| Key Win | The biggest result of the month | 1 sentence |
| Priority Next Month | The one action that drives next month's results | 1-2 sentences |
A real example: "Organic traffic grew 34% month-over-month, driven by 17 new keyword wins in positions 1-5 on commercial intent pages. The biggest win was a 312% click increase on our 'best email marketing software' page after we added comparison tables. Priority next month is to capture 9 additional keywords in striking distance (positions 4-7) through content refresh and internal link updates."
That paragraph tells the whole story. The reader could stop there and still walk away informed.
Common mistakes:
- ✓ Writing the summary first based on what you hope to find
- ✓ Including 6+ metrics in the summary
- ✓ Burying the priority action in the conclusion
- ✓ Using passive voice ("traffic was grown" instead of "traffic grew")
Why this step matters: 83% of executives admit they only read the executive summary of any report longer than 5 pages. The summary is the whole product for most readers.
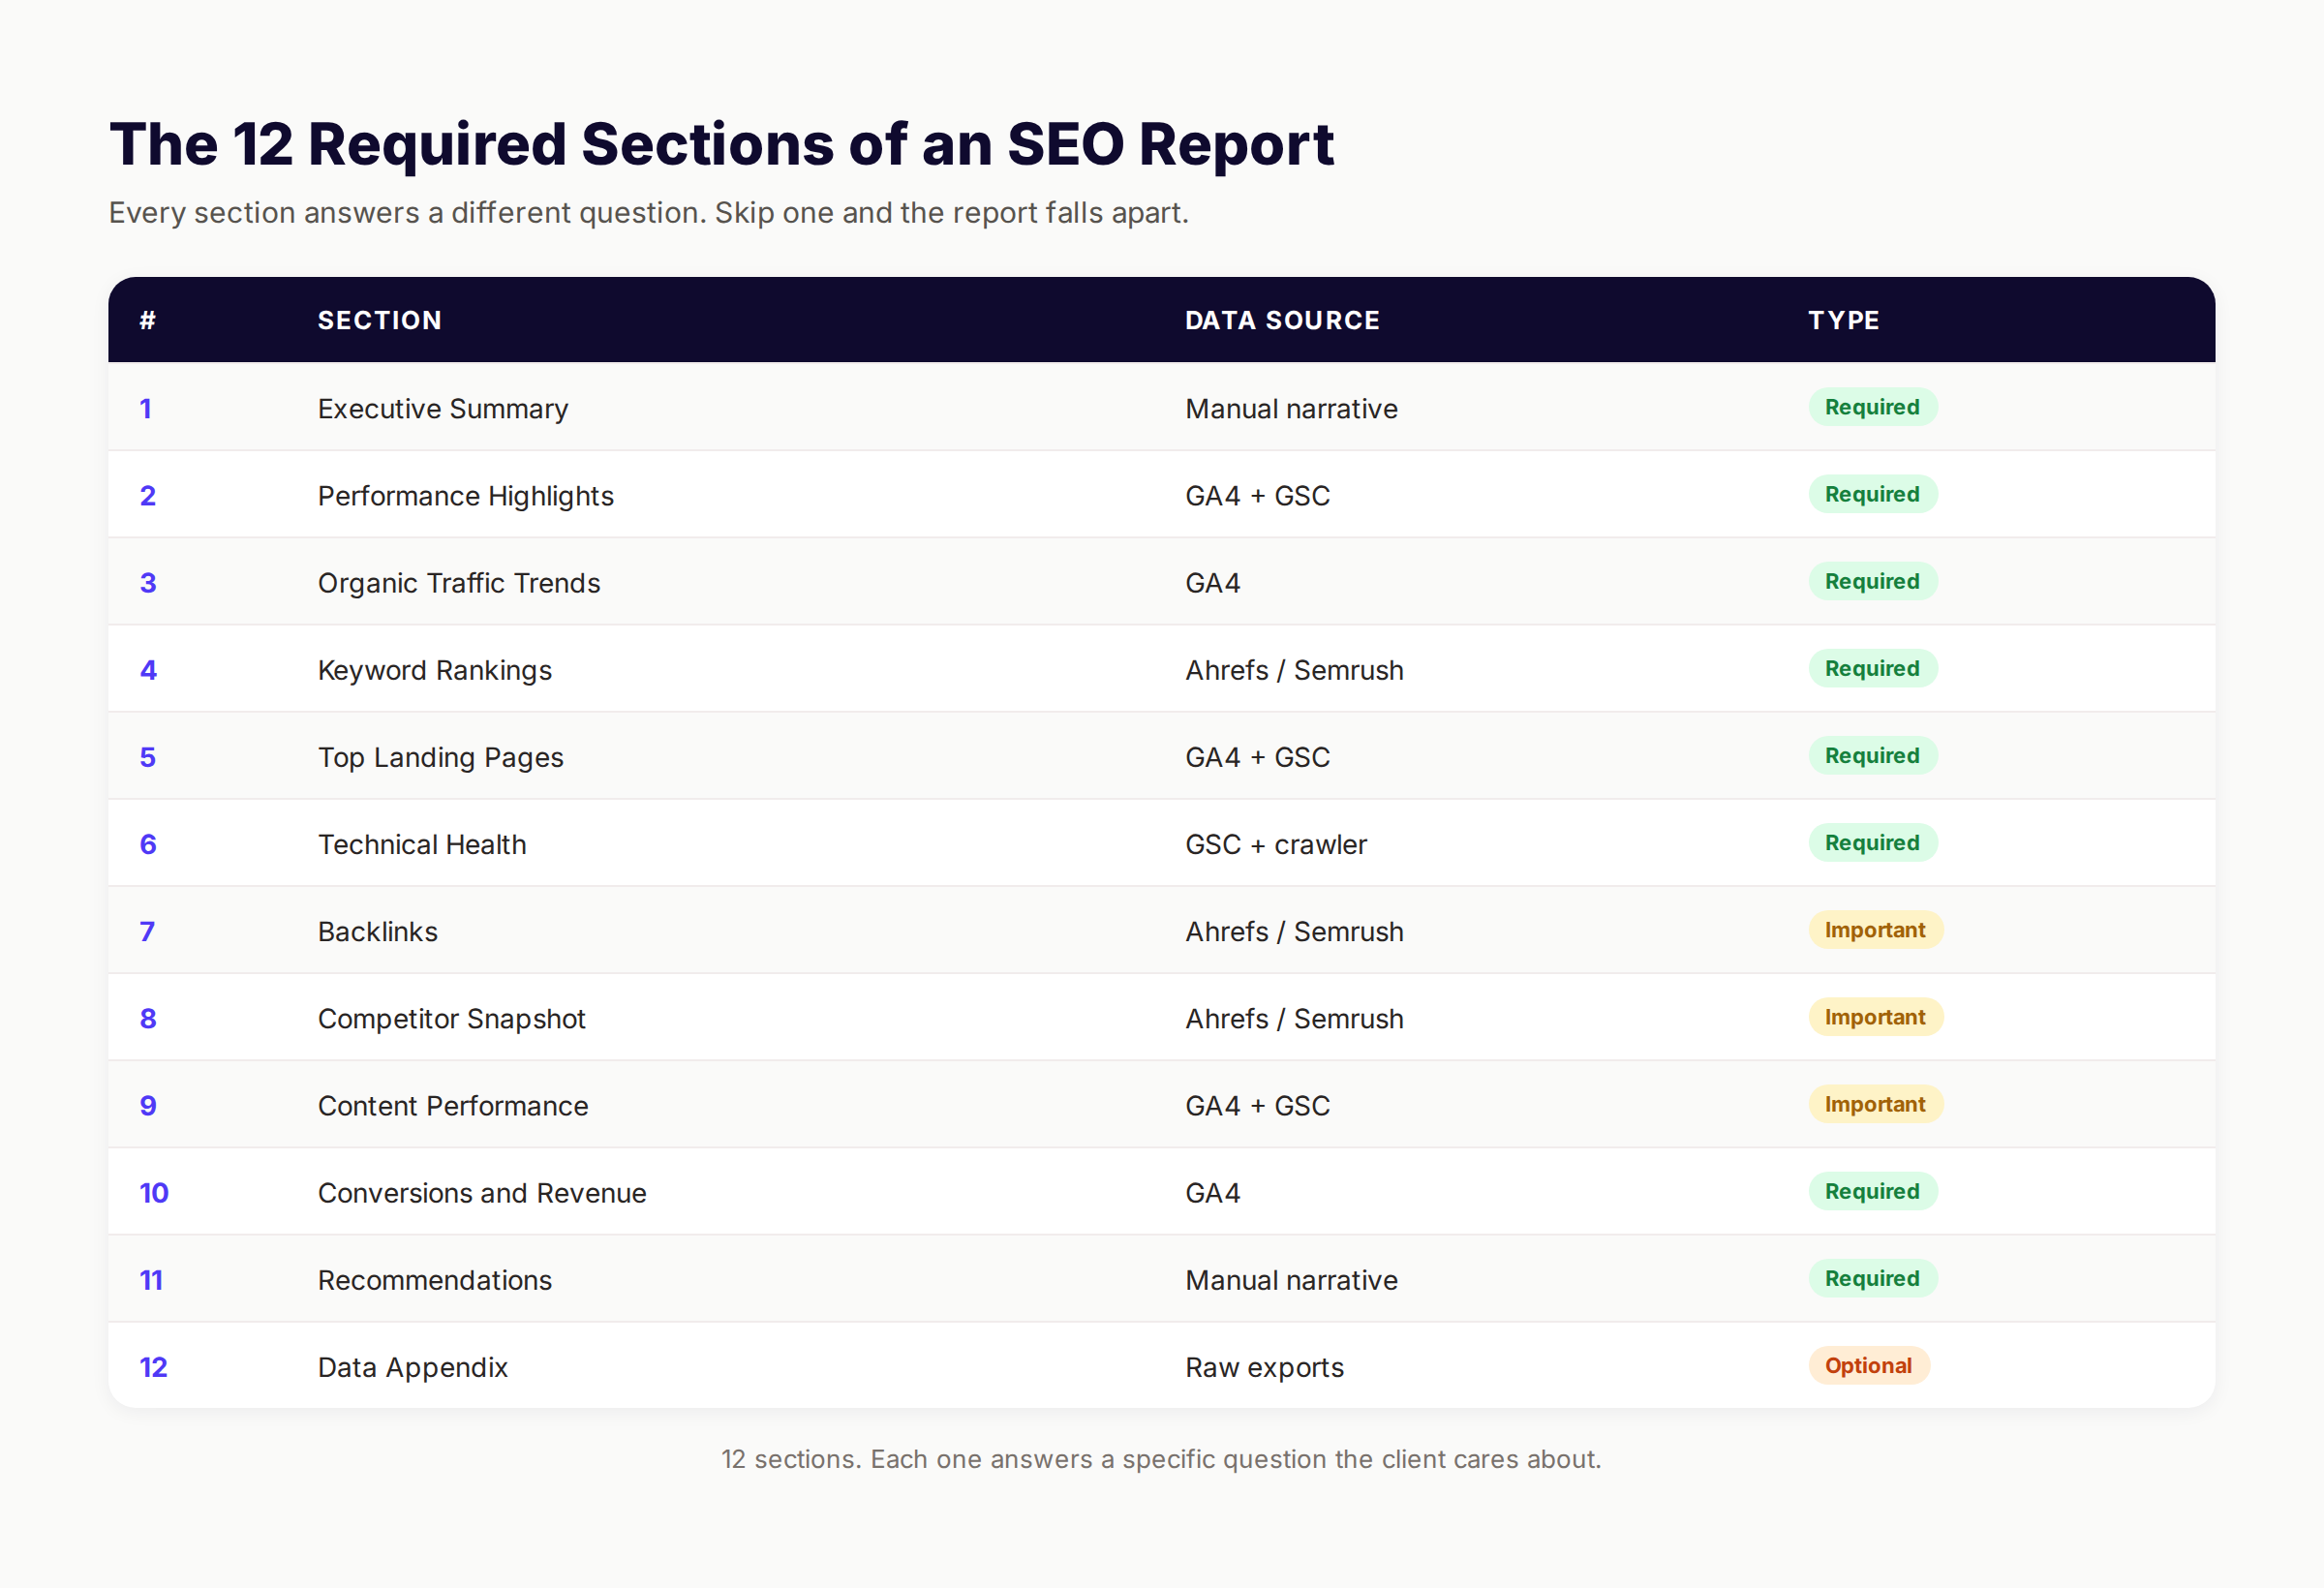
Step 3: Map the Core Sections (12 Required Blocks)
A complete SEO report has 12 sections. No more. No less. Add more and stakeholders skim. Remove any and the report fails to answer the underlying question.
The 12 sections in order:
| # | Section | Purpose |
|---|---|---|
| 1 | Executive Summary | The TL;DR for busy readers |
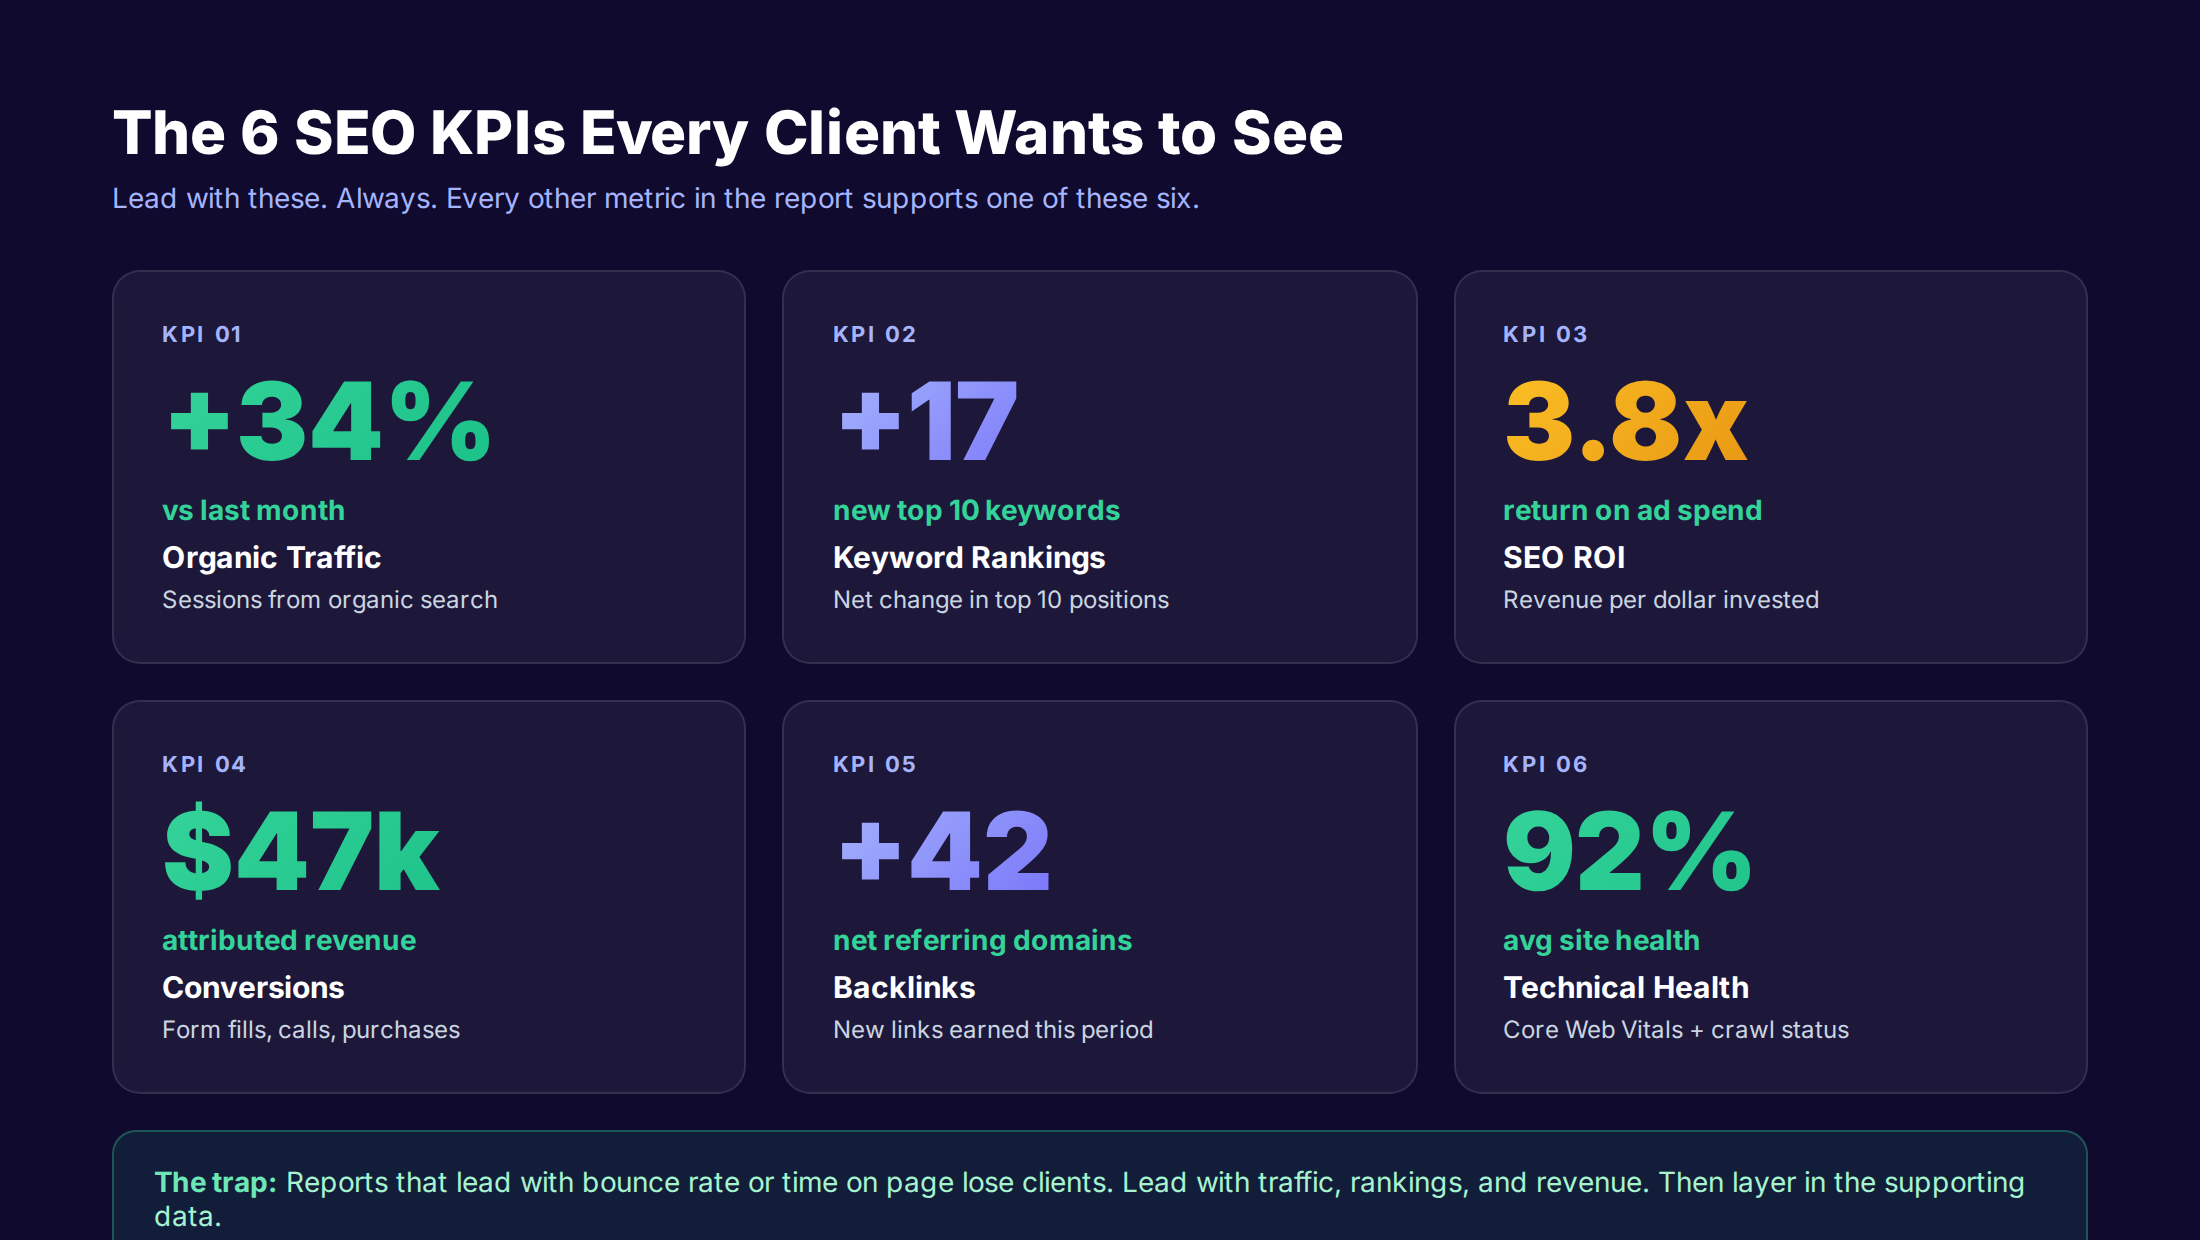
| 2 | Performance Highlights | The 6 lead KPIs as cards |
| 3 | Organic Traffic Trends | Sessions, users, MoM and YoY change |
| 4 | Keyword Rankings | Tier-based ranking movement |
| 5 | Top Landing Pages | Highest-traffic pages with insights |
| 6 | Technical Health | Core Web Vitals, indexation, errors |
| 7 | Backlinks | New, lost, anchor distribution |
| 8 | Competitor Snapshot | Traffic and ranking comparison |
| 9 | Content Performance | New content output and impact |
| 10 | Conversions and Revenue | Forms, calls, purchases attributed to organic |
| 11 | Recommendations | 3-5 priorities for next month |
| 12 | Data Appendix | Raw exports for the data nerds |
Section 12 is the only optional one. Add it if your client has an analyst on the team. Skip it if they do not. Everything else is required.
The mapping rule: Lay out all 12 section headers in your template before you pull any data. Then fill each section in order. Skipping ahead leads to "data first, narrative later" reporting, which is what produces the unreadable 30-page PDFs.
For agencies running content marketing campaigns, the recommendations section is where retainer renewals are won or lost. Spend extra time there.
Step 4: Pull Traffic Data from GA4 and Search Console
Organic traffic is the foundation of the report. Pull it from two sources: Google Analytics 4 for session and user data, Google Search Console for impressions and clicks. The two tools count differently, so include both.
From GA4, pull these metrics:
- ✓ Sessions from organic search (MoM, YoY)
- ✓ Users from organic search (MoM, YoY)
- ✓ Average engagement time
- ✓ Engaged sessions
- ✓ Sessions by landing page (top 20)
- ✓ Sessions by device type
- ✓ Sessions by geographic location (top 10 markets)
From Search Console, pull these metrics:
- ✓ Total clicks (MoM, YoY)
- ✓ Total impressions (MoM, YoY)
- ✓ Average click-through rate
- ✓ Average position
- ✓ Top 50 queries by click volume
- ✓ Top 20 pages by click volume
Compare every metric two ways: month-over-month and year-over-year. Month-over-month catches recent wins and losses. Year-over-year removes seasonality. Pages like ecommerce stores will show a 4x traffic spike in November every year regardless of SEO work. Year-over-year strips that noise out.
Stop wrestling with manual SEO reports. We publish optimized content automatically, handle internal linking, and maintain SEO scores across every page. Your reports get easier because the work gets done.
Common pitfalls when pulling traffic:
- Using "Sessions" when the client wants "Users"
- Forgetting to filter for organic traffic only
- Not segmenting branded vs non-branded queries
- Comparing 4 weeks to 5 weeks (always normalize the date range)
For more on setting up traffic tracking correctly, read our guide on Google Analytics 4 setup.
Why this step matters: Traffic is the most trusted SEO metric. If your traffic data is wrong, the client will catch it and lose faith in every other number in the report. Verify the data source, verify the date range, verify the filters.
Step 5: Add Keyword Ranking Tiers
Most SEO reports list 200 to 500 keyword positions in a giant table. Nobody reads it. The trick is to bucket keywords into 4 tiers and report on movement between tiers, not absolute positions.
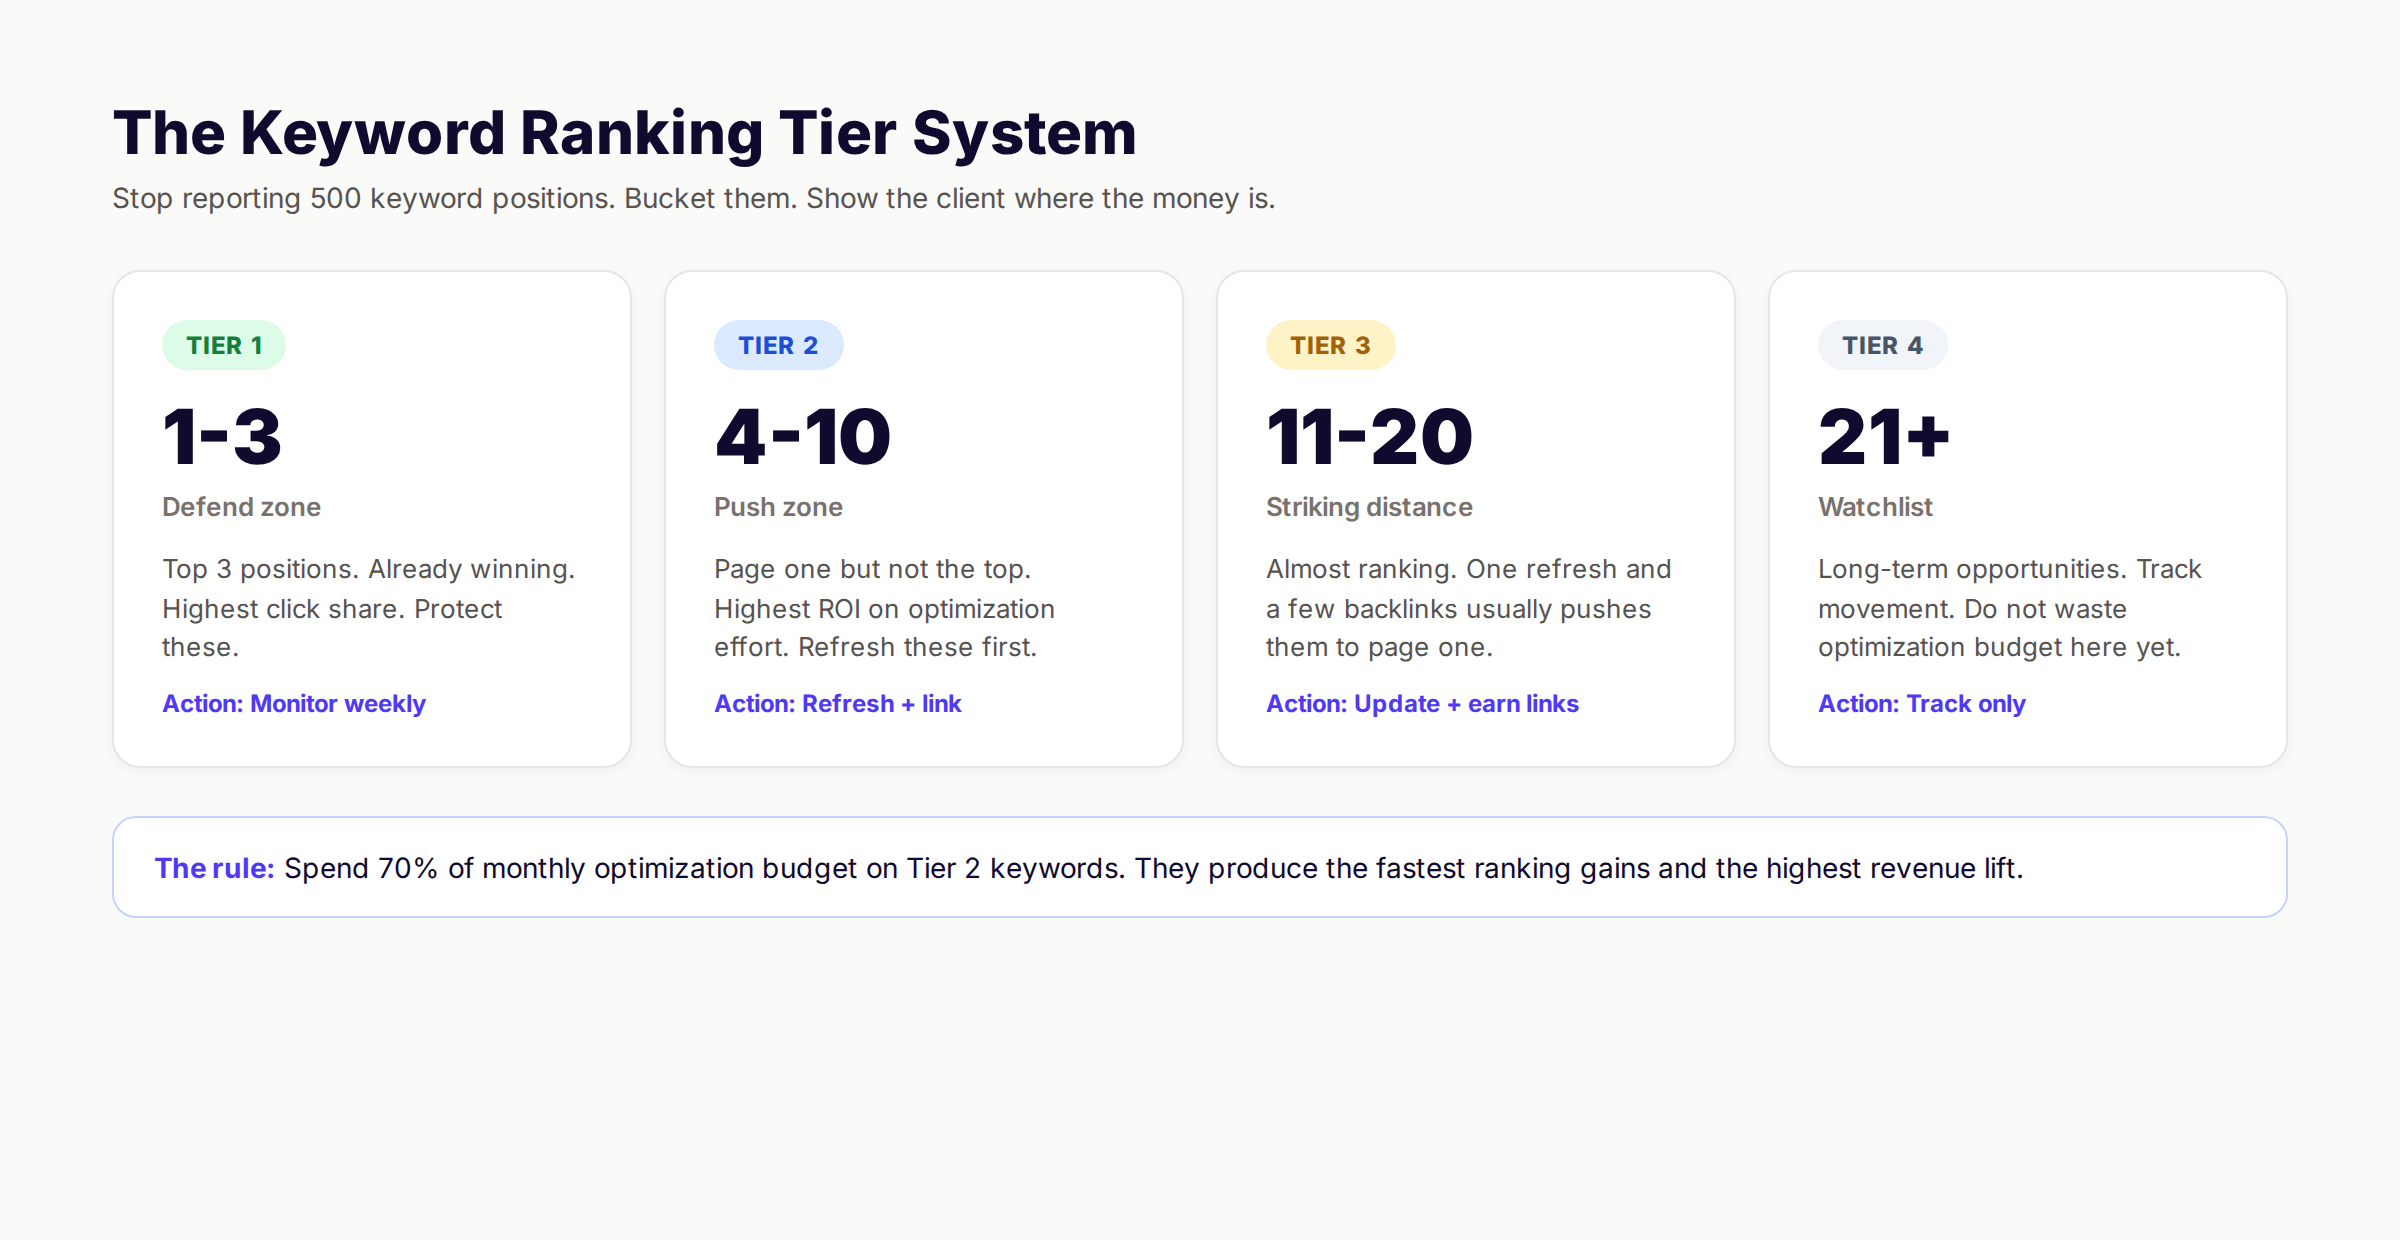
| Tier | Position Range | Strategic Action | Budget Share |
|---|---|---|---|
| Tier 1 | 1-3 | Defend with refresh cycle | 15% |
| Tier 2 | 4-10 | Push to top 3 via content refresh | 50% |
| Tier 3 | 11-20 | Strike with full update + backlinks | 25% |
| Tier 4 | 21+ | Watchlist, no action yet | 10% |
Report on net movement, not absolute count. Example narrative for a monthly report:
"This month we moved 17 keywords from Tier 2 to Tier 1, gained 23 new Tier 2 keywords, and lost 4 Tier 1 positions to competitor refreshes. Net top-3 position gain: +13. Net top-10 gain: +36."
That single paragraph replaces a 500-row keyword table.
For Tier 2 keywords, also report Striking Distance opportunities. These are the keywords ranking in positions 4-10 that have the highest revenue potential. They are the single best ROI bet in SEO. A typical refresh on a Tier 2 page produces a 41% click increase within 90 days.
Pull striking distance keywords from Search Console:
- Open the Performance report
- Filter for queries with impressions above 100/month
- Filter for average position between 4 and 10
- Sort by impressions descending
- Take the top 10 as the focus for next month
For more on identifying ranking opportunities, see our keyword research guide and keyword optimization guide.
Why this step matters: Keyword position tables are the most-skipped section of any SEO report. Tier-based reporting forces the writer to think about strategy, not just data dumps.
Step 6: Layer in Technical Health Metrics
Technical health is the section that catches problems before they become catastrophes. Most clients never see this data unless something breaks. Surface it monthly so they trust the foundation.
Pull these technical metrics:
- ✓ Core Web Vitals pass rate (LCP, INP, CLS)
- ✓ Indexed pages vs total pages
- ✓ Pages with crawl errors (404, 5xx)
- ✓ Mobile usability errors
- ✓ HTTPS coverage
- ✓ Sitemap submission status
- ✓ Average page load time (mobile and desktop)
- ✓ Schema markup coverage on key pages
Display these as a single health card. Green if all metrics pass. Yellow if 1-2 fail. Red if 3+ fail. The client does not need to see every number. They need to see the color.
If you do find issues, link to remediation actions:
| Issue | Owner | Fix Timeline |
|---|---|---|
| 14 pages with LCP over 4s | Dev team | Sprint 23 |
| Sitemap missing 32 new product pages | Marketing ops | This week |
| 7 broken internal links | Content team | Today |
| INP failing on mobile checkout | Dev team | Next sprint |
For deeper technical audits, see our technical SEO checklist and SEO audit guide. For Core Web Vitals fixes specifically, read our guide on how to improve Core Web Vitals.
Why this step matters: Technical issues compound silently. A site with creeping LCP problems loses 7% of conversions for every additional second of load time according to Google's research on mobile speed. Catch the trend early and fix the issue before it shows up in the traffic numbers.
Step 7: Include Backlinks and Competitive Data
Backlinks belong in every SEO report, but most reports drown in vanity link counts. Skip "total backlinks." Report on referring domains and link quality instead.
Backlink metrics to report:
- ✓ Net change in referring domains (gained minus lost)
- ✓ Top 5 new high-quality links earned
- ✓ Top 5 lost links and why
- ✓ Anchor text distribution (branded, exact match, generic)
- ✓ Domain Rating or Domain Authority trend
- ✓ Toxic link count (if any)
The "Top 5 new links" callout is gold. Show the linking domain, the page that earned the link, and the anchor text. Clients love seeing real publisher names earning links to their content.
For competitive data, keep it simple. Show your traffic versus the top 3 competitors as a single line chart. Add a one-sentence narrative.
| Competitor | Estimated Organic Traffic | Trend |
|---|---|---|
| Your Brand | 47,200 sessions | +34% MoM |
| Competitor A | 89,100 sessions | +12% MoM |
| Competitor B | 38,400 sessions | -8% MoM |
| Competitor C | 22,900 sessions | +21% MoM |
That table tells a clear story. Competitor B is slipping. You are gaining ground. Competitor A is still ahead but growing slower than you. The competitive narrative writes itself.
For more on competitor analysis methodology, see our guide on SEO competitor analysis. For building links specifically for blog content, read our build backlinks for blog guide.
Why this step matters: Backlinks remain one of the top 3 Google ranking factors. Tracking them monthly catches link rot early and proves the link-building investment is paying off.
Step 8: Connect SEO to Revenue with Conversion Data
The make-or-break section. This is what closes retainer renewals. Traffic without revenue gets defunded at every budget review. Show the dollars.
Conversion metrics to pull from GA4:
- ✓ Total organic conversions (form fills, calls, purchases)
- ✓ Organic conversion rate vs site average
- ✓ Attributed revenue from organic
- ✓ Average order value or deal size from organic
- ✓ Conversions by landing page (top 10)
- ✓ Conversion funnel drop-off points
- ✓ Cost per acquisition vs paid channels
If the client sells products, pull revenue directly. If the client sells services, pull lead volume and apply the average lead-to-deal conversion rate. Most clients have this number already.
A revenue narrative example:
"Organic search delivered 142 conversions this month, up 27% MoM. Attributed revenue was $58,400 at an average order value of $411. The top converting page was our 'best ai seo tools' guide, which generated 31 conversions worth $12,800. Compared to paid acquisition at $94 per conversion, organic delivered at $32 per conversion — a 2.9x cost efficiency advantage."
That paragraph defends 6 months of SEO budget by itself.
Stop spending hours on monthly reports. We publish 30-80 SEO-optimized articles per month, track every win automatically, and connect content to revenue. Your reports write themselves.
For more on measuring return, see our guide on measuring content marketing ROI and our SEO ROI calculator.
Why this step matters: SEO loses budget battles when it cannot show revenue. Make the dollar number unmissable. Bold it. Box it. Put it on its own page.
Step 9: Write Insights, Not Just Numbers
Every section needs commentary. Three sentences minimum. The data answers "what." The commentary answers "why" and "what next."
The structure for every insight block:
- What happened (1 sentence with the headline number)
- Why it happened (1 sentence with the driver)
- What we do about it next (1 sentence with the action)
Bad insight: "Organic traffic increased 34% this month."
Good insight: "Organic traffic increased 34% this month, driven primarily by 17 new keyword wins on commercial intent pages following the March 12 content refresh. Next month we will apply the same refresh template to the next 9 priority pages in striking distance."
The second version turns data into decision. That is the entire point of an SEO report.
Insight rules:
- No data point without commentary
- No commentary without an action
- No action without an owner
- No owner without a deadline
If a metric does not warrant action, do not include it in the report. Move it to the appendix.
For more on the writing structure of high-converting reports, see our guide on how to write SEO blog posts.
Why this step matters: The difference between a report that gets archived and a report that drives action is commentary. Data is cheap. Insight is the product.
Step 10: Automate Delivery and Cadence
The best SEO report template is useless if it ships late. Set up automation now so future-you does not have to think about it.
Delivery checklist:
- ✓ Calendar invite on a recurring date (the 5th of every month)
- ✓ Looker Studio dashboard set to refresh daily
- ✓ Email template ready with the executive summary in the body (not just attached)
- ✓ PDF export auto-generated and stored in a shared drive
- ✓ Read receipt or analytics tag on the PDF link
Cadence matters more than format. A mediocre report delivered on the same day every month builds more trust than a stunning report delivered randomly. Agencies that ship reports on a fixed date have 3.2x higher retention rates than agencies that ship inconsistently.
| Cadence | When to Use | Format |
|---|---|---|
| Weekly | High-stakes accounts, launch periods | Slack message + dashboard link |
| Monthly | Default for most SEO retainers | Looker Studio + PDF export |
| Quarterly | Executive review, strategy meetings | Slide deck + live presentation |
| Annual | Year-in-review, contract renewal | Custom report + roadmap |
For agency teams managing local SEO retainers, monthly reporting is the standard. Local clients want to see Google Business Profile post performance, review velocity, and local pack rankings.
For content-led campaigns, see our content marketing strategy and content marketing metrics guides.
Why this step matters: Inconsistent reporting is the single most common reason clients churn. Automation removes the human bottleneck.
SEO Report Template Formats Compared
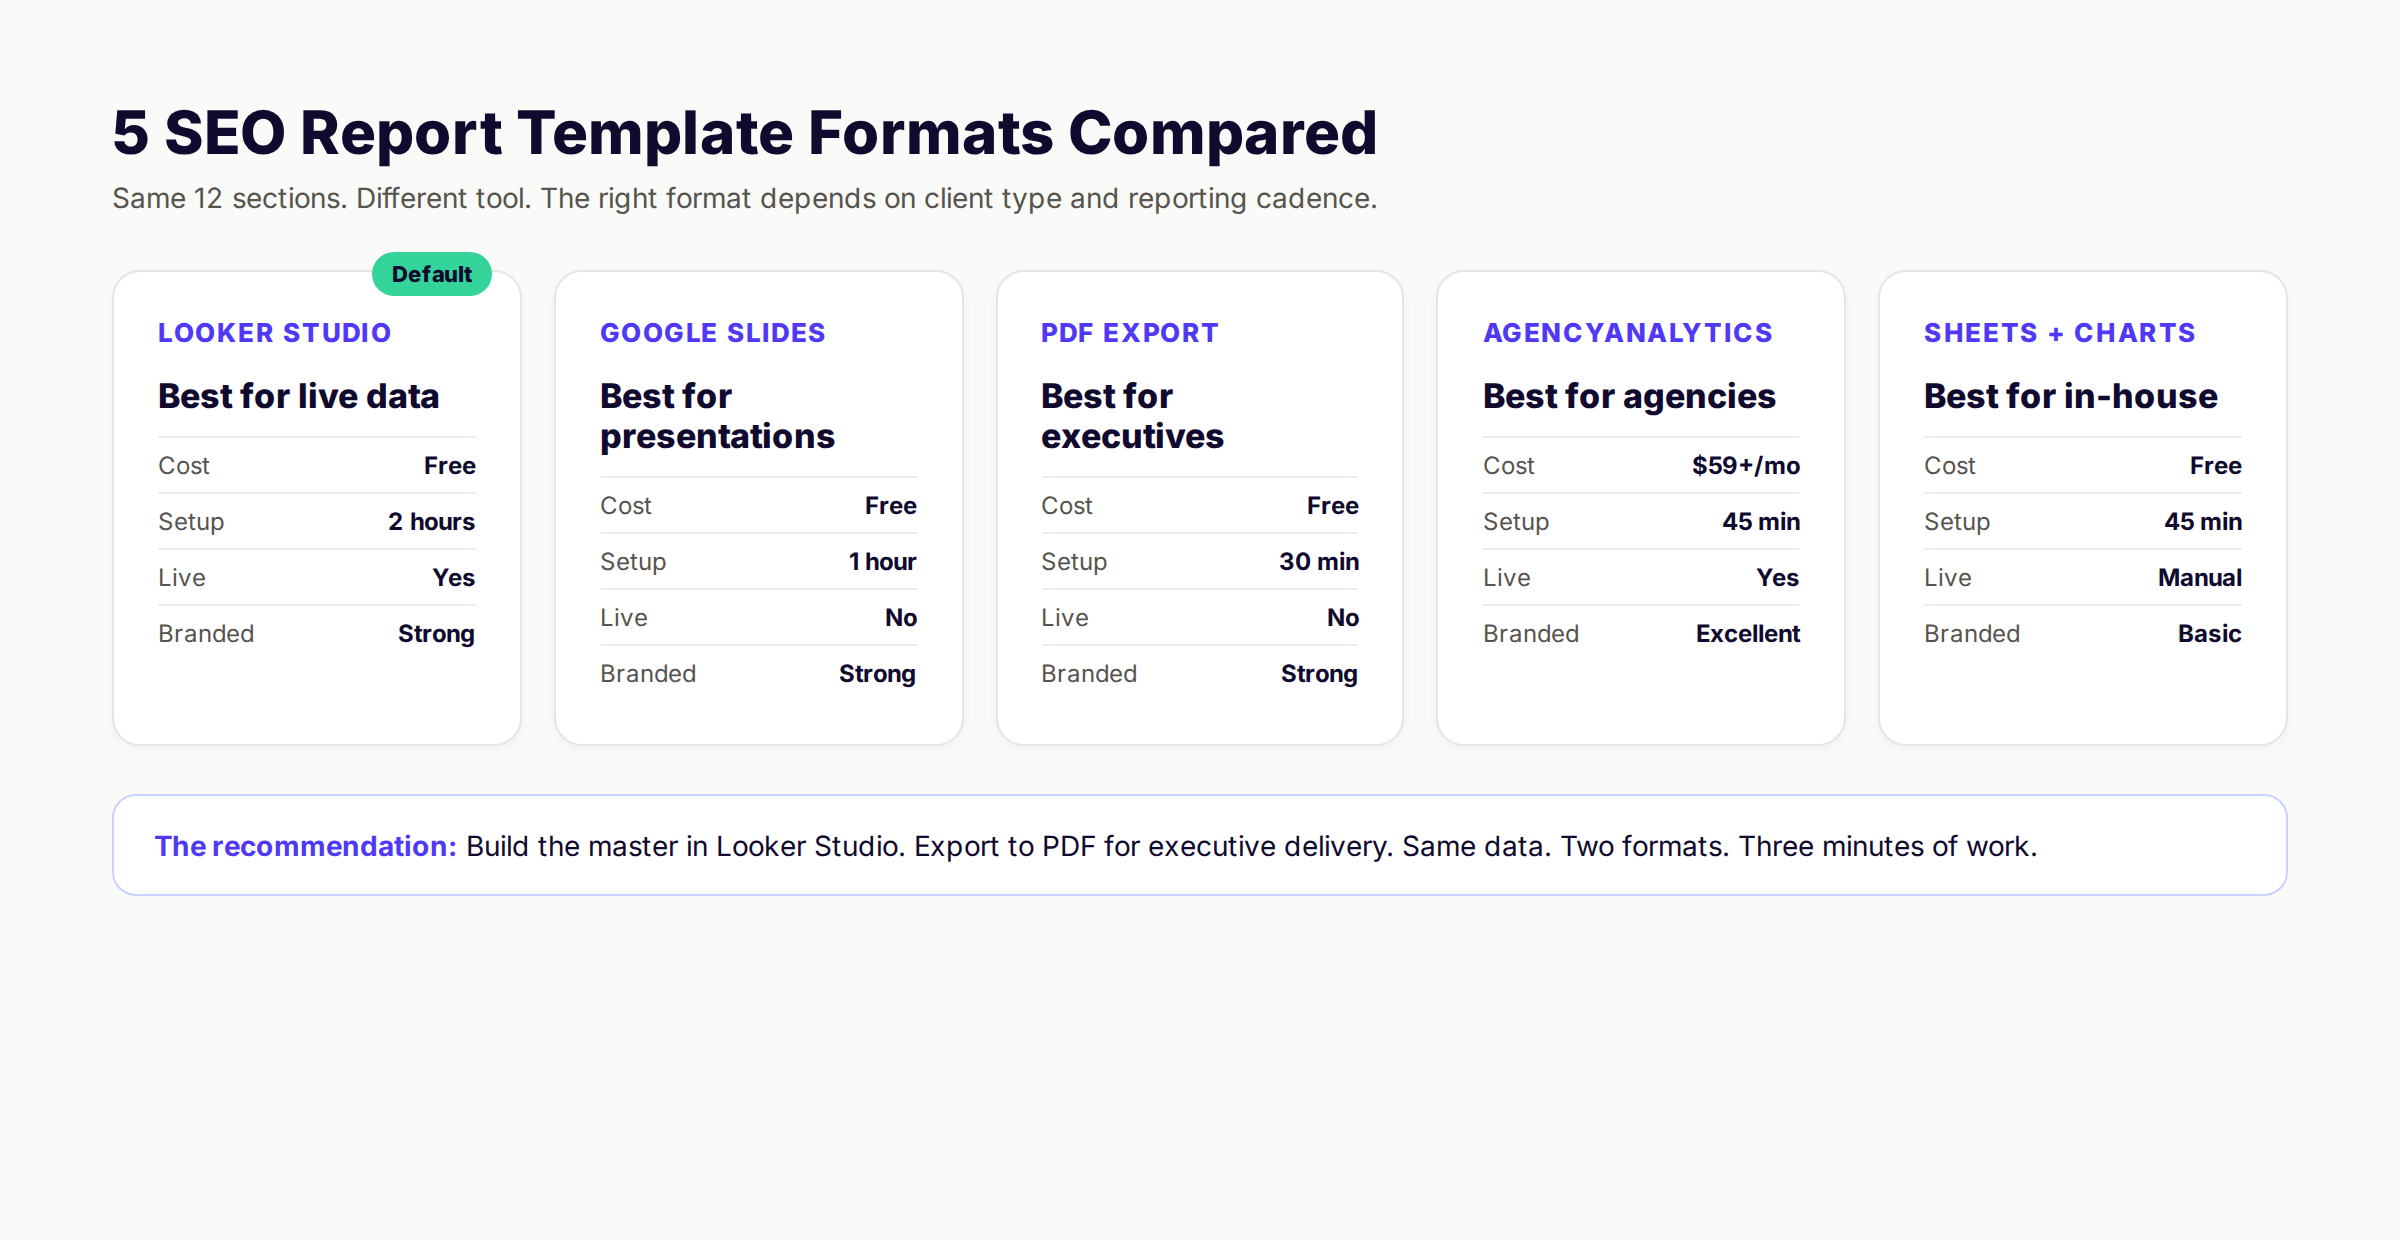
Five formats handle 95% of use cases. The right format depends on the client type, the reporting cadence, and whether the report will be presented live or read async.
| Format | Cost | Setup Time | Live Data | Best For |
|---|---|---|---|---|
| Looker Studio | Free | 2 hours | Yes | Live dashboards, async delivery |
| Google Slides | Free | 1 hour | No | Executive presentations |
| PDF Export | Free | 30 min | No | Executive sign-off, archives |
| AgencyAnalytics | $59+/mo | 45 min | Yes | Agencies with 10+ clients |
| Sheets + Charts | Free | 45 min | Manual | In-house teams on a budget |
The recommendation: Build the master in Looker Studio. The dashboard updates daily so the client can self-serve between meetings. Export to PDF on the 1st of every month for the executive summary version. Same data. Two formats. Three minutes of extra work.
For agencies, AgencyAnalytics or DashThis save 4-6 hours per client per month once you have 10+ accounts. The math stops working below that threshold.
For in-house teams, Sheets + Charts is fine if you have an analyst. Looker Studio is better if you do not.
7 Common SEO Report Template Mistakes
Across 200+ client engagements, the same patterns kill reports. Avoid every one of these.
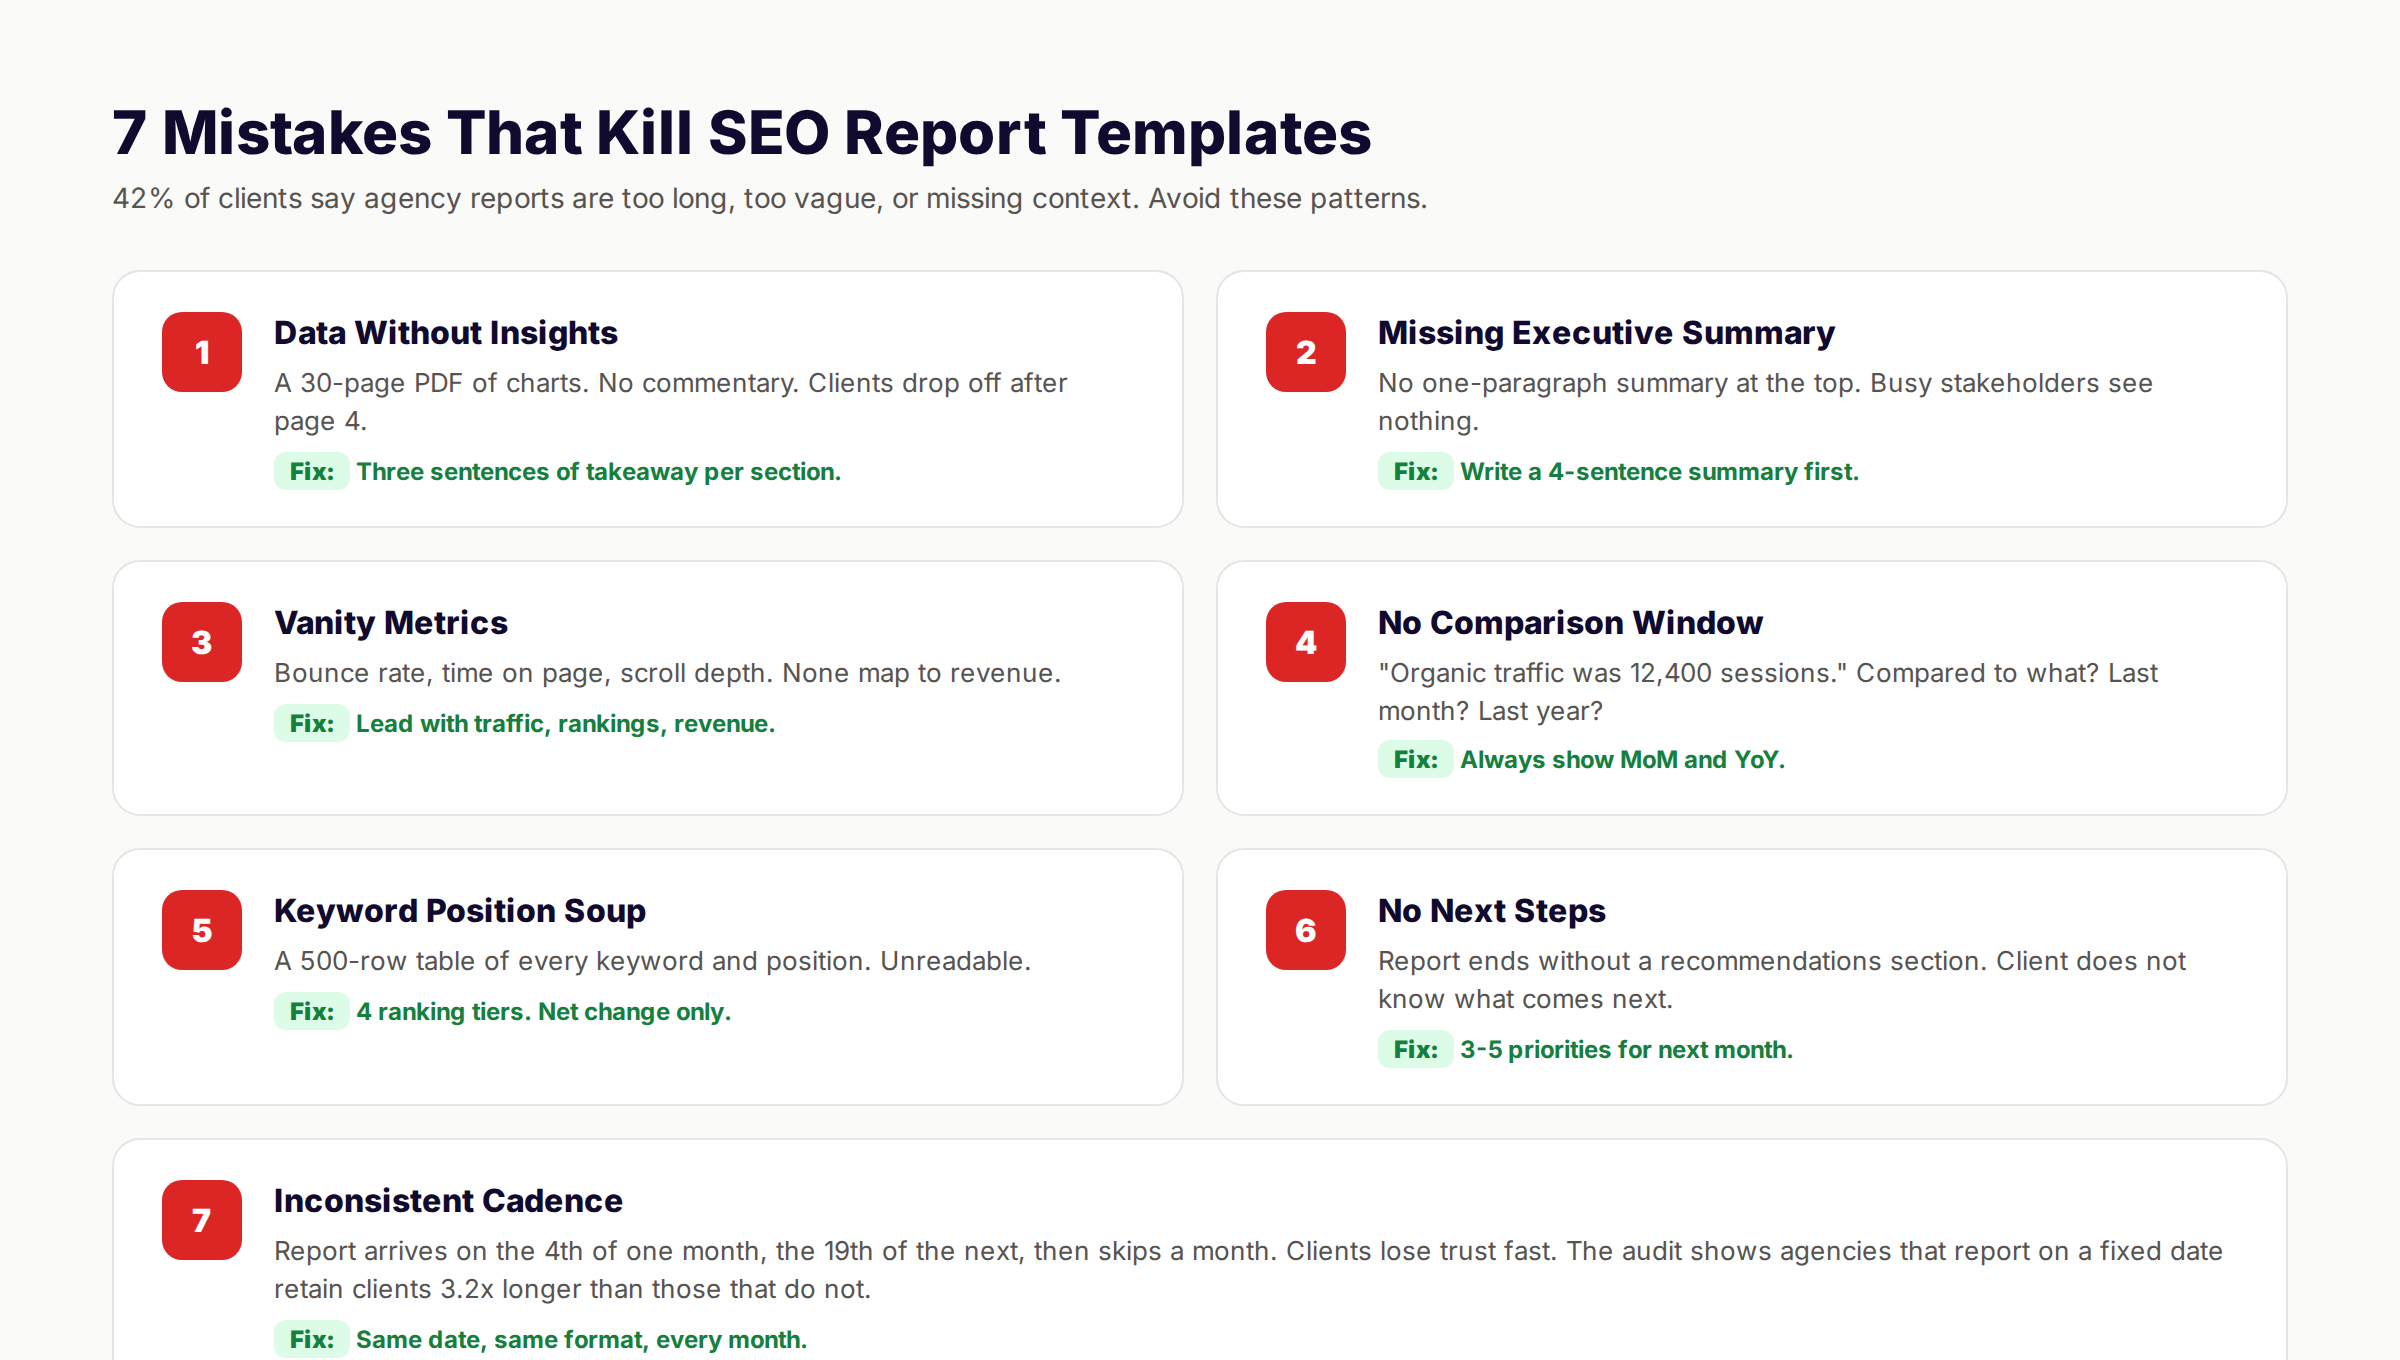
Mistake 1: Data without insights. A 30-page PDF of charts and no commentary. The fix is three sentences of takeaway per section. No exceptions.
Mistake 2: Missing executive summary. No one-paragraph summary at the top of the report. The fix is to write a 4-sentence summary first and place it on page 1.
Mistake 3: Vanity metrics. Bounce rate, time on page, scroll depth. None of these map to revenue. The fix is to lead with traffic, rankings, and revenue every time.
Mistake 4: No comparison window. "Organic traffic was 12,400 sessions." Compared to what? The fix is to always show month-over-month and year-over-year deltas.
Mistake 5: Keyword position soup. A 500-row table of every tracked keyword. Nobody reads it. The fix is the 4-tier system from Step 5.
Mistake 6: No next steps. The report ends without a recommendations section. The fix is to include 3-5 priorities for next month, every month.
Mistake 7: Inconsistent cadence. Reports arrive on the 4th, the 19th, then skip a month. The fix is to ship on the same date every month without exception.
For more on operational consistency, see our guide on the content compound effect.
What practitioners are saying on X
AI search advice ages quickly. Here is high-signal public discussion from SEO and growth operators — context for your roadmap, not a substitute for primary data.
- @hridoyreh (Mar 2026): Widely shared SEO skill tree: foundations, research, technical, on-page, content, links, AI SEO/GEO, analytics, UX, brand, programmatic — useful map for stats and how-to posts. See the post on X.
- @jakezward (Feb 2026): 2026 SEO predictions emphasize AI Overview share-of-SERP, schema for LLM token efficiency, brand mentions in AI answers as a KPI, proprietary data as a moat, and content refresh beating net-new AI slop. See the post on X.
Grok, AI Overviews, and multi-engine visibility
For “how to create seo report”, multi-engine visibility still starts with clear definitions, sourced numbers, and extractable section answers. Grok additionally factors live X discussion — keep public claims consistent with this page.
- Google AI Overviews: Use passage-ready answers, tables, and FAQ schema where relevant.
- ChatGPT / Perplexity: Cite named sources next to key claims.
- Grok: Maintain accurate entity facts on-site and in high-signal X posts.
Publish content built for Google and AI citations. theStacc’s Content SEO module ships SEO-scored articles structured for rankings and generative engines — including clearer entity pages models like Grok can quote.
FAQ: Create SEO Report Template
Aim for 8-12 pages or 6-10 slides. Reports over 15 pages get skimmed. Reports under 5 pages feel underbaked. The 12-section template above hits the sweet spot at roughly 10 pages.
No. Use the 4-tier system. Show net movement between tiers, not every position. A 500-row keyword table is the single most-skipped section of any SEO report.
An SEO report tracks performance over time (usually monthly). An SEO audit is a one-time deep diagnostic that finds problems to fix. Most clients need both: a monthly report plus an annual audit. For the audit version, read our SEO audit checklist.
Add three local-specific sections: Google Business Profile views and actions, local pack rankings for priority keywords, and review velocity. The other 12 sections still apply. For more, see our local SEO checklist.
Looker Studio is free and handles 90% of use cases. AgencyAnalytics or DashThis save 4-6 hours per month once you have 10+ clients. The math favors paid tools at scale, free tools below 10 clients.
Lead with honesty. Name the drop in the executive summary. Explain the cause (algorithm update, lost links, competitor refresh, technical issue). Show the recovery plan. Clients fire agencies that hide bad months, not agencies that explain them.
Mostly yes. Looker Studio handles the data pull. The executive summary and recommendations still need human writing. Plan for 30 minutes of human work per report regardless of how much you automate.
Final Word
A great SEO report template earns trust and defends budget. A bad one buries good work in unreadable charts. The 10 steps above turn the second into the first.
The template itself is portable. Build it once. Reuse it across every client or every internal review. Each report should take 30-90 minutes to populate once the framework is in place. Compared to the 6-hour ad-hoc reports most teams produce, that is a 4x time saving.
Next month, when the report comes due, you will not be starting from scratch. You will be filling in cells. That is the whole point.
Stop spending Sundays on SEO reports. We publish 30-80 optimized blogs per month, handle the internal linking, and feed the data straight to your dashboard. Your reports populate themselves.
Related Tools & Resources
Free SEO Tools:
Best Lists:
Sources & references
- [1] Princeton / Georgia Tech et al. — GEO research (arXiv:2311.09735)
- [2] @hridoyreh on X — Widely shared SEO skill tree: foundations, research, technical, on-page, content, links, AI SEO/GEO, analytics, UX, bran
- [3] @jakezward on X — 2026 SEO predictions emphasize AI Overview share-of-SERP, schema for LLM token efficiency, brand mentions in AI answers
- [4] Referenced source — databox.com

Researched, written, and published articles that compound organic traffic.
Weekly local SEO teardowns
One practical email a week. Map Pack, GBP, AI Overviews — no fluff. Unsubscribe anytime.