SEO KPIs (2026): Strategies, Tactics & Examples
Practical seo kpis guide strategies for 2026: step-by-step tactics, real examples, and tools to improve rankings and drive organic traffic.
Most SEO teams track too many metrics and report on the wrong ones. They build dashboards with 30 data points and still cannot answer the one question that matters: is SEO making us money?
SEO KPIs are the metrics that connect search performance to business outcomes. Not vanity numbers. Not raw data dumps. The specific indicators that prove whether your SEO investment is working.
60% of searches now end without a click. AI Overviews appear in 30% of search results. The KPIs that mattered in 2020 do not tell the full story in 2026.
We have published 3,500+ SEO articles across 70+ industries. Tracking the right KPIs is how we prove ROI for every client. This guide covers the exact metrics we track and how to use them.
Here is what you will learn:
- The difference between SEO KPIs and SEO metrics
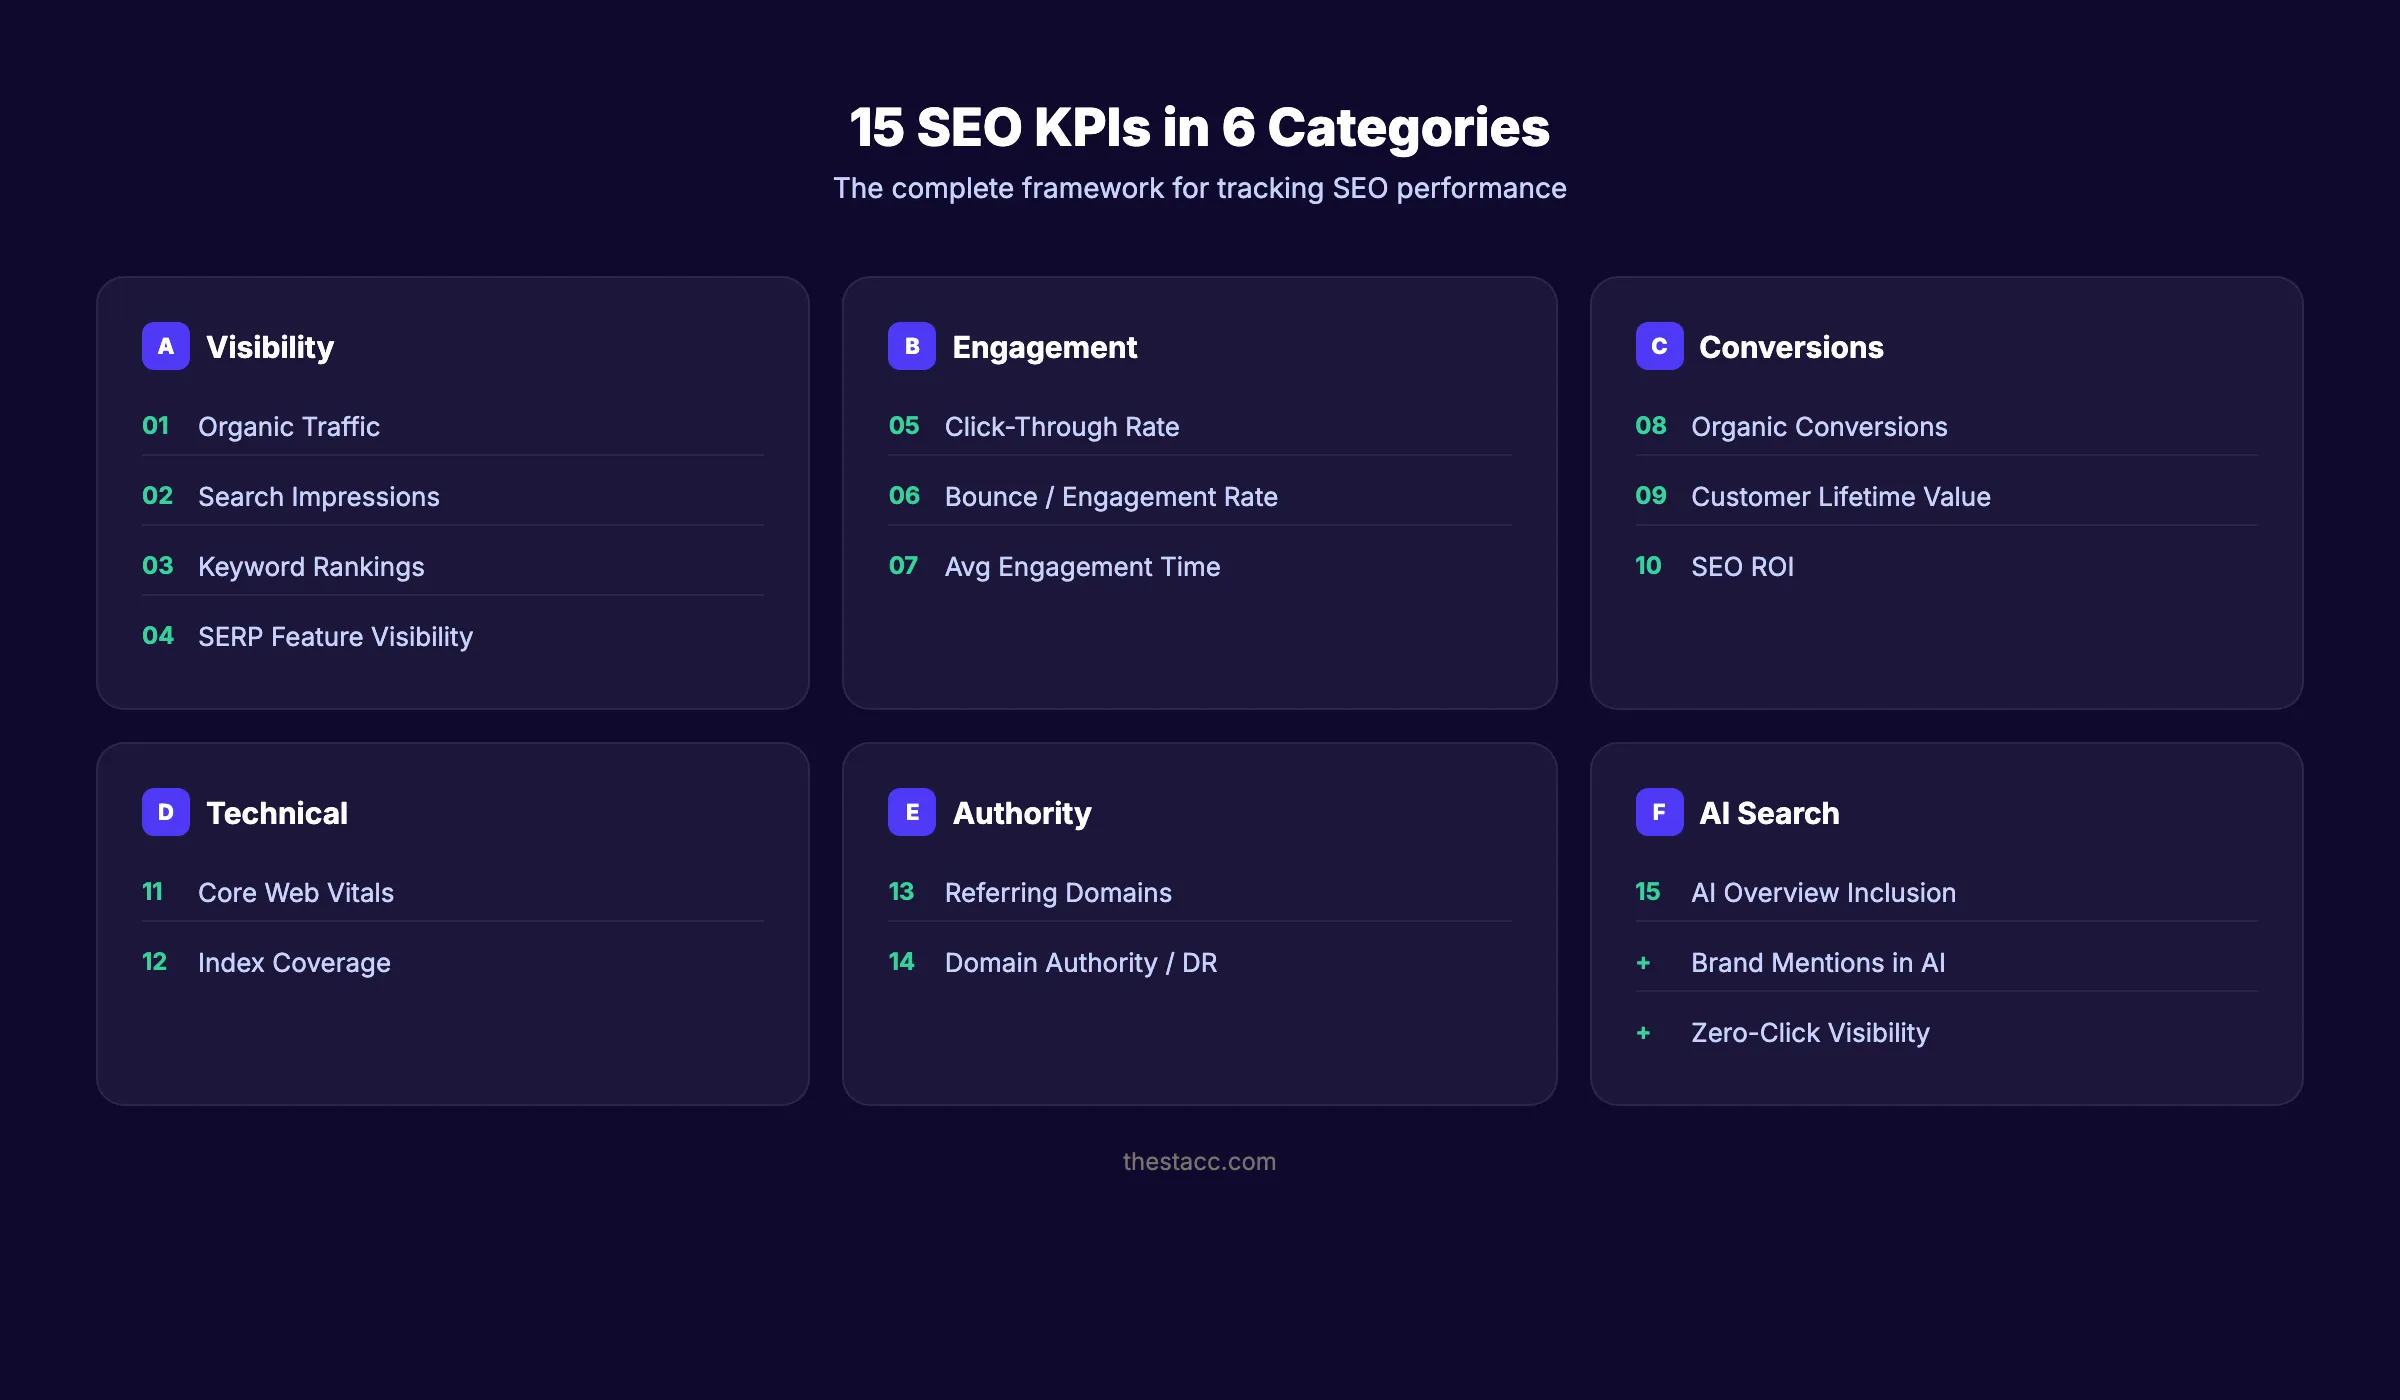
- 15 KPIs organized into 6 categories (visibility, engagement, conversion, technical, authority, AI search)
- Benchmark targets for each KPI by business type
- How to build an SEO reporting dashboard that executives understand
- The new AI search KPIs you should start tracking now
- Common KPI mistakes that lead to wasted budgets
What Are SEO KPIs?
SEO KPIs (Key Performance Indicators) are the specific metrics you choose to measure the success of your search engine optimization efforts against business goals.
Every KPI is a metric. Not every metric is a KPI.
Your website generates hundreds of data points. Page views, scroll depth, time on page, crawl frequency, index status, keyword positions. All of these are metrics. They describe what is happening. SEO KPIs are the subset you select because they indicate whether your strategy is working.
SEO KPIs vs SEO Metrics
| Aspect | SEO Metrics | SEO KPIs |
|---|---|---|
| Purpose | Describe activity | Measure progress toward goals |
| Scope | Everything measurable | Selected indicators only |
| Audience | SEO team (internal) | Stakeholders and leadership |
| Example | Pages crawled per day | Organic conversion rate |
| Action | Monitor and investigate | Report, optimize, and forecast |
A metric becomes a KPI when you assign it a target and tie it to a business objective. “Organic traffic” is a metric. “Grow organic traffic 20% quarter-over-quarter to hit 50,000 monthly visits by Q4” is a KPI.
How to Choose the Right SEO KPIs
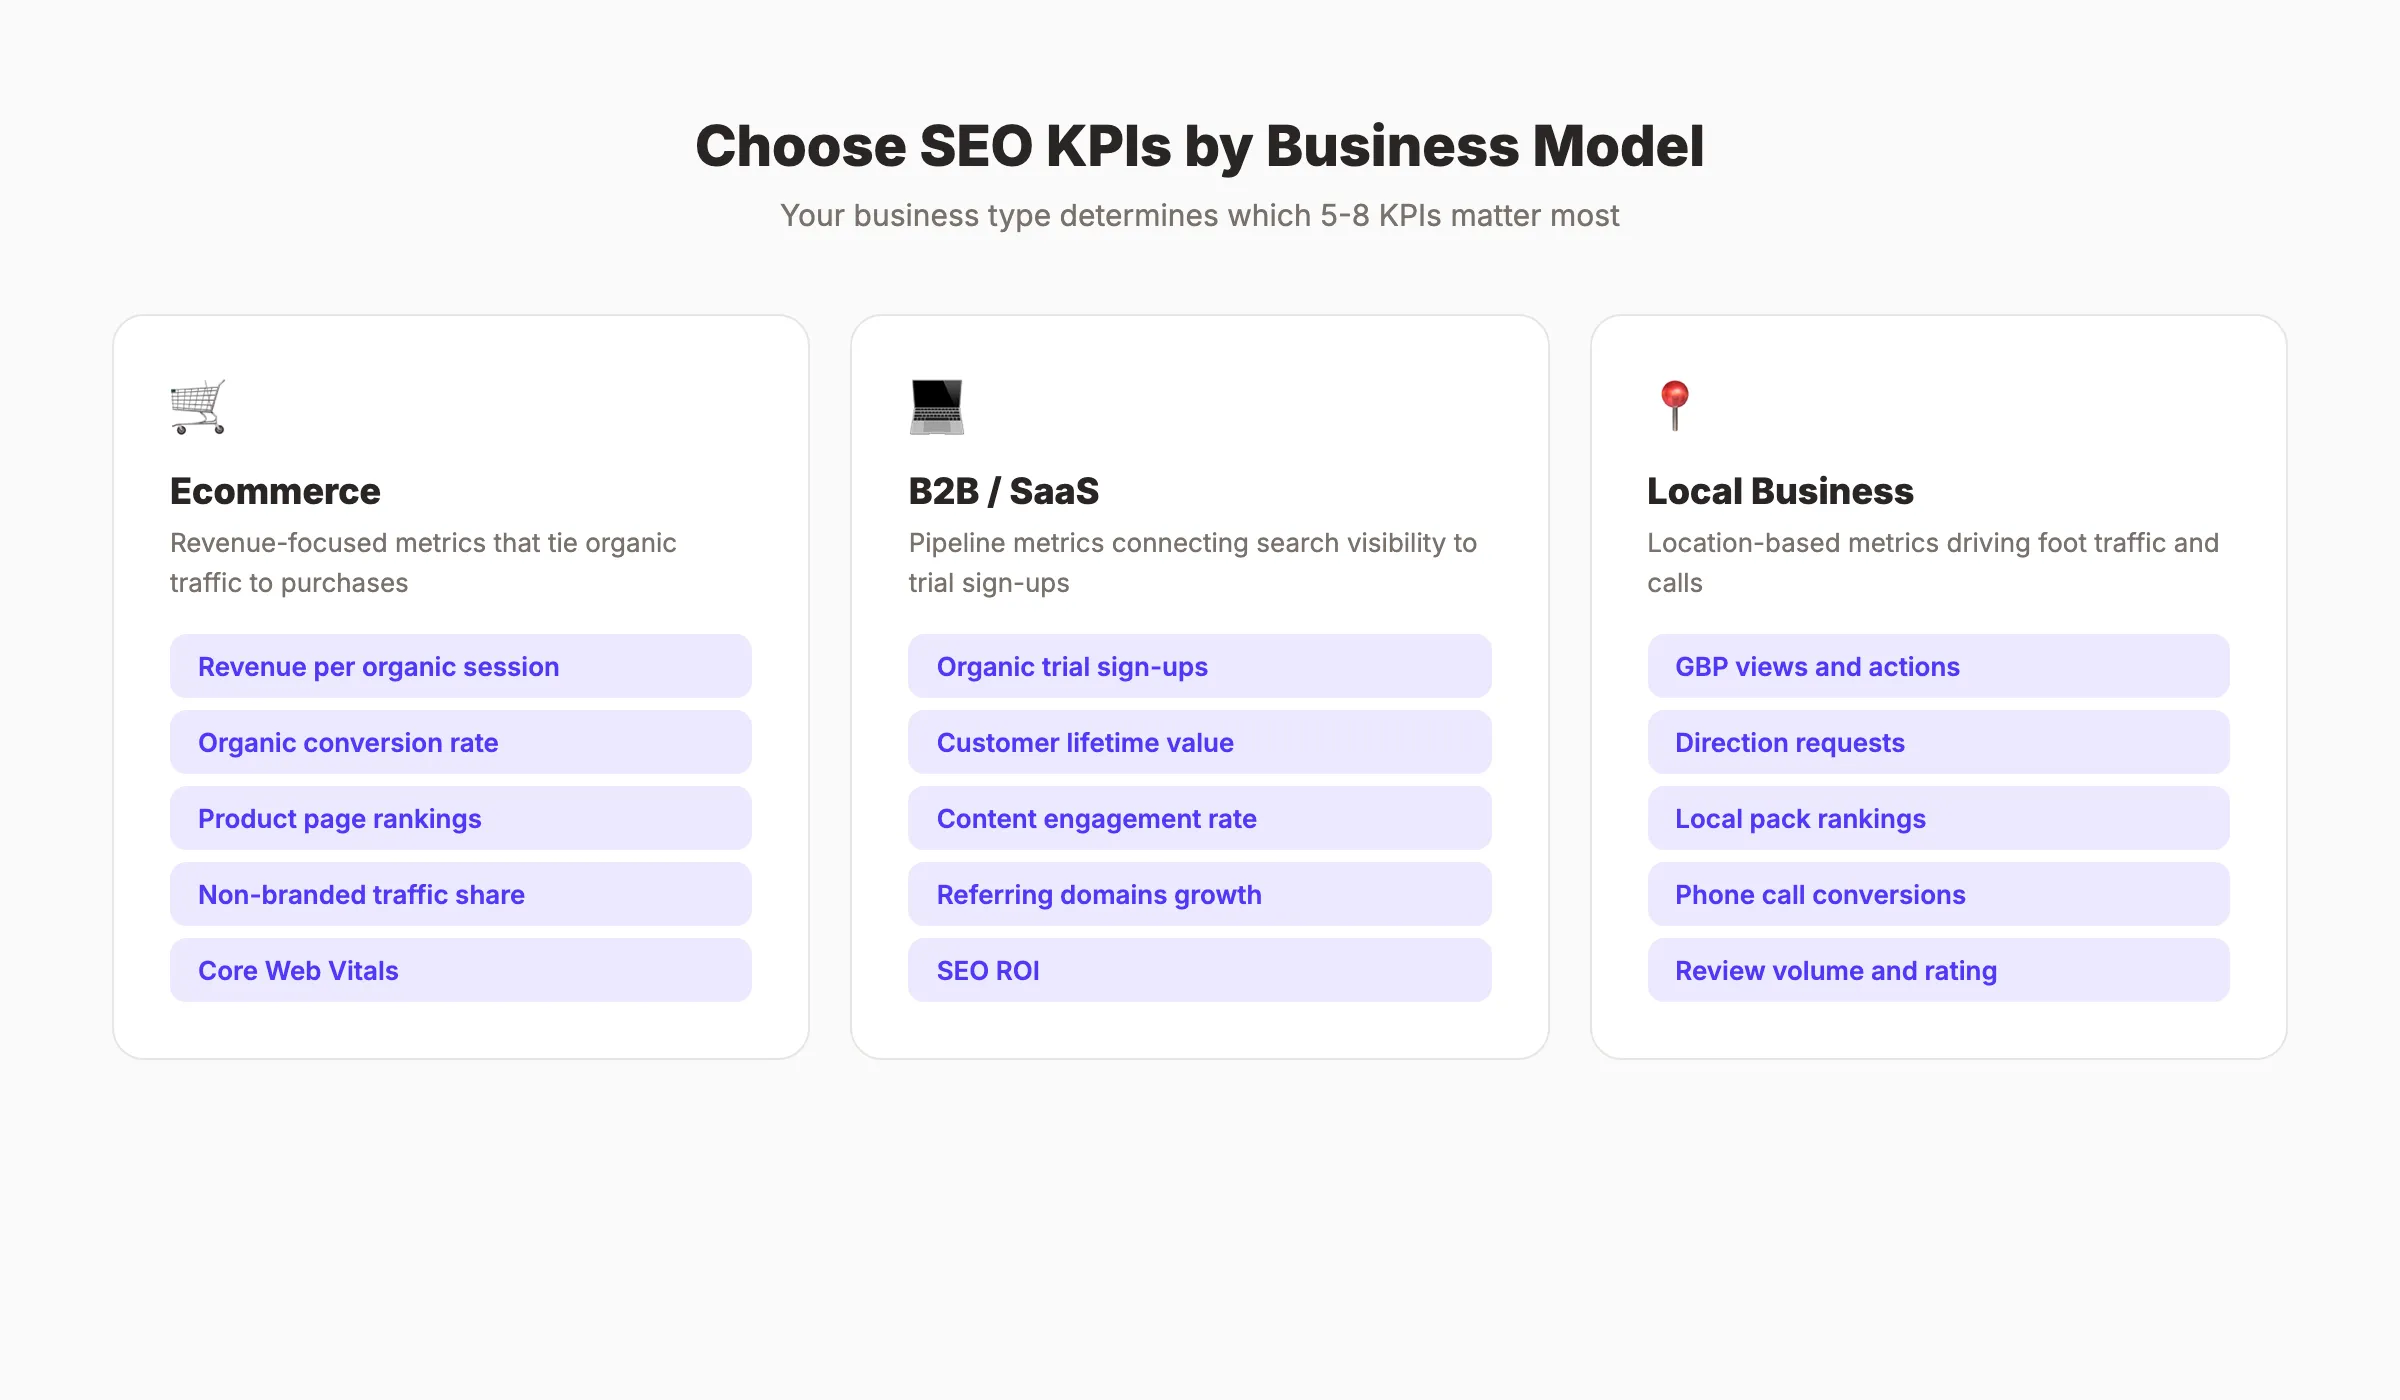
Not every business needs the same KPIs. Your selection depends on 3 factors:
- Business model. Ecommerce tracks revenue per organic session. SaaS tracks trial sign-ups from organic. Local businesses track direction requests and calls.
- SEO maturity. New sites focus on indexation and keyword visibility. Established sites focus on conversions and retention.
- Reporting audience. CMOs want revenue and ROI. SEO managers want rankings and traffic. Developers want Core Web Vitals and crawl health.
Choose 5 to 8 primary KPIs. Track everything else as supporting metrics.
Visibility KPIs
Visibility KPIs measure how often your site appears in search results and for which queries. These are the foundation of any SEO reporting framework.
1. Organic Traffic
The total number of sessions that arrive through unpaid search results. This is the most fundamental SEO KPI.
Where to track: Google Analytics 4 → Reports → Acquisition → Traffic acquisition → Filter by “Organic Search.”
Benchmarks:
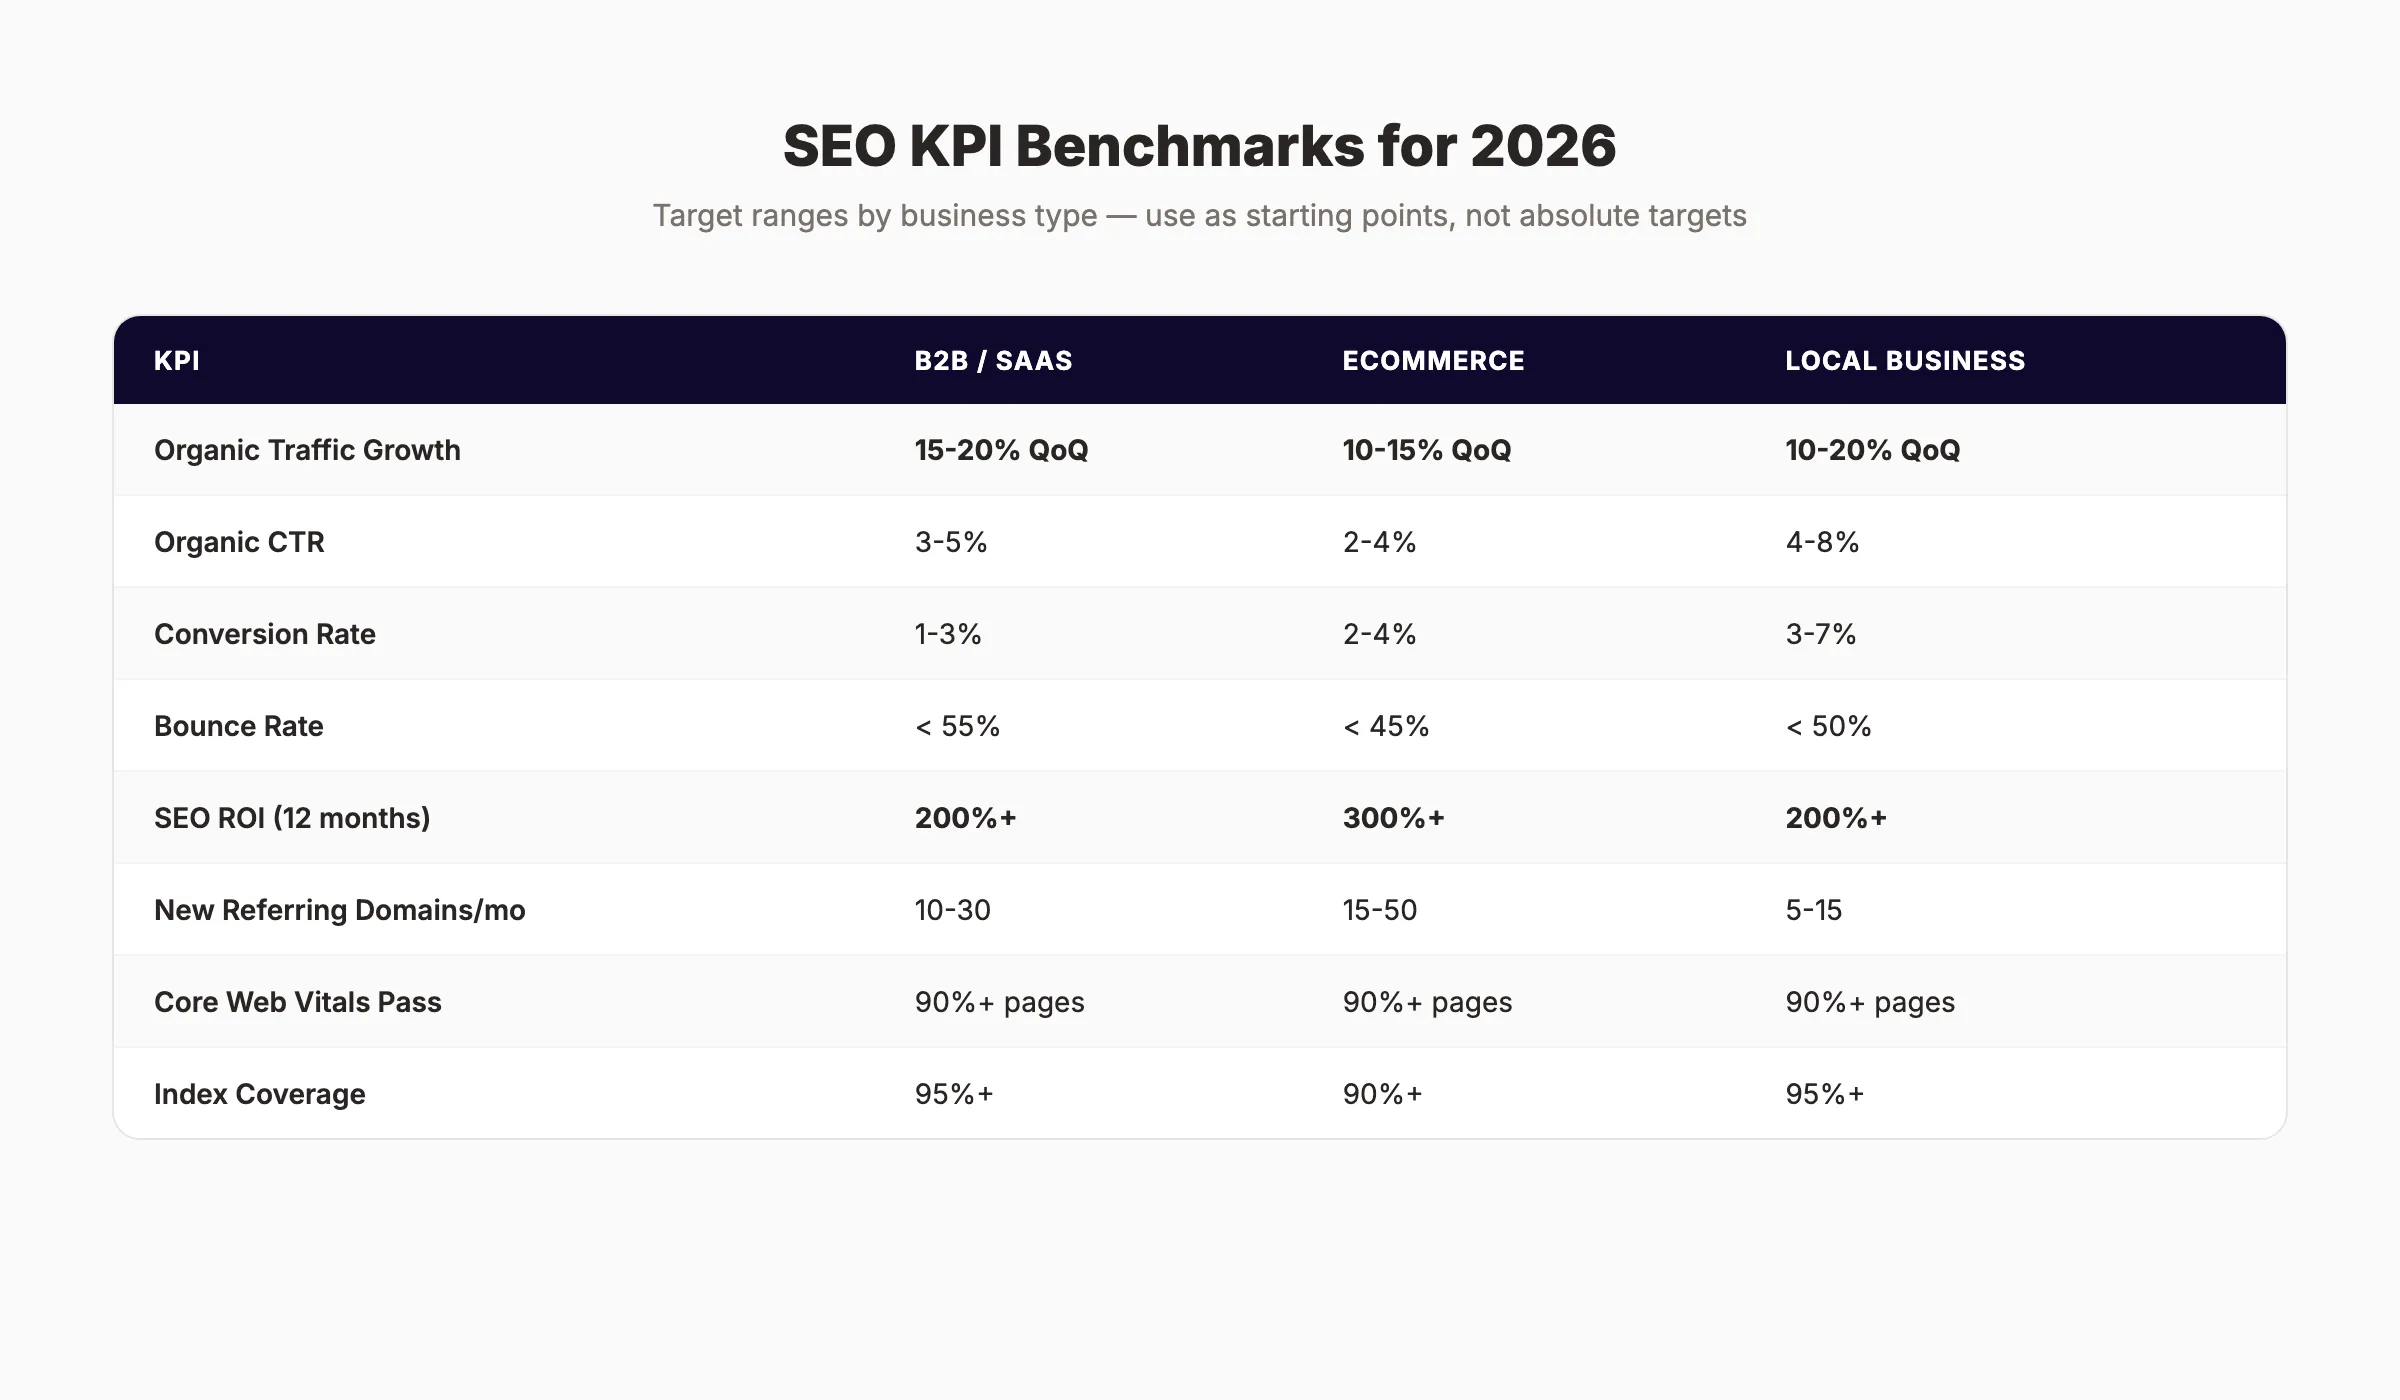
- Healthy SEO programs grow organic traffic 15 to 20% quarter-over-quarter
- B2B SaaS at $10M+ ARR targets 50,000+ monthly organic sessions
- Local businesses target 500 to 5,000 monthly organic sessions depending on market size
Watch out for: Total organic traffic alone does not tell you if traffic is qualified. Always pair with conversion data.
2. Search Impressions
The number of times your pages appear in search results, regardless of clicks. Impressions show your raw visibility in the search index.
Where to track: Google Search Console → Performance → Total impressions.
Why it matters: Impressions increase before clicks do. A rising impression count with flat traffic signals opportunity. Your pages rank but titles or descriptions need optimization to earn clicks.
3. Keyword Rankings
The positions your target pages hold for specific search queries. Track your primary keyword for each page and monitor movement over time.
Where to track: Google Search Console (free, limited), Ahrefs, Semrush, or similar SEO tools.
Benchmarks:
- Position 1 earns an average CTR of 27.6%
- Positions 1 to 3 capture over 50% of all clicks
- Page 2 (positions 11+) receives less than 1% of clicks
Do not obsess over individual keyword rankings. A single keyword can fluctuate 5 positions in a week due to algorithm updates, personalization, and location. Track ranking trends over 30 to 90 day windows.
4. SERP Feature Visibility
Your presence in featured snippets, People Also Ask boxes, knowledge panels, image packs, and local packs. SERP features occupy more real estate than standard organic results.
Where to track: Semrush Position Tracking, Ahrefs SERP Features report, or manual audits.
Stop writing. Start ranking. Stacc publishes 30 SEO articles per month for $99. Every article targets specific keywords and drives the organic traffic KPIs that matter. Start for $1 →
Engagement KPIs
Engagement KPIs measure what happens after a searcher clicks through to your site. Google uses engagement signals to evaluate content quality.
5. Click-Through Rate (CTR)
The percentage of impressions that result in a click. CTR measures how well your title tag and meta description persuade searchers to visit your page.
Where to track: Google Search Console → Performance → Average CTR.
Benchmarks:
- Average organic CTR across all positions: 3 to 5%
- Position 1 CTR: 27 to 31%
- Position 10 CTR: 2 to 3%
- Branded queries typically have 2 to 3x higher CTR than non-branded
How to improve: Write meta descriptions that include the target keyword, a clear benefit, and a freshness signal. Test title variations in GSC performance reports.
6. Bounce Rate and Engagement Rate
Bounce rate measures the percentage of sessions where users leave without interacting. In GA4, the inverse metric is “engagement rate.” An engaged session lasts 10+ seconds, has 2+ page views, or triggers a conversion event.
Where to track: GA4 → Reports → Engagement → Landing page.
Benchmarks:
- Average bounce rate across industries: 44%
- Blog content: 65 to 80% bounce rate is normal (informational intent)
- Product and service pages: target under 40%
- Engagement rate above 60% indicates healthy content
7. Average Engagement Time
The average time users actively engage with your page. This replaced “average session duration” in GA4 and only counts time when your tab is in focus.
Where to track: GA4 → Reports → Engagement → Pages and screens.
Why it matters: Longer engagement time correlates with higher content quality signals. Pages where users spend 2+ minutes consistently outperform pages with sub-30-second engagement in search rankings.
Conversion and Revenue KPIs
These are the KPIs that prove SEO generates revenue. Every other KPI exists to support these numbers.
8. Organic Conversions
The total number of goal completions from organic traffic. Conversions include form submissions, purchases, trial sign-ups, phone calls, demo requests, or any action tied to revenue.
Where to track: GA4 → Reports → Acquisition → Traffic acquisition → Conversions column filtered by organic search.
Benchmarks:
- B2B organic conversion rate: 1 to 3%
- Ecommerce organic conversion rate: 2 to 4%
- Local service businesses: 3 to 7% (phone calls + form fills)
This is the KPI that ties SEO directly to content marketing ROI. If organic traffic grows but conversions stay flat, the traffic is unqualified or the landing pages need work.
9. Customer Lifetime Value (CLV) from Organic
The total revenue a customer acquired through organic search generates over their relationship with your business.
Formula: CLV = Average Order Value x Purchase Frequency x Customer Lifespan
Example: A SaaS customer pays $99/month for an average of 14 months. CLV from organic = $1,386.
Why it matters: A keyword that drives 10 organic conversions per month at $1,386 CLV is worth $13,860/month in revenue. That context changes how you prioritize keyword research and content investment.
10. SEO ROI
The return on investment from your SEO program. This is the KPI that justifies your SEO budget to leadership.
Formula: SEO ROI = (Revenue from Organic - SEO Investment) / SEO Investment x 100
Example: $50,000 monthly organic revenue - $5,000 monthly SEO cost = $45,000 profit. ROI = 900%.
Benchmarks:
- Healthy SEO programs deliver 200%+ ROI within 12 months
- Top-performing programs report 500 to 1,000%+ ROI at scale
- SEO typically takes 3 to 6 months to show meaningful ROI
Your SEO team. $99 per month. 30 optimized articles, published automatically. Track your organic traffic and conversion KPIs grow month over month. Start for $1 →
Technical SEO KPIs
Technical KPIs measure the health of your site’s infrastructure. Poor technical health limits the ceiling of every other SEO KPI.
11. Core Web Vitals
Google’s page experience metrics. Three signals that directly affect rankings:
| Metric | What It Measures | Good Threshold |
|---|---|---|
| LCP (Largest Contentful Paint) | Load speed | Under 2.5 seconds |
| INP (Interaction to Next Paint) | Responsiveness | Under 200 milliseconds |
| CLS (Cumulative Layout Shift) | Visual stability | Under 0.1 |
Where to track: Google Search Console → Core Web Vitals report, or PageSpeed Insights.
INP replaced FID (First Input Delay) in March 2024. If your reports still show FID, update your tracking.
12. Index Coverage
The number of pages Google has successfully indexed versus the total pages on your site. Index coverage gaps mean content you created is invisible to search.
Where to track: Google Search Console → Indexing → Pages.
Common issues:
- Pages blocked by
robots.txt(check your configuration) - Noindex tags applied accidentally (noindex/nofollow guide)
- Soft 404 errors and redirect chains
- Crawl budget exhaustion on large sites
- Duplicate content without canonical tags
Target: 95%+ of important pages indexed. Exclude intentionally noindexed pages (admin, staging, filtered URLs) from this calculation.
Run a monthly SEO audit to catch index coverage issues before they compound. A single misconfigured robots.txt rule can deindex an entire content section overnight.
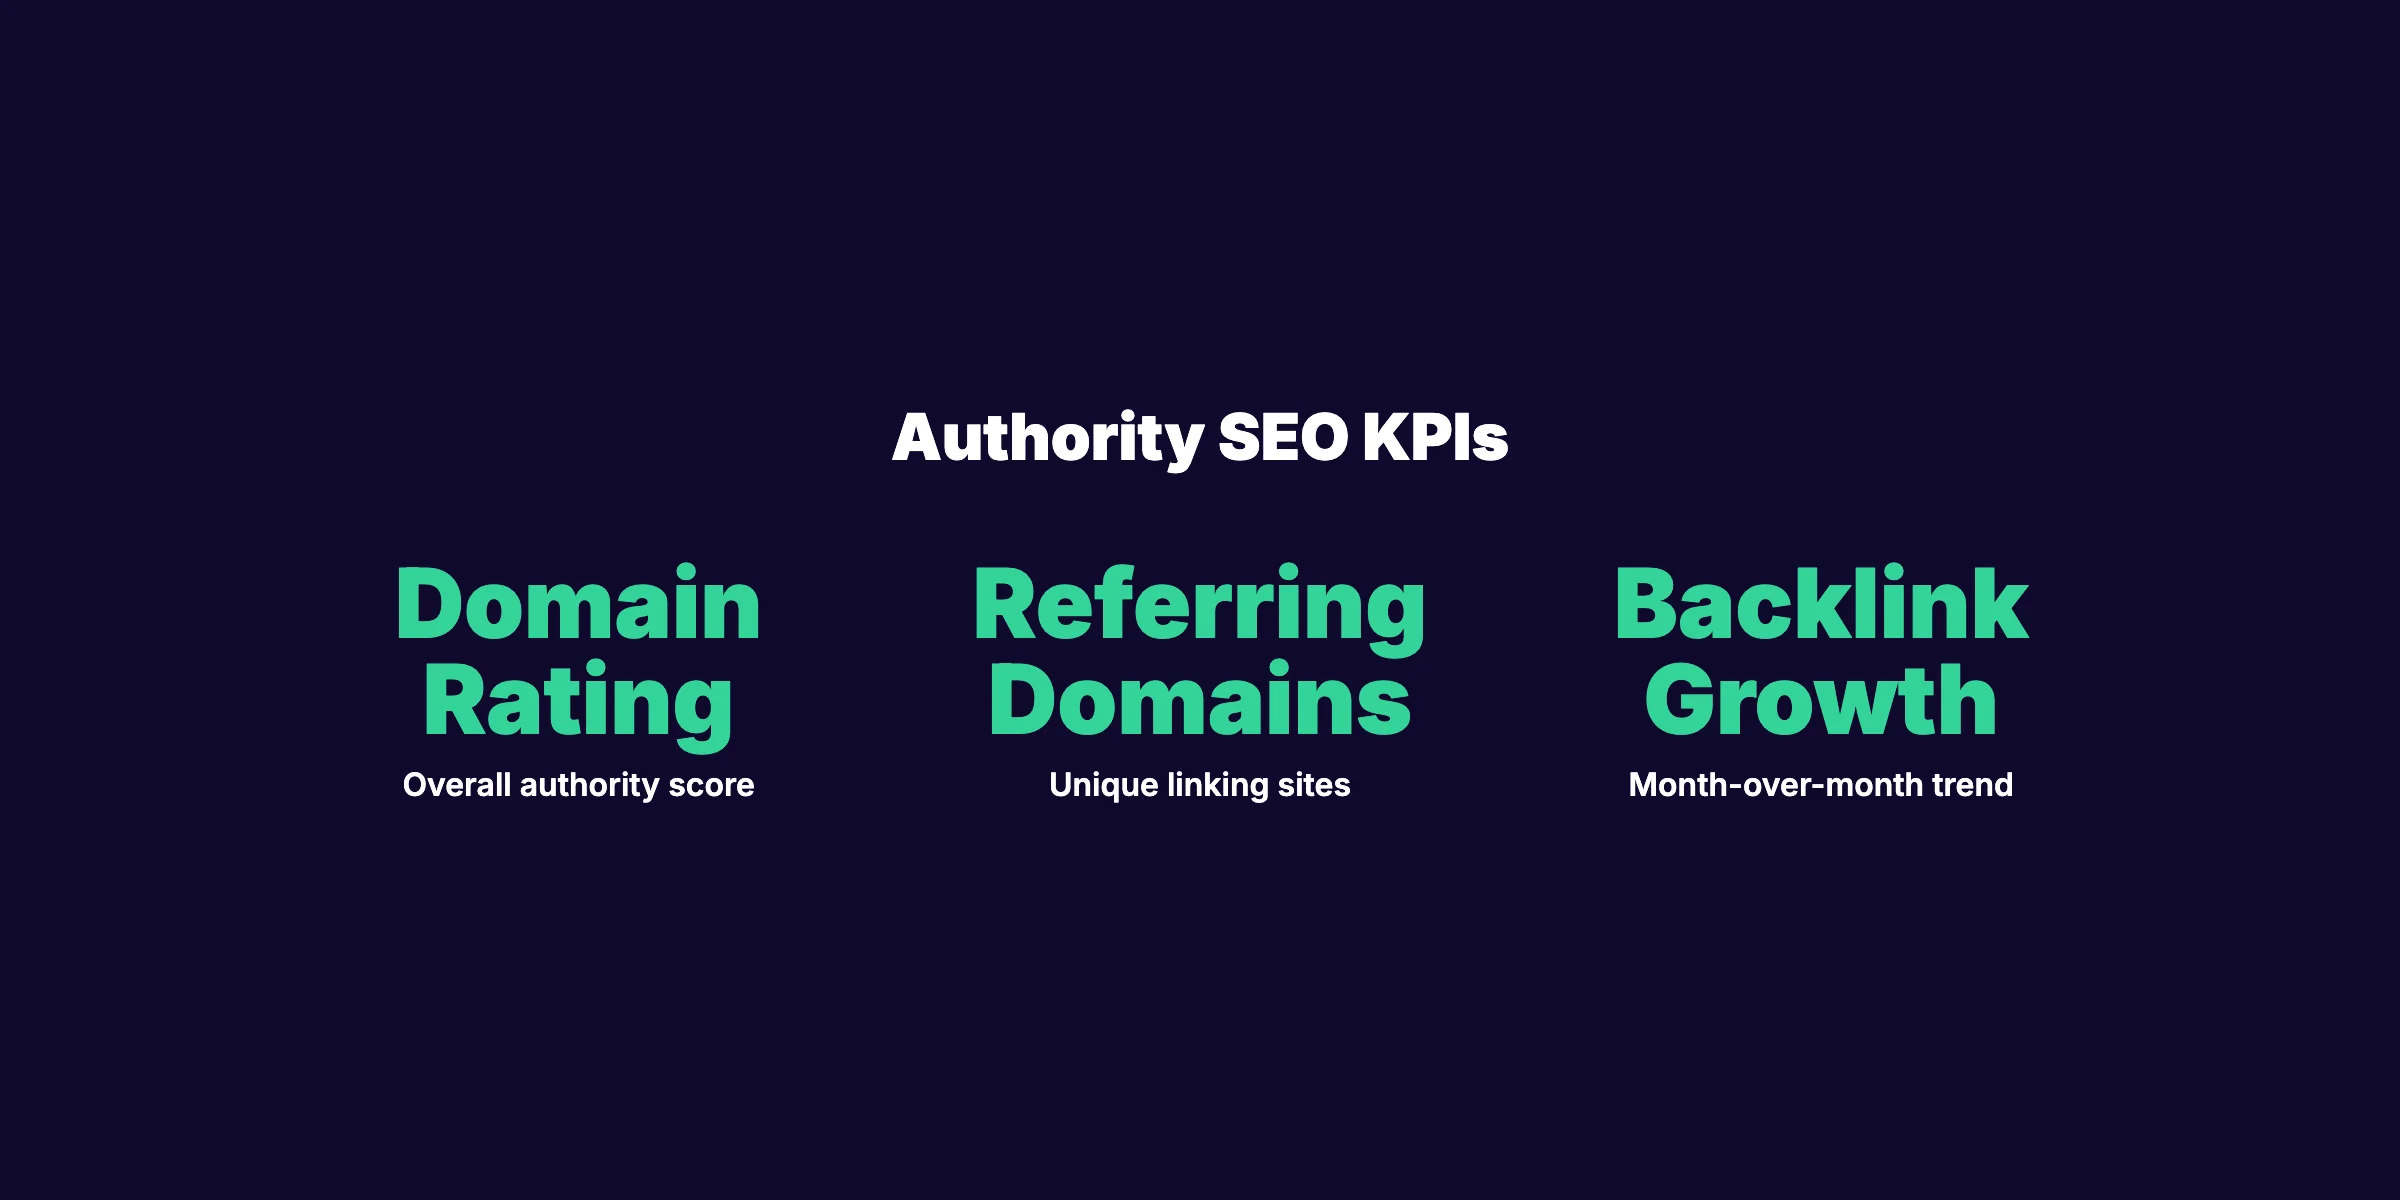
Authority KPIs
Authority KPIs measure how the web perceives your site’s credibility. These metrics influence rankings across every page on your domain.
13. Referring Domains
The number of unique websites linking to your site. Referring domains matter more than total backlink count because 100 links from 1 domain carry less weight than 1 link from each of 100 domains.
Where to track: Ahrefs, Semrush, or Moz. Free option: Google Search Console → Links → Top linking sites.
Benchmarks:
- New sites (under 1 year): 20 to 100 referring domains
- Established sites: 500 to 5,000+ referring domains
- Competitive niches require steady growth of 10 to 30 new referring domains per month
Pair this with a regular backlink audit to ensure link quality stays high and toxic backlinks do not accumulate.
14. Domain Authority / Domain Rating
Third-party scores (Moz DA, Ahrefs DR) that estimate your site’s ranking potential based on backlink profile strength.
Where to track: Ahrefs → Domain Rating, Moz → Domain Authority.
Important context: Google does not use DA or DR as a ranking factor. These are third-party estimates. They are useful for benchmarking against competitors and tracking directional progress over time. Do not treat them as targets to optimize for directly.
AI Search KPIs for 2026
Traditional SEO KPIs do not capture the full picture in 2026. AI Overviews, zero-click searches, and LLM-powered search experiences create new measurement needs.
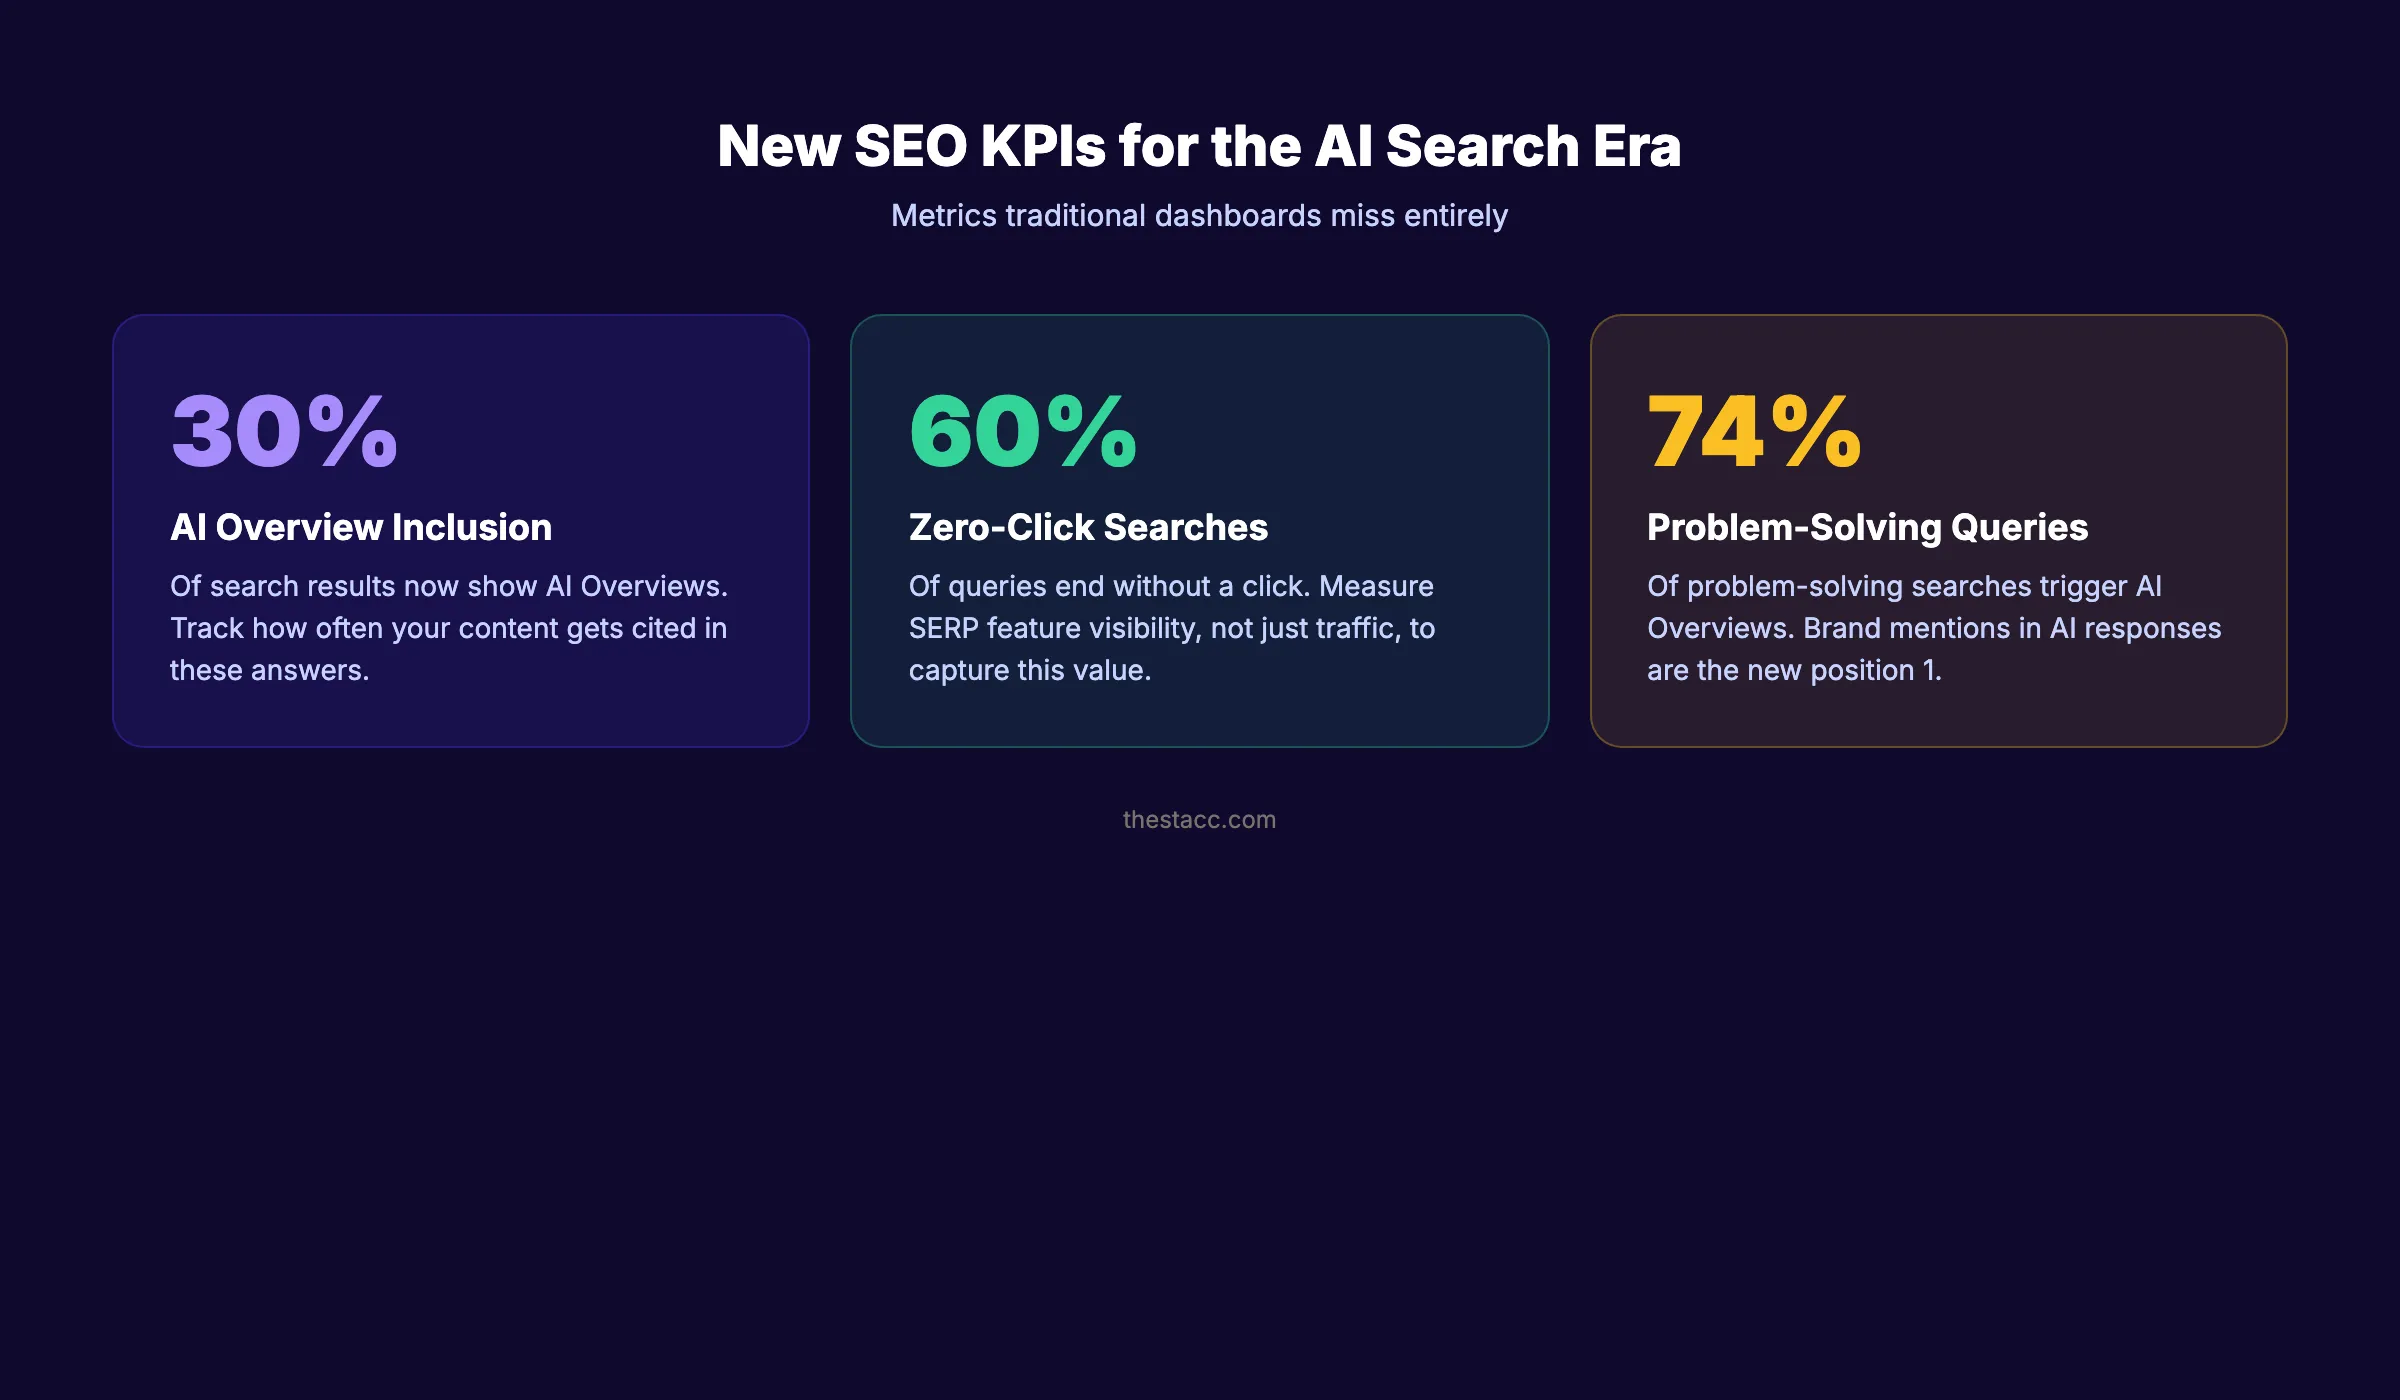
15. AI Overview Inclusion Rate
The percentage of your target keywords where your content appears in Google’s AI Overview or as a cited source.
Where to track: Manual audits, Semrush AI Overview tracking, or specialized tools like AI search visibility trackers.
Why it matters: AI Overviews appear in 30% of search results and 74% of problem-solving queries. Pages cited in AI Overviews receive visibility even when the searcher does not click through.
Brand Mentions in AI Responses
Track how often AI models (ChatGPT, Perplexity, Gemini, Claude) mention your brand when users ask questions in your domain.
Where to track: Manual prompt testing, brand monitoring tools, or GEO audits.
Why it matters: AI platforms are becoming discovery engines. A brand mention in a ChatGPT response is the new “position 1” for certain query types. Building E-E-A-T signals and topical authority increases your chances of AI citation.
Zero-Click Visibility
The percentage of your target queries where your content appears in SERP features (featured snippets, knowledge panels, PAA boxes) that answer the query without requiring a click.
60% of all Google searches end without a click to any website. For informational queries, that number is even higher. Zero-click visibility is not lost traffic. It is brand exposure, authority building, and potential conversion when the searcher returns later with commercial intent.
Track zero-click visibility alongside traditional traffic KPIs. A page that earns a featured snippet and answers the query directly may show declining clicks but increasing brand awareness. This is especially true for top-of-funnel informational content.
The shift toward AI search means your KPI framework must evolve. Businesses that only measure clicks and sessions miss the growing portion of search value that happens before the click. Start building AI search KPIs into your dashboard now, even if the measurement tools are still maturing.
3,500+ blogs published. 92% average SEO score. Every article is optimized for both traditional search and AI discovery. See what Stacc can do for your site. Start for $1 →
How to Set SEO KPI Targets
A KPI without a target is just a number. Here is how to set targets that drive action.
Start With Business Goals
Work backward from revenue. If the business needs $100,000 in monthly organic revenue and your average organic conversion value is $500, you need 200 organic conversions per month.
If your organic conversion rate is 2%, you need 10,000 monthly organic sessions. If your average CTR is 5%, you need 200,000 monthly impressions. Each KPI target flows from the one above it.
Use Historical Baselines
Never set targets without baselines. Pull 6 to 12 months of historical data for every KPI. Targets should represent realistic improvement over your current performance, not arbitrary numbers.
| KPI | Baseline Example | Realistic Target |
|---|---|---|
| Organic traffic | 8,000/month | 10,000/month (+25% in 6 months) |
| Organic conversions | 80/month | 120/month (+50% in 6 months) |
| Average CTR | 3.2% | 4.0% (+0.8 points in 6 months) |
| Referring domains | 150 | 250 (+100 in 6 months) |
| Core Web Vitals pass | 60% of pages | 90% of pages in 3 months |
Benchmark Against Competitors
Use competitor analysis tools to understand what good looks like in your niche. If the top 3 competitors average 300 referring domains and you have 50, that gap defines your authority KPI target.
Building Your SEO KPI Dashboard
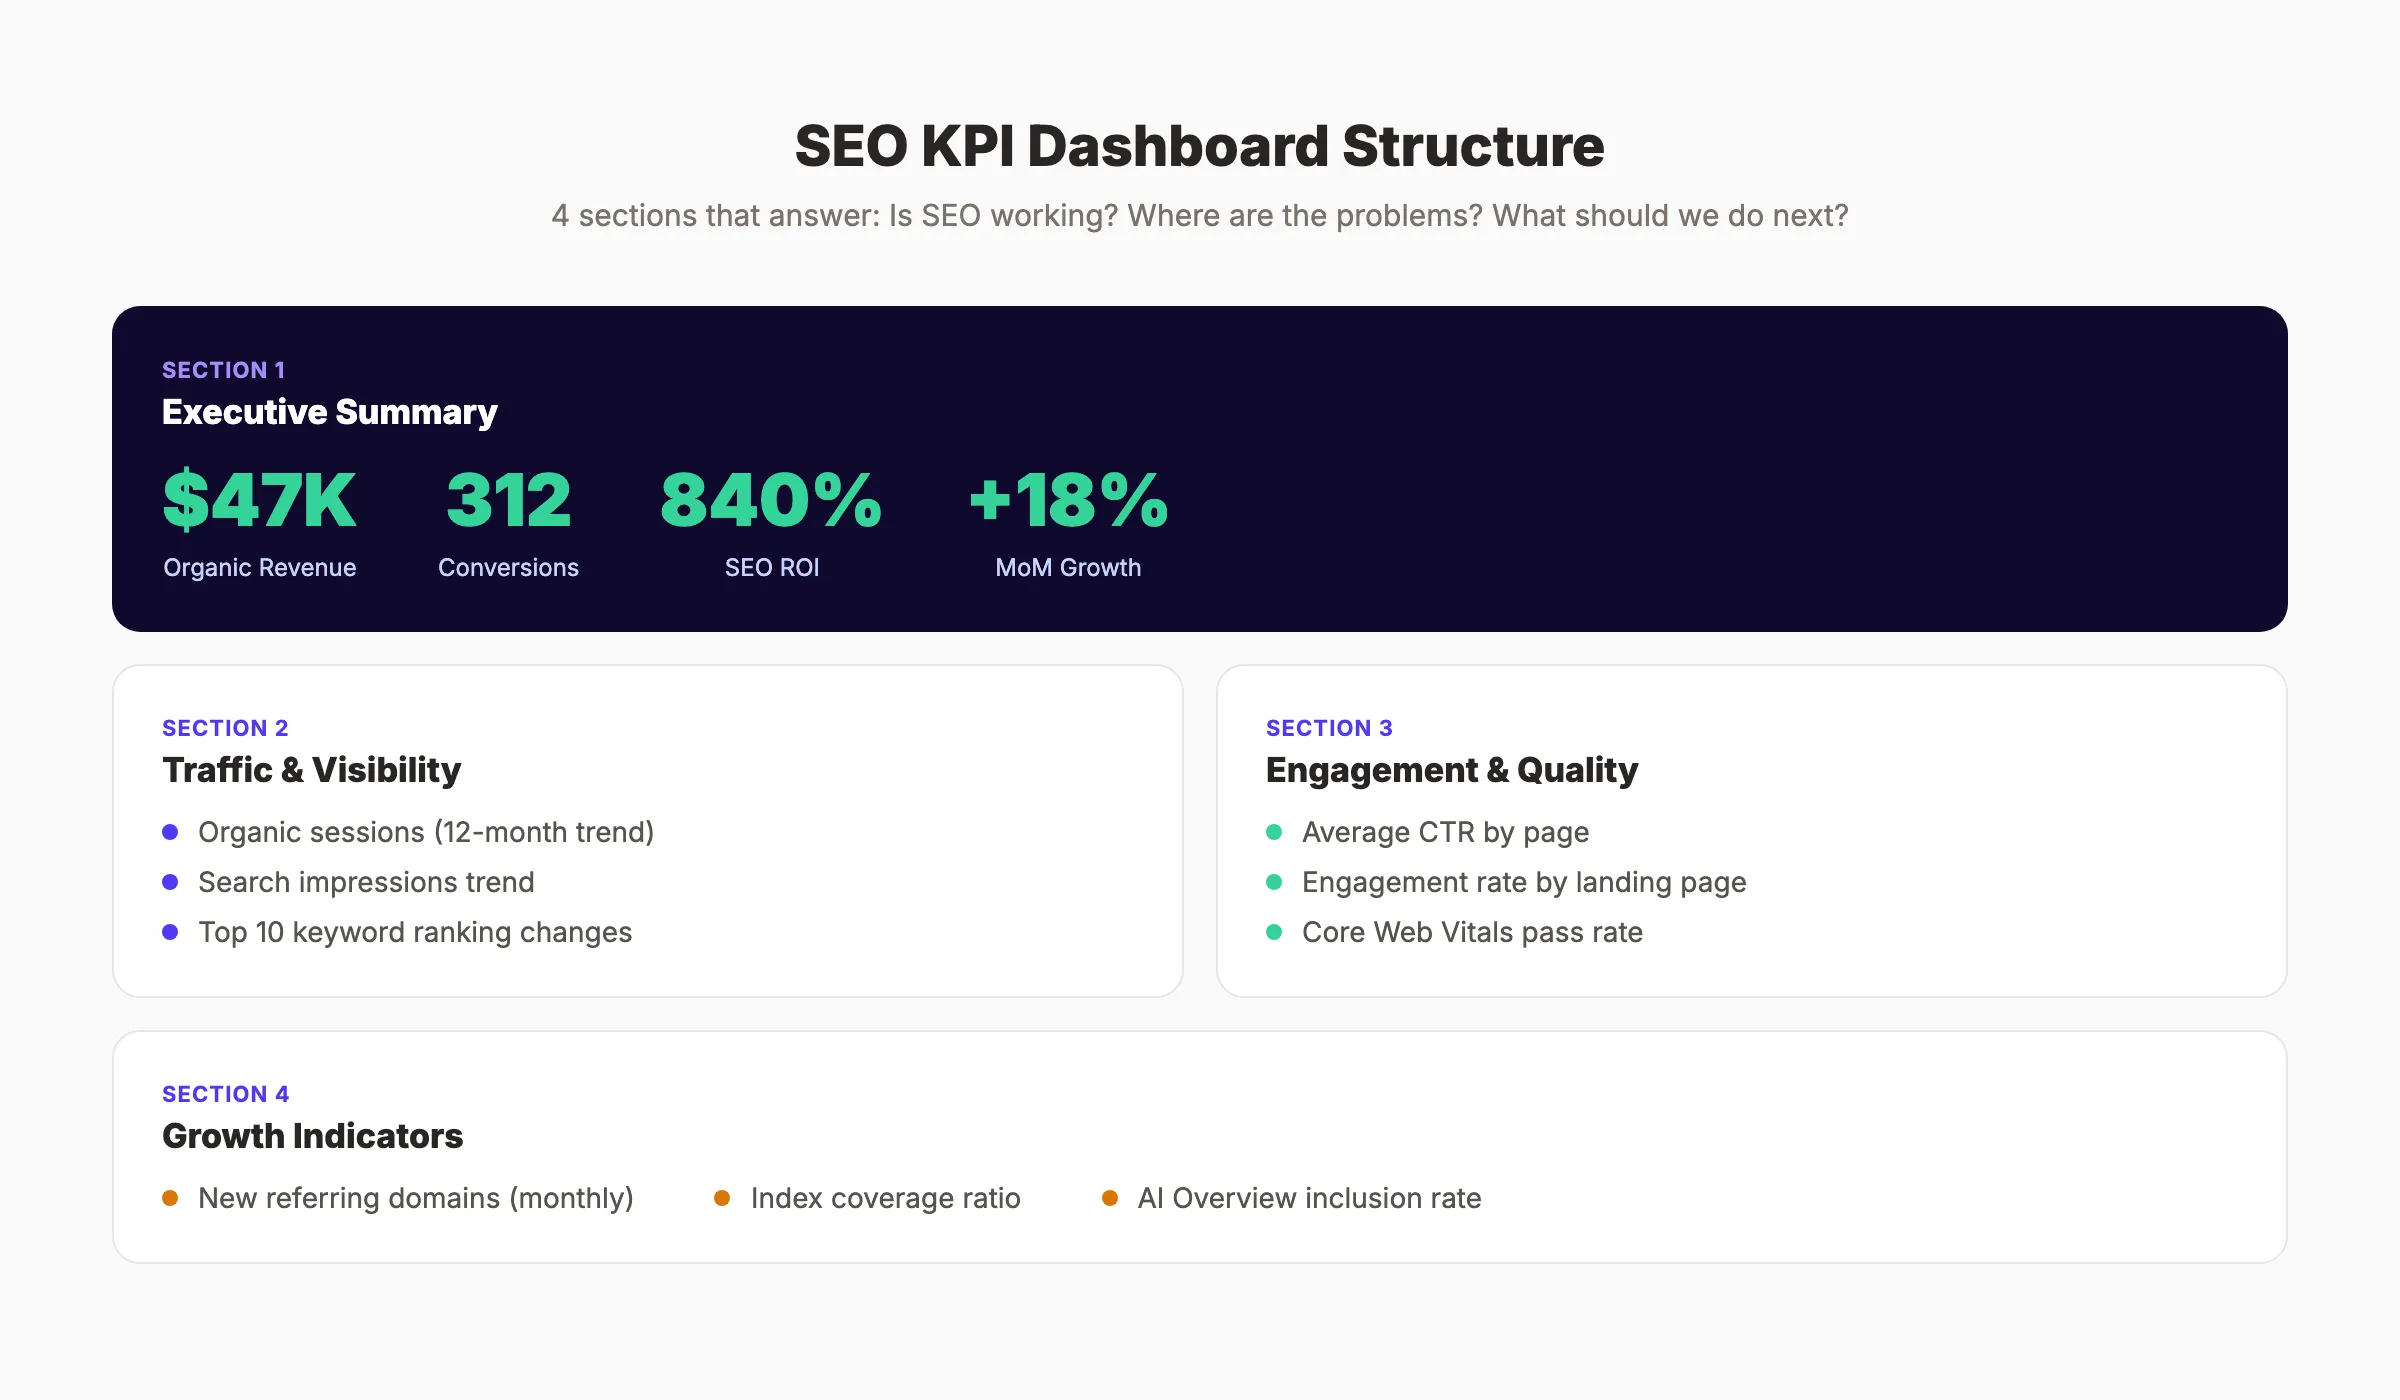
A dashboard should answer 3 questions in under 30 seconds: Is SEO working? Where are the problems? What should we do next?
Dashboard Structure
Organize your dashboard into 4 sections:
Section 1: Executive Summary (top row)
- Total organic revenue (month over month)
- Organic conversion count (month over month)
- SEO ROI percentage
Section 2: Traffic and Visibility
- Organic sessions trend (12-month chart)
- Search impressions trend
- Top 10 keyword ranking changes
Section 3: Engagement and Quality
- Average CTR
- Engagement rate by landing page
- Core Web Vitals status (pass/fail percentage)
Section 4: Growth Indicators
- New referring domains (monthly)
- Index coverage ratio
- AI Overview inclusion rate
Recommended Tools
| Tool | Best For | Cost |
|---|---|---|
| Google Search Console | Impressions, CTR, rankings, index coverage | Free |
| Google Analytics 4 | Traffic, engagement, conversions | Free |
| Looker Studio | Custom dashboards combining GSC + GA4 | Free |
| Ahrefs / Semrush | Backlinks, DA/DR, competitor benchmarking | $99 to $449/month |
| Screaming Frog | Technical SEO audits and crawl health | Free (500 URLs) / $259/year |
Start with the free tools. They cover 80% of what most businesses need. Add paid tools when you outgrow manual tracking or need competitive keyword analysis.
Common SEO KPI Mistakes
These errors waste reporting time and lead to bad decisions.
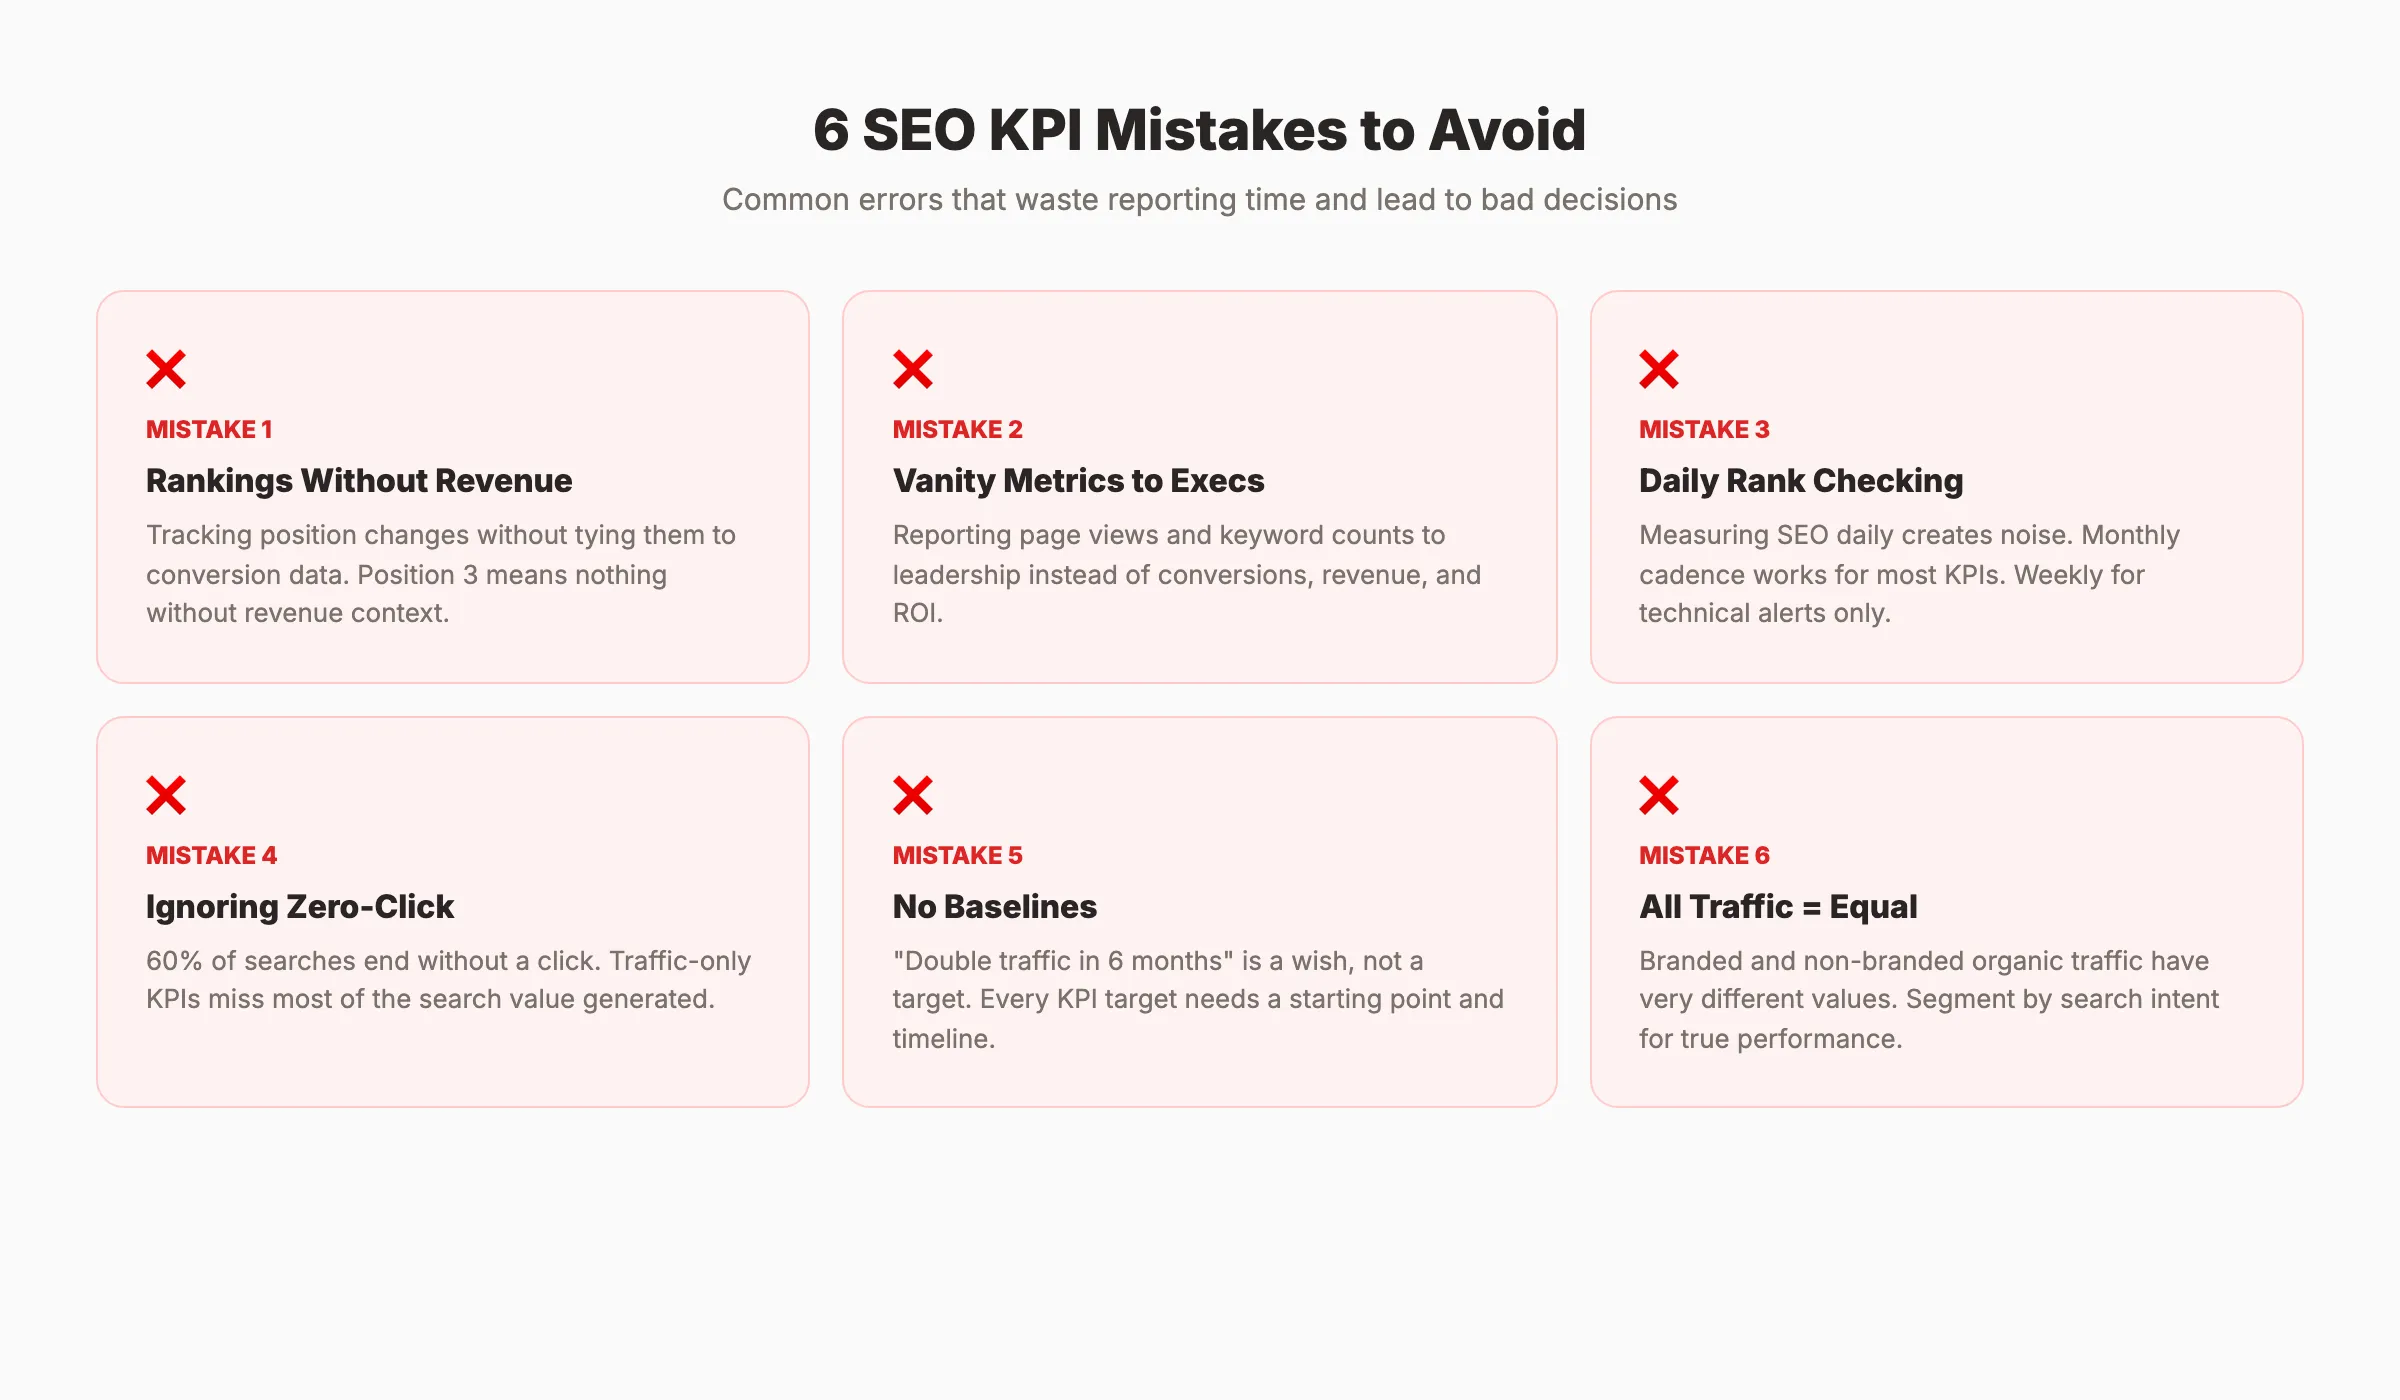
Mistake 1: Tracking rankings without revenue context. A keyword that moves from position 8 to position 3 means nothing if it drives zero conversions. Always pair ranking KPIs with conversion data. The goal is revenue, not positions.
Mistake 2: Reporting vanity metrics to stakeholders. Page views, total impressions, and “keywords ranked” sound impressive but do not answer business questions. Report organic conversions, revenue, and ROI to executives. Save granular metrics for the SEO team.
Mistake 3: Measuring too frequently. SEO moves slowly. Daily ranking checks create noise and anxiety. Monthly reporting cadence works for most KPIs. Weekly checks work for technical SEO alerts only.
Mistake 4: Ignoring zero-click and AI search metrics. If you only track traffic-based KPIs, you miss 60% of what search looks like today. Add SERP feature visibility and AI citation tracking to your dashboard.
Mistake 5: Setting targets without baselines. “Double organic traffic in 6 months” is not a target. It is a wish. Every target must reference a starting point, a timeline, and a realistic growth rate based on historical data and competitive context.
Mistake 6: Treating all organic traffic as equal. 1,000 visits from branded queries and 1,000 visits from commercial-intent keywords have very different values. Segment organic traffic by search intent to understand true performance.
Skip the agency. Keep the results. Stacc starts at $99/mo with a $1 Strategy trial. Track your KPIs and watch organic traffic grow. Start for $1 →
FAQ
What are the most important SEO KPIs?
The 5 most important SEO KPIs for most businesses are organic conversions, organic traffic, keyword rankings, click-through rate, and SEO ROI. Conversions matter most because they directly connect search performance to revenue. The other 4 KPIs support and explain conversion performance.
How many SEO KPIs should I track?
Track 5 to 8 primary KPIs. More than 8 creates dashboard clutter and dilutes focus. Choose KPIs that align with your business model and SEO maturity level. Monitor additional metrics as supporting data but do not report them as KPIs to stakeholders.
How often should I report on SEO KPIs?
Monthly reporting works best for most SEO KPIs. SEO changes take weeks to materialize. Daily or weekly reports create noise and false signals. The exception is technical KPIs like Core Web Vitals and crawl errors, which can warrant weekly monitoring.
What is a good organic conversion rate?
B2B businesses typically see 1 to 3% organic conversion rates. Ecommerce sites average 2 to 4%. Local service businesses can reach 3 to 7% because their organic traffic often has high purchase intent. These benchmarks vary by industry, funnel stage, and how you define a conversion.
How do I prove SEO ROI to my boss?
Calculate SEO ROI using this formula: (Revenue from Organic - SEO Investment) / SEO Investment x 100. Use GA4 to attribute revenue to organic traffic. Present monthly organic revenue alongside SEO costs and show the trend over 6 to 12 months. Healthy SEO programs deliver 200%+ ROI within the first year.
What are the new SEO KPIs for AI search?
The 3 new KPIs for 2026 are AI Overview inclusion rate (how often your content appears in Google AI Overviews), brand mention tracking in LLM responses (ChatGPT, Perplexity, Gemini), and zero-click visibility score (your presence in SERP features that answer queries directly). These supplement, not replace, traditional SEO metrics.
SEO KPIs work when they connect effort to outcomes. Pick the 5 to 8 metrics that matter for your business. Set targets grounded in baselines. Report monthly. And make sure every KPI on your dashboard answers the question: is SEO making us money?
Related Tools & Resources
Free SEO Tools:
Best Lists:

Written by
Siddharth GangalSiddharth is the founder of theStacc and Arka360, and a graduate of IIT Mandi. He spent years watching great businesses lose organic traffic to competitors who simply published more. So he built a system to fix that. He writes about SEO, content at scale, and the tactics that actually move rankings.
30 SEO blog articles published every month
Keyword-optimized, scheduled, and live on your site. Automatically.
30-day trial · Cancel anytime
theStacc
Stop writing SEO content manually
30 blog articles, 30 GBP posts, and social media content. Published every month. Automatically.
Start Your $1 Trial$1 for 3 days · Cancel anytime